*Corresponding author E-mail: [email protected]
EVALUATION OF NOAA CARBON TRACKER GLOBAL CARBON DIOXIDE
PRODUCTS
R. K. Nayak1*, E. N. Deepthi2, V.K. Dadhwal1, K.H. Rao1, and C.B.S. Dutt1 1
National Remote Sensing Center (NRSC), ISRO, Balanagar, Hyderabad, India-500625 2
Centre for Atmosphere and Ocean Sciences, Kochin University of Science and Technology
[email protected], Phone No. +91-402387954576 Commission VI, WG VI/4
KEY WORDS: Carbon dioxide, greenhouse gas, global warming, AIRS, GOSAT, NOAA Carbon Tracker
ABSTRACT:
Inter-comparison between National Oceanic and Atmospheric Administration Carbon Tracker (NOAACT) CO2 with satellite observations were carried out in this study. The satellite observations used here are mid troposphere CO2 based on Atmosphere
Infrared Sounder (AIRS) on board NASA’s Aqua and lower troposphere CO2 based on Greenhouse-gas Observing Satellite (GOSAT) of Japanese Aerospace Exploration Agency (JAXA). There exists good agreement between the seasonal cycles as estimated by NOAACT and Satellite observations. The mid troposphere CO2 exhibits distinct annual cycle in the northern hemisphere with positive detrended value during January-June and negative values during July-December. In the southern hemisphere, the annual cycle is less prominent and opposite phase with respect to the northern hemisphere. The lower tropospheric CO2 in both the hemispheres exhibits mixed signature of annual and semi-annual cycle. The amplitudes of the variability are significantly larger in the northern hemisphere than the southern hemisphere. The inter-annual variability of annual growth rates from the NOAACT is comparable with satellite observations however NOAACT could not resolved the spatial patterns of long-term growth rate as observed in the satellite observations.
1. INTRODUCTION
Carbon dioxide (CO2) is a major greenhouse gas in our atmosphere. Its rapid increasing rate is the major concern about today’s global warming and climatic change. Ithas increased by 40% since pre-industrial times, from 280 parts per million by volume (ppmv) to more than 391 ppmv in 2012 (Trends in Carbon Dioxide-NOAA/ESRL).Much of thecurrent increasing trend of CO2 is attributable to the 6-fold increase in human use of fossil fuel (coal and hydrocarbons), deforestation and other anthropogenic CO2 emission (IPCC AR4 SYR 2007). According to Global Carbon Budget report 2012 (Peters et al., 2012, Andres et al., 2012, Tans, 2012) fossil fuel CO2 emissions increased by 5.9% in 2010, with a total of 9.1±0.5 PgC emitted to the atmosphere (33.4 Pg of CO2; 1 Pg = 1 billion tons). These emissions were the highest in human history.
Present understanding on regional and global carbon cycle has large uncertainties because of not having sufficient data and appropriate modeling procedure to address spatio-temporal variability of carbon cycle in past studies. Cultural diversity,
economic status, technological challenges, and differences in political and social understanding among different nations could further complicate the issue. Enhancing the monitoring networks and establishing proper modeling procedures are paramount for understanding the spatio-temporal nature of atmospheric CO2 source and sink and associated causes.
Towards this, a number of national and international efforts have been initiated in the recent past by different government and non-government agencies across the globe. Some of these programs are North American Carbon Program, CarboEurope IP, CarboAfrica, National Carbon Project of Indian Space Research Organization etc. Besides establishment of ground-based networks, space ground-based observation programs such as Atmospheric InfraRed Sounder (AIRS) and SCanning Imaging Absorption spectroMeter for Atmospheric CartograpHY (SCHIAMACHY) are being operationalized since 2002. More recently, Greenhouse Gas Observing Satellites (GOSAT) is operational for measuring atmospheric CO2 since September 2009. In the modeling front, NOAA CarbonTracker (CT) is an The International Archives of the Photogrammetry, Remote Sensing and Spatial Information Sciences, Volume XL-8, 2014
ISPRS Technical Commission VIII Symposium, 09 – 12 December 2014, Hyderabad, India
This contribution has been peer-reviewed.
integrated modeling system that gives the data of various CO2 components due to terrestrial biosphere exchange with atmosphere, wildfire emissions, fossil fuel emissions and air-sea exchange. The atmospheric transport is simulated using the global two-way nested Transport Model 5(TM5) and is forced by the time-varying meteorology from the European Centre for Medium-Range Weather Forecasts (ECMWF) data. It was first released in February 2007(CT2007). It used to update once per year in the fall to include new data and model improvements. The updated calculations are produced for the year 2000 through the most recent complete year of observations. Carbon-Tracker 2011 (CT2011) is the sixth release of the NOAA CT (ftp://aftp.cmdl.noaa.gov/products/carbontracker). This product has been used by Policy makers, industry, scientists and the public to make decisions to limit greenhouse gas levels in the atmosphere. In this context its evaluation at different spatial and temporal scales are essential. Thus, this research has the aim to evaluate NOAA CT by comparing it with AIRS and GOSAT observations.
2. DATA AND METHODS
AIRS is a new generation space-born Infra-Red (IR) sounder launched into Earth-orbit along with Advanced Microwave Sounding Unit (AMSU-A) on May 4, 2002 by the Aqua satellite under the NASA Earth Observation Program with an intent of extracting valuable information about tropospheric variations of carbonaceous trace gases, namely about variation of column-average CO2 mixing ratio. It is a hyper spectral sensor with 2378 spectral channels within 0.41-15.4 microns with 15 dedicated channels are for CO2 (9 long wave channels within the band 699-705 cm-1 and 6 short wave channels within the band 1939-2107 cm-1). Using these observations, AIRS team at NASA retrieved the mid troposphere (at 443 hPa) CO2. These retrievals were based on inverse modelling of radiative transfer processes where clear sky observations at CO2 dedicated channels were used in atmospheric radiative transfer model (Madd et al. 2008).
The GOSAT was launched in January 2009 which is a joint effort of the Ministry of Environment (MOE), National Institute
for Environmental Studies (NIES) and Japan Aerospace Exploration Agency (JAXA). It is equipped with two sensors: the Thermal and Near-infrared Sensor for Carbon Observation-Fourier Transform Spectrometer (TANSO-FTS) and the Cloud and Aerosol Imager (CAI) (Kuze et al.2006). TANSO-FTS detects short-wavelength infrared (SWIR) light reflected from the earth’s surface, along with the thermal infrared (TIR) radiation emitted from the ground and atmosphere. It has three narrow bands in the SWIR region (0.76, 1.6, and 2.0 μm) and a wide TIR band (5.5-14.3μm) at a spectral resolution of about 0.2 cm-1. The CO2 absorption bands near 1.6 μm and 2.0 μm provide information on the near-surface concentrations (Yokota et al., 2011). On the other hand, the TIR absorption band around 14 μm is used to obtain information on the profiles of CO2 mainly at altitudes above 2 km (Saitoh et al., 2009). In the present study we used the near surface air xCO2 for a period of 2009 and 2010 with 2.5°×2.5° spatial resolution obtained from GOSAT team at JAXA (https://data.gosat.nies.go.jp).
NOAACT data were projected into grids of AIRS and GOSAT observations both for horizontal and vertical levels. Long-term linear growth rates were estimated for each data sets at each grid level by fitting linear trend line with respect to years (time axis) using least square procedure. The slope of the line is con-sidered as the linear growth rate (LGR) of CO2. The difference between the instantaneous value and fitted trend is known as de-trended data. These data were used to prepare seasonal clima-tology for the study of spatio-temporal variability of CO2 over different parts of the globe. The annual growth rates (AGR) of CO2 were calculated by subtracting the value for the January of a given year from the January value of the next year.
3. RESULTS
3.1. Seasonal variability of mid-troposphere CO2
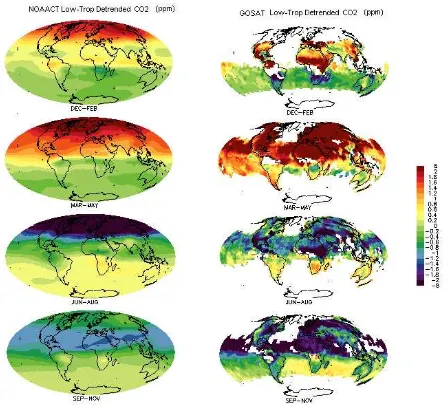
Mean of the mid-troposphere CO2 over the tropical regions based on NOAACT and AIRS (Figure 1) suggest good coherences between both the data sets. The data exhibits distinct seasonal cycle with continuous increasing values over the year with a linear growth rate of 2.01 ppm yr-1. The seasonal climatology of detrended mid-troposphere CO2 over the globe as presented in Figure 2 suggests that there exist broad agreements between both the data sets: CO2 increases during Dec-May and decreases during June-November; this temporal variability is associated with strong latitudinal gradient; The International Archives of the Photogrammetry, Remote Sensing and Spatial Information Sciences, Volume XL-8, 2014
ISPRS Technical Commission VIII Symposium, 09 – 12 December 2014, Hyderabad, India
This contribution has been peer-reviewed.
seasonal oscillations are very strong in the northern hemisphere and relatively weaker in the southern hemisphere. The agreement is excellent over the most parts of the globe between the latitudinal belt 600S – 600N.
Figure 1 Mean CO2 at 443 hPa over the northern tropics based on
NOAACT and AIRS.
During the northern winter (Dec-Feb), most of the northern tropics have moderate and positive detrended values, ranges 0.2 ppm over the equatorial region and 1.2 ppm over the 600N. On the other hand, NOAACT has large positive value in contrast to negative detrened values for the AIRS observation. In this period, southern hemisphere has negative detrended CO2 (up to -1.2 ppm) over the tropical region for both the data sets. In the polar region, AIRS has positive values against the small negative detrended values of NOAACT estimates. During the spring season (Mar-May), the positive detrended CO2 values in the northern hemisphere enhanced significantly (up to 5ppm) while the negative values in the southern hemisphere enhanced moderately (up to -1.5 ppm). In summer (June- Aug), most of the places in the northern hemisphere have large negative detrended values of CO2. It remains -05 ppm near the equator and -5 ppm near the pole. In this period, southern tropics exhibits moderate positive values of de-trended CO2. In the autumn (Sep-Nov), earlier large negative detrended values in the northern hemisphere reduced significantly into small negative or positive detrended values. In the southern hemisphere, positive detrended values also undergone small reduction.
3.2 Seasonal variability of surface layer CO2
The GOSAT CO2 retrievals correspond to the surface layer (0 - 2 km) atmosphere and these data are available at monthly scale during 2009 and 2010 for the public use. We re-sampled the NOAACT data for the surface layer and compared with GOSAT observations. It is observed that the NOAACT CO2 always larger than GOSAT observations with bias of 10 ppm. However, their detrended values show good agreements
between them (Figure 3). They possess consistent annual cycle. Over the northern hemisphere CO2 increases during Jan – May and decreases during June-Dec. Over the southern hemisphere, the seasonal cycle is opposite to that of the northern hemisphere.
Figure 2 Climatology of mid-troposphere de-trended CO2 based on
NOAACT and AIRS.
Figure 3 Surface layer CO2 mean over the tropics based on NOAACT and GOSAT.
3.3 Linear growth rate of atmospheric CO
2The annual growth rates of mid-tropospheric CO2 for different years for NOAACT and AIRS observations are presented in Figure 4. Both the data exhibit consistent inter-annual variability with the largest growth rate during 2003 and smallest The International Archives of the Photogrammetry, Remote Sensing and Spatial Information Sciences, Volume XL-8, 2014
ISPRS Technical Commission VIII Symposium, 09 – 12 December 2014, Hyderabad, India
This contribution has been peer-reviewed.
in 2004. They also show biennial oscillations, which is probably the response of tropospheric biennial oscillations (TBO) (Chang and Li, 2000).
Figure 4 Annual growth rates of mid troposphere CO2 based on
NOAA CT and AIRS observations.
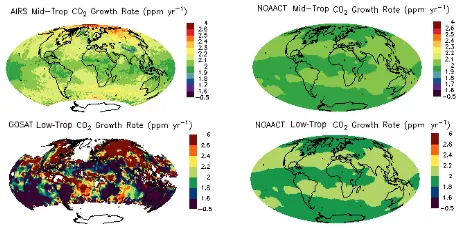
On the other hand, the spatial patterns of LGR of NOAACT mid-troposphere (lower troposphere) CO2 (Figure 5) are significantly inconsistent with the satellite observations. AIRS shows larger LGR of CO2 over the extra tropics and polar regions (2.2 ppm yr-1) and relatively small LGR of CO2 over the equatorial regions (< 2 ppm yr-1) while NOAACT CO2 LGR remain uniform at 2 ppm yr-1 over the globe. The similar uniform LGR of surface layer CO2 were observed for the NOAACTwhile GOSAT shows large spatial variation.
Figure 5 Long-term growth rate of atmospheric CO2 at mid and lower troposphere based on NOAACT and satellite observations.
4 CONCLUDING REMARKS
In this study we examined the consistency between the NOAACT and satellite observations. It was observed that NOAACT compares well with the AIRS mid-tropospheric observations at all the time scales; however it could not resolve spatial patterns of LGR as observed in AIRS CO2. Regarding the lower tropospheric CO2, NOAACT is somehow consistent with the seasonal variability of GOSAT observations. More GOSAT data is required for making useful comments on the lower tropospheric CO2.
5. ACKNOWLEDGEMENT
This research work is carried out as part of National Carbon Project, ISRO-Geosphere Biosphere Programme. We are very thankful to AIRS team at NASA, and GOSAT team at JAXA for providing the data for this study.
6. REFERENCES
1) America's Climate Choices. Washington, D.C.: The National Academies Press. 2011. p. 15. ISBN 978-0-309-14585-5.
Andres, R. J., Boden, T. A., Bréon, F.-M., Ciais, P., Davis, S., Erickson, D., Gregg, J. S., Jacobson, A., Marland, G., Miller, J., Oda, T., Olivier, J. G. J., Raupach, M. R., Rayner, P., and Treanton, K.: A synthesis of carbon dioxide emissions from fossil-fuel combustion, Biogeo-sciences, 9, 1845–1871, doi:10.5194/bg-9-1845-2012, 2012.
2) Chang, C.-P. and T. Li, 2000: A Theory for the tropical tropospheric biennial oscillation. J. Atmos. Sci., 57, 2209-2224.
Maddy, E. S., C. D. Barnet, M. Goldberg, C. Sweeney, and X. Liu (2008), CO2 retrievals from the Atmospheric Infrared Sounder: Methodology and validation, J. Geophys. Res., 113, D11301, doi:10.1029/2007JD009402.
Kuze, A., Suto, H., Nakajima, M., and Hamazaki, T. (2009)Thermal and near infrared sensor for carbon observation Fourier-transform spectrometer on the Greenhouse Gases Observing Satellite for greenhouse gases monitoring, Appl. Optics, 48, P.6716–6733
IIPCC AR4 SYR 2007(2007) IPCC Fourth Assessment Report: Climate Change ,P.37
Peters, G. P., Marland, G., Le Quéré, C., Boden, T. A., Canadell, J. G., and Raupach, M. R.: Correspondence: Rapid growth in CO2 emissions after the 2008–2009 global financial crisis, Nature Climate Change, 2, 2–4, 2012. Pieter Tans (2009) "Trends in Carbon Dioxide". NOAA/ESRL. Received 2009-12-11.
Saitoh Naoko, Ryoichi Imasu, Yoshifumi Ota, and Yosuke Niwa(2009) CO2 retrieval algorithm for the thermal infrared spectra of the Greenhouse Gases Observing Satellite: Potential of retrieving CO2 vertical profile from high-resolution FTS sensor, JOURNAL OF GEOPHYSICAL RESEARCH, VOL. 114, D17305, doi:10.1029/2008JD011500
The International Archives of the Photogrammetry, Remote Sensing and Spatial Information Sciences, Volume XL-8, 2014 ISPRS Technical Commission VIII Symposium, 09 – 12 December 2014, Hyderabad, India
This contribution has been peer-reviewed.