Micro Mineral Content in Fibers of Forages on South Sumatera
Armina fariani
Faculty of agriculture, sriwijaya University-palembang, indonesia Email:[email protected]
ABSTRACT
This study was carried out to evaluate concentration of micro minerals (Zn,Fe,Mn,Cu and Se) of forages and their distribution on fiber fraction Neutral Detergent Fiber (NDF) and Acid Detergent Fiber (ADF) in south sumatera during dry and rainy season. Seven species of commonly forages namely Axonopus Compressus, Panicum Maximum, Pennisetum Purpuphoides, Leucaena Leucocephala, Centrocema Pubescens, Calopogonium Mucunoides and Accia Mangium were collected at native pasture during rainy and dry seasons. The results showed that micro mineral concentration of forages and their distribution in fiber fraction varied among species ans season. In general, concentration of micro mineral was slightly higher in rainy season compared to dry season either in grass or legumes forages. In grass concentration of Fe and Mn were above the critical level, while 33,3%, 1005 and 16,7% of evaluateed grass were deficient in Fe. Distribution of micro minerals in NDF and ADF were also significantly affected by species and season and depends on the kinds of element measured. Generally, micro minerals were associated in fiber fraction much higher during dry season compared to rainy season. Iron (Fe) and Selenium (Se) in forages were highest elements associated in NDF and ADF, while the lowest was found in copper(Cu).
Key Word :Seasons, Forages, Micro meneral Fiber.
Introduction:
Most of grazing livestock in tropical countries including Indonesia fulfill
their mineral requirements usually only from the forages concsumed. Since the
forages are frequently deficient or excess in various minerals, the animals may
have sub clinical deficiencies or chronic toxicities. Aside from the above
mentioned problem, the use of minerals by animals is constrained by their
bioavailability. Some minerals in the forages as assosiated with other compounds
or trapped in the undigested nutrient fractions resulting in slowly release or
making these unavailable for use. Therefore, in assessing mineral requirement of
the animals, mineral content in forages and as well as its bioavailability need to be
bioavailability is much more difficult to be estimated. The bioavalibility of the
mineral can be affected by their location in forages structure. Emanuele and
Satples (1990) reported that minerals associated with the plant cell wall have
lower bioavaibility or require a longer fermentation time to maximal release.
There was no information available concerning mineral distribution and their
bioavailability of forages in South Sumatera in relationto different seasons. The
objectives of this study was to evaluate the micro mineral concentration of the
forages and their distribution in NDF ) Neutral Detergent Fiber) and ADF ( Acid
Detergent Fiber) during rainy and dry seasons.
Research Methodology
Study area and collection of forages samples
The study was conducted in Palembang, South Sumatera
province-Indonesia. Seven species of commonly forages namely Axonopus compressus,
Panicum maximum, Pennisetum purpuphoides, Leucaena leuococephala,
Centrocema pubescens, Calopogonium mucunoides and Acacia mangium were
collected at native pasture using a quadrant of 50 x 50 cm of size during rainy and
dry seasons. The forages samples were put in plastic bags and the oven dried at
60°C for 48 hrs, coarsely milled to pass a 1 mm screen and packed in the special
laboratory polyethlene bags for future analyses.
Determination of micro mineral distribution
Micro minerals (Zn, Fe, Mn and Cu) concentration in the forages samples
and fiber fractions were analyzad using inductively coupled plasma emssion
spectrometer (SPSS7700, Seiko Instruments Inc., Chiba, Japan) after digesting
with nitric acid. Selenium (Se) was analyzed through the fluorometric detection of
the 2, 3 Diamino-naphthalene (DAN) according to the procedure of Watkinson
(1966). The spectrofluoro photometer used was RF-1500 (Shimadzu Co).
Data on micro mineral concentration of forages and their distribution in
fiber fractin (NDF and ADF) were analyzed using General Linear Model
procedure using StatView (SAS, 1999).
Results and discusion
Micro mineral concentration of forages
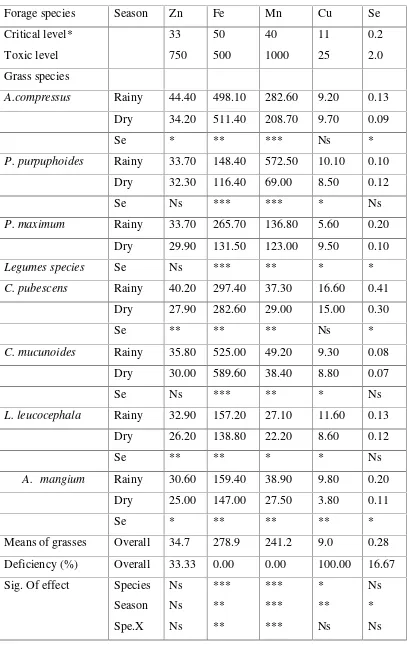
There was significant difference (P<0.05) in micro mineral concentration
of grass and legume forages within species and seasons (Table 1). In rainy season,
Zn concentration of grass varied from 33.7 (P. Maximum) to 44.4 mg kg-1 (A. Compressus); Fe from 148 (P.purouphoides)to 498.1 mg kg-1 (A. Compressus);
Mn from 136.8 (P. Maximum)to 10.1 mg kg-1 DM (P.purpuhoides) and Se concentration from 0.10 (P. Purpuhoides) to 0.20 mg kg-1 (P. Maximum), respectively. The concentration of these elements slightly decreased in dry
seasons, in which Zn concentration varied from 29.9 (P.maximum) to 34.2 mg kg
-1 (A. Compressus); Fe from 131.5 (P.purpuhoides) to 511.4 mg kg-1 (A.
Compressus); Mn from 69.0 (P.purpuhoides) to 208.7 mg kg-1 (A.compressus);
Cu from 8.5 (P. Purpuhoides to 9.7 mg kg-1 DM (A. Compressus) and Se
concentration from 0.09 ( A. Compressus) to 0.12 mg kg-1 (P. Purpuphoides),
respectively. Similar with grass, data on legume showed that concentration of
micro mineral in rainy season was relatively higher than in dry season. The
highest concentration of Zn, Cu, and Se were found in C. Pubescens during rainy
season ( 40.2, 16,6 and 0,405 mg kg-1), while the highest concentration of Fe, and
Mn were found on C. Mucunoides (589.6 mg Fe kg-1 in dry season and 49.2 mg Mn kg-1 in rainy season). The lowest concentration of Zn and Cu were observed in A. Mangium during dry season (25.0 and 3.8 mg kg-1 ), Fe and Mn in L.
Leucocephala (138.8 and 22.2 mg/kg-1 ) and the lowest Se concentration was
noted in C. Mucunoides (0.071 mg kg-1) during dry season. The result also show that 75 % of the observed legumes were deficient in Zn and Mn , and 62,5 %
deficient in Cu and 50 % deficient in Se. Concentration of the micro elements
both in grass and legumes in the preset study were within the ranfes for the
tropical forages as reported by several researchers (Evitayani et al., 2004,
Table 1. Micro mineral concentartion of grass and legume (mg kg-1 DM)
Forage species Season Zn Fe Mn Cu Se
Critical level*
A.compressus Rainy 44.40 498.10 282.60 9.20 0.13
Dry 34.20 511.40 208.70 9.70 0.09
Se * ** *** Ns *
P. purpuphoides Rainy 33.70 148.40 572.50 10.10 0.10
Dry 32.30 116.40 69.00 8.50 0.12
Se Ns *** *** * Ns
P. maximum Rainy 33.70 265.70 136.80 5.60 0.20
Dry 29.90 131.50 123.00 9.50 0.10
Legumes species Se Ns *** ** * *
C. pubescens Rainy 40.20 297.40 37.30 16.60 0.41
Dry 27.90 282.60 29.00 15.00 0.30
Se ** ** ** Ns *
C. mucunoides Rainy 35.80 525.00 49.20 9.30 0.08
Dry 30.00 589.60 38.40 8.80 0.07
Se Ns *** ** * Ns
L. leucocephala Rainy 32.90 157.20 27.10 11.60 0.13
Dry 26.20 138.80 22.20 8.60 0.12
Se ** ** * * Ns
A. mangium Rainy 30.60 159.40 38.90 9.80 0.20
Dry 25.00 147.00 27.50 3.80 0.11
Se * ** ** ** *
Means of grasses Overall 34.7 278.9 241.2 9.0 0.28
Deficiency (%) Overall 33.33 0.00 0.00 100.00 16.67
Sea
Mean of legumes Oveall 31.1 287.1 33.7 10.4 0.48
Deficiency (%) Overall 75.00 0.00 75.00 62.50 50.00
Sig. of effect
Se: Season effect in rainy and dr seasons.
***: P<0.01;*: P< 0.05 and Ns: not significant.
The mean of Zn concentration of grass (34.7 mg kg-1 DM) and legume
forages (31,1 mg kg-1 DM) were almost similar with study of Minson (1990)
which obtained value of 36 mg Zn kg-1 DM in pasture. The mean Fe and Cu
concentration were significally higher (P<0.01) in legumes (287.1;10.4 mg kg-1
DM) than grass (278.9; 9.0 mg kg-1 DM). This finding was in agreement with the
study of Minson (1990) and Miller (1984) who reported that concentration of
some micro minerals are normally higher in legume than in grass. In across, Mn
concentration had significantly higher (P<0.001)in grass (241.2 mg kg-1 DM)
compared to legumes (33.7 mg kg-1 DM). These findings were in agreement with
prevoius study reported by Fleming (1973), Underwood (1981) and Minson
(1990) that micro minerals concentrations in legumes were lower than in grass.
The mean of Cu concentration was slightly hogher than the requirement for sheep
(7,0 mh kg-1 DM) ( NRC, 1984). Decreasing Cu concentration of grass and
legume forages mau occur with advancing maturity, climatic and seasonal
changes ( Spears, 1994). The mean Se concentration was slightly higher in legume
than grass ( 0.48 vs 0.28 mg kg-1 DM). Between the seasons, Se concentration of
grass and legume forages slightly higher in rainy season than requires in the feed
for ruminants (0.2mg/kg-1 DM) as recommended by NRC (1984).
According to Underwood and Suttle (1999), increasing soil water can have
a negative influence on soil trace mineral especially Se. In contrast, the tendency
probably a reflection of influence of rainfall. Several studies (Evitayani et al.,
2004, Fujihara et al., 1991, Master et al., 1992, and Prabowo et al., 1991) have
reported that seasonal fluctuations in micro mineral composition persisted in
grazing pasture. Results oh the present study also showed that Fe ( rainy and dr
seasons) of forages were not deficient. However, Zn was deficient in A. Mangium
; Mn was deficient in C. Pubescens, L. Leucocephala and A. Compressus, P.
Purpuphoides, P. Maximum, C. Mucunoides and A. Mangium and Se was
deficient in A. Compressus, respectively. While in fry season, Zn was deficient in
seven species except for A. Compressus; Mn was deficient in C. Pubescens and
Se was deficient in C. Mucunoides, repectively. However, defiency of Zn in grass
and legume were 33.3% and 100 % defiency of Cu was 100% in grass and 62.5 %
in legum; defiency of Se was 50 % in legume. McDowell (1976,1985) reported
that of Zn, Cu, Mn and Se were the mostsevere mineral limitation to grazing
livestock in tropical countries especially in indonesia; while individual evaluation
of samples based on Fe requirements of 50 mg/kg-1 DM indicated that none of
grass and legume forages were deficient Fe. The zero incidence of Fe defiency in
grass and legume forages in both rainy and dry seasons was also obatained by
Prabowo et al. (1991).
Mineral proportion of forages in Neutral Detergent Fiber (NDF)
The micro mineral proportion of grass and legume forages in NDF is
Shown in Table 2. Both seasons and species significantly (P<0.05) affected Zn,
Fe, Mn, Cu and Se. In rainy season, the highest proportion of Zn in NDF of grass
was 26.1 % (A. Compressus)and 51.3 % (P. Maximum), Fe varied from 29,8 (P.
Purpuphoides) to 60.1 %(A. Compressus); Mn from 1.3(A. Compressus)to 2.8 %
(P. Purpuphoides); Cu from 12.9 (A. Compressus) to 25.2 % ( P. Maximum),
respectively. In dry season, proportion of Zn in NDF was relatively higher than in
rainy season. Proportion of Zn associated in NDF ranged from 37.1 ( P.
Purpuphoides) to 79.1 % ( A. Compressus), Mn from 1.9 (A. Compressus)to 3.3
%(P. Maximum), Cu
Forage species Season Zn Fe Mn Cu Se
Grass species
A.compressus Rainy 26.10 60.10 1.30 20.50 10.80
Dry 37.80 79.10 1.90 26.30 12.90
Se *** ** Ns * *
P. purpuphoides Rainy 39.20 29.80 2.80 7.00 14.00
Dry 37.10 33.20 3.60 6.20 20.10
Se * ** * Ns *
P. maximum Rainy 51.30 43.10 3.30 18.40 25.20
Dry 54.20 64.50 1.80 22.80 21.20
Legumes
species
Se * *** * * *
C.pubescens Rainy 5.70 60.10 3.20 10.30 15.30
Dry 7.00 75.20 6.70 9.10 13.40
Se * ** * Ns *
C.mucunoides Rainy 42.00 32.00 9.40 11.50 9.20
Dry 45.20 25.20 11.20 12.80 11.00
Se Ns ** ** Ns *
L. leucocephala Rainy 20.30 75.30 30.90 11.50 78.10
Dry 18.50 81.20 36.10 12.80 84.80
Se Ns ** Ns ** **
A.mangium Rainy 36.10 61.30 11.90 66.00 33.60
Dry 42.00 60.10 10.19 67.20 35.20
Se ** Ns Ns Ns Ns
Mean of grasses Overall 41.0 51.8 2.5 16.9 17.4
Sig. Of effect Species
Sig. of effect
Se: Season effect in rainy and dry seasons.
***: P<0.001; **:P<0.01; * : P<0.05 and Ns : not significant.
Tabel 3. Micro mineral Proportion in ADF of grass and legume (%) Forage species
Grass species
Season Zn Fe Mn Cu Se
A. compresus Rainy 3.09 28.00 16.98 3.09 15.30
Dry 5.54 34.50 19.75 2.04 26.87
Se * ** * * ***
P. purpuphoides Rainy 3.95 32.76 6.79 0.97 30.56
Dry 5.07 29.70 10.45 1.67 25.87
Se * Ns * Ns *
P. Maximum Rainy 1.03 41.40 1.05 2.25 55.87
Dry 1.49 56.34 2.57 30.7 57.42
Legum species Se * ** Ns Ns *
C.pubescens Rainy 1.65 37.37 4.08 1.41 30.45
Dry 1.24 48.20 7.34 2.05 29.86
Se * ** ** Ns Ns
C.mucunoides Rainy 4.12 16.90 29.34 3.02 8.40
Dry 6.55 40.60 30.77 4.11 10.67
Se * *** ** Ns **
L. leucephala Rainy 2.28 55.90 8.40 2.75 34.80
Dry 7.35 35.90 5.17 5.05 59.87
Se * *** * * ***
A. mangium Rainy 2.81 2.05 25.98
Dry 5.23 1.15 30.65
Se * ** * Ns *
Mean of grass Overall 3.4 37.1 9.6 2.2 35.3
Sig. effect species *** * *** * ***
Species X season ** Ns Ns Ns **
Mean of legums Overall 3.9 38.6 13.4 2.7 34.4
species ** *** *** ** ***
Season *** Ns * Ns ***
Species X season ** ** Ns Ns ***
Grass X legume Ns Ns ** Ns *
Se: season effect in rainy and dry season.
***: P<0.001 ; **P<0.001; *P>0.05 and Ns : not significant.
from 6.2 (P. Purphoides) 26.3% (A. Compressus) and Se varied from 10.8 (A.
Compressus) to 20.1% (P. purphoides), repectively. Data on legume forages
showed that the lowest proportion of Zn, Fe, Mn, Cu and Se in C. purbescens,
10,3% in C.purbescensand 9.2% in C. mucunoides while the highest proportion
were 42.0% (C. mucunoides), 81.8 (L. leuchephala), 66.0% (A. mangium) and
78.1% (L.leucocephala) respectively.
Similar trend with gress, the proportion of Zn, Fe, Mn, Cu, and Se in
legume tended to increase during dry seaseon, ranged from 7.0 (C. pubescens) to
45.0 (C. mucunoides) for Zn, 25.0 (C. mucunoides) to 75.3% (L. leucocephala)
for Fe 6,7 (C. pubescens) to 36.1% ( L. leucocephala) for Mn 9.0 (C.pubescens)
to 45.0 (C.pubescens) to 67.2% (A.mangium) and from 11.0% (C.mucunoides)to
35.2% (A. mangium) respectively. The great variation of micro mineral
proportion in NDF could be reflecting the mineral affinity to yhe cell wall that
affected their biovailibility and cause deficiency symptoms to grazing animals.
The proportion of Zn and Fe proportion in NDF of this study almost similar with
data obtained by Kincaid and Cronrath (1983) and Ibrahim et al. (1990) who
reported 31%, 77% and 45% of total Zn and Fe were located in NDF fraction of
Lucerne hay. The mean Zn and Fe proportion of Zn and Fe in NDF of grass was
41.0 and 27.1% while in legume the proportion of Zn and Fe was 51.6 and 58.8%
repectively. In contras, serraet al.(1996) reported that mean proportion of Zn and
Fe in NDF of forages were 2.9% and 81.3% repectively. Between micro mineral
elements, Mn was lowest propotion in NDF reflecting the low affinity to the cell
wall (Serra et al., 1996). The relatively higher proportion of micro mineral in NDF
during dry season could be due to fluctuation of rainfall and affinity differences of
defiency symptom to the grazing animals (Ibrahim et a;., 1990, Kincaid and
Cronrath, 1983, and Serra et al., 1996).
Mineral Proportion Of Grass And Legume In Acid Detergent Fiber (ADF):
The micro mineral proportion of forages in ADF was significantly
(P<0.05) different in both seasons and species (Table 3). The proportion of micro
mineral in ADF of grass during rainy season ranged from 1.0 % (P. Maximum)to
4.0 % ( P. Purpuphoides) for Zn, 28.0 % (A. Compressus) to 41.4 % (P.
Maximum)for Fe, 1.1 % (P.maximum) to 17.0 %(A. Compressus)for Mn 1.0 % (
P. Purpuphoides) to 3.1 %( A. Compressus)for Cu and 15.3%(A. Compressus)to
55.9% (P. Maximum)for Se, respectively. While in dry season the micro mineral
proportion associated with ADF was higher than in rainy season, varied from 1.5
% (P. Maximum) for Fe, 2.6 % (P.maximum) to19.8% (A. Compressus)for Mn,
1.7 % (P. Purpuphoides) to 3.1 % (P.maximum) for Cu and 25.9%
(P.purpuphoides) 57.4 % (P. Maximum) for Se, respectively. In legumes, the
proportion of micro mineral in ADF during rainy season varied from 1.7 %
(C.pubescens) to 4.2 % (C. Mucunoides) for Zn, 16.9 % (C.mucunoides) to 55.9
% (L.leucocephala) for Fe, 4.1% (C. Pubescens) to 29.3% ((C. Mucunoides) for
Mn, 1,4 % (C.pubescens) to 3.0% (C.mucunoides) for Cu and 8.4 % (C.
Mucunoides) to 34.8 % (L. Leucocephala) for Se, repectively. While in dry
season, the lowest proportion of Zn, Fe, Mn, Cu, adn Se elemetnts were 1.2 % (C.
Pubescens), 35.9 % (L.leucocephala), 1.2 % (A.mangium) and 10.7 % (C.
Mucunoides) and the highest of Zn, Fe,Mn, Cu and Se elements were found in L.
Leucocephala (7.4%), C. Mucunoides (30.8%), L. Leucocephala (5.1%) and L.
Leucocephala (59.99 %), repectively.
The wide variation of micro mineral proportion in ADF residue in the
present study shows that the rate of affinity of these elements with lingo cellulosic
materials differed each other( Edwards et al., 1977, Ibrahim et al., 1990, Kincaid
and Cronrath, 1983, McDowell, 1985, and Emanuele and Staples, 1990). The
average of Zn proportion in ADF of grass (3.4%) legume (3.9%) un the present
of Zn remained in ADF fraction of gliricidia. The highest propotion elements in
ADF were found in Fe and Se (37.1 and 38.6% for grass) and 35.3 and 34.4 % for
legume.similar results was reported by Ibrahim et al., (1990) and Serra et al.,
(1996). In general, grass contained higher proportion of micro mineral in NDF
than legume reflecting a higher trapped of the elements into lignocellulose.
Conclusion
From the bove results, it could be concluded that nutritive value of forages
in South Sumatera assessed by distribution of micro mineral either in intact
forages or in fiber fractions (NDF and ADF) greatly varied between species and
seasons. In rainy season, the concentration of Fe and Se was above the
requirement of the ruminants, while in dry season some of the forages were
deficient for these elements. A high content of cell wall constituent ( NDF and
ADF) has been associated with the attachment of more minerals into the cell
wall. However, most of the micro mineral elements were found in the cell
contents and should be available to the ruminants.
References
Edwards, J. H., W. A. Jackson, E. R. Beaty and R. A. McCreey, 1977. Element
concentration of forage and non-soluble cell wall fraction of Coastal
Bermuda grass. Agron. J. 69:617-619.
Emanuele, S. M. And C. R. Staples. 1990 Ruminal release of mineral from six
forage species. J. Anim. Sci. 68:2052-2060.
Evitayani, L. Warly, A. Fariani, M. Hasyashida and T. Fujihara. 2006. Micro
mineral solunility of forages in South Sumatra, Indonesia. J.Food,
Agric.&Environ, 4 (2): 213-215.
Evitayani, L. Warly, A. Fariani, T. Ichinohe, S.A. Abdulrazak and T.
Fujihara.2004. comparative rumen degrabillity of some legumes forages
between wet and dry seasons in West Sumatra, Indonesi. Asian-Aust. J.
Fleming, G.A. 1973. Mineral composition of herbage. In: G. W. Butler and R.W.
Bailey (Ed) Chemistry And Biochemistry of Herbage pp. 529-566.
Academic Press, London, UK, 1973.
Fujihara, T., Matsui, T., Hayashi, S., Robles, A.Y., Serra, A.B., Cruz, L.C., and H.
Shimizu. 1992. Mineral status of grazing phlipine goats. I. The nutrition of
selenium, copper and zinc of goats in Luzon Islands. Asian-Aust. J. Anim.
Sci 5:389-395.
Ibrahim, M. N. M., A. Van Der Kamp, G. Zemmelink and T. Tamminga, 1990. In
ruminant feeds. J. Agric. Sci. (Camb.) 114: 265-274.
Kincaid, R. L. And J. D. Cronrath. 1983. Amount and ditribution of mineral in
Washington forages. J. Dairy Sci. 66: 821-824.
Master D. G., D. B. Purser, S. X. Yu, Z. S. Wang R. Z. Yang, N. Liu, D. X .Lu, L.
H. Wu and G. H. Li. 1992. Mineral nutrition on grazing in Northern China
II Micro-minerals in pasture, feed supplements and sheep. Asian-Aust. J.
Anim. Sci. 6:99-105.
McDowell, L.R. 1976. Importance of ruminants of the world for non-food uses.
Cornell University, New York.
McDowell, L.R. 1985. Nutrition of grazing Ruminants in Warm Climates.
Academic Press, Orlando.
McManus, W. R., V. N. E. Robinson and L. Dsitribution of mineral material on
forage plant cell wall. Aust. J. Agric. Res. 28:651-662.
Miller, C. F. 1984. Biochemical and physiological indicator s of mineral status in
animals: copper, cobalt and zinc. J. Anim . Sci. 65:1702-1711.
Minson, D. J. 1990. The chemical composition and nutritive value of tropical
grasses. In: Skerman, P.J., Cameroon, D. G. And F. Riveros (Ed.). Tropical
grasses. pp. 172-180. Food and Agriculture Organization of the United
NRC. 1984. Nutrients requirements of beef cattle. Sixth revised edition. 2.
Nutrients requirements: excesses and defiencies. National Academy press,
Washinngton, D. C.
Prabowo A., L. R. McDowell, N. S. Wikilson, C. J. Wicox and J. H. Conrad.
1991. Mineral status of grazing cattle in south Sulawesi, Indonesia 2: Micro
minerals. Asian-Aust. J.J Sci. 2: 121-130.
Serra, A. B., S. D. Serra, E. A. Orden, L. C. Cruz< K Nakamura and T. Fujihara.
1994. Multipurpose tree leaves and fruit in diets of small ruminants during
dry season. Proc. Int. Worshop on Sustainable Small-Scale Ruminant
Production in semi-Arid and SubHumid Areas, September 24. Hohenheim
University, Stuttgart, Germany.
Serra, A. B., S.D. Serra, Ti. Ichinohe, T. Harumoto and T. Fujihara. !996. Amount
and distribution of dietary mineral in selected Philipine forages. Asian-Aust J.
Anim. Aci. 9:139-147.
Spears, J. W. 1994. Minerals in Firages . in: G. C. Fahey, M. Collins, D. R.
Quality, and L.E. Moser (Ed). Forage Quality, Evaluation and Utilization. Pp
218-317. American society of agronomy, Inc., Soil science of America, Inc.,
Madison, WI.
Statistical analysis system, SAS/STAT User’s guide, 1999. Stastistical analysis
Institute, Inc. Carry, NC.USA.
Underwood, E.J. and N.F. Suttle. 1999. The mineral nutrition of livestock. 3
edition. 2. Natural sources of minerals. CABI publishing, Oxon, UK.
Underwood, E.J. and N.F. Suttle. 1999. The mineral nutrition of livestock. 3
edition. 15. Selenium. CABI publishing, Oxon, UK.
Underwood, E.J., 1981. The mineral nutrition of livestock. Commonwealth
Agricultualbureau, Slough, England.
Watkinson, J.H. 1966. Fluorometric of selenium in biological material with 2,3