DAFTAR RIWAYAT HIDUP
Nama
: Khoirun Nisak
Tempat, Tanggal Lahir
: Pangkalpinang, 18 November 1995
Jenis Kelamin
: Perempuan
Agama
: Islam
Pendidikan Terakhir
: S1 (Sarjana Ekonomi)
Alamat
: Jl. Depati Amir No 36 Pangkalpinang
No. Telp / HP
: 0813 6840 3034
: [email protected]
Pendidikan Formal
1. 2013-2017
: Universitas Bangka Belitung
(Fakultas Ekonomi, Program Studi Manajemen),
Balunijuk
2. 2010-2013
: SMK PGRI Semabung Pangkalpinang
3. 2007-2010
: MTs.N Pangkalpinang
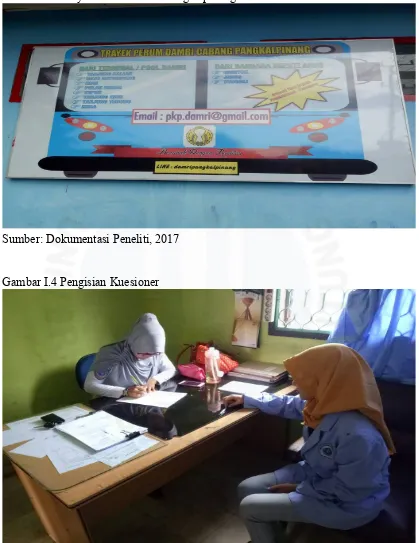
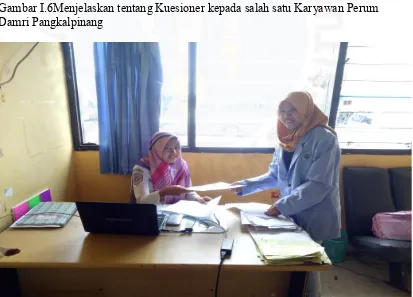
LAMPIRAN 1 KUESIONER PENELITIAN
KUESIONER PENELITIAN
Kuesioner dibawah ini merupakan salah satu metode pengumpulan data
primer tentang
“Pengaruh Etika Kerja, Keselamatan Kerja dan Kesehatan Kerja
terhadap Kinerja Karyawan Perum Damri Pangkalpinang”.
Hasil dari data primer yang sekaligus sebagai jawaban dari Bapak/Sdr selaku
pekerja di Perum Damri Pangkalpinang, sangat mendukung dan berguna dalam
penyusunan proposal skripsi sebagai salah satu syarat untuk menyelesaikan studi saya
di Jurusan Manajemen Fakultas Ekonomi Universitas Bangka Belitung.
Mohon kesediaan Bapak/Sdr untuk mengisi daftar pernyataan dibawah ini
dengan memberikan tanda
check list
(√) pada kolom yang tersedia sesuai dengan
keadaan yang Bapak/Sdr rasakan yang sesungguhnya. Besar harapan saya kiranya
jawaban Bpk/Sdr berikan se objektif mungkin karena sangat membantu keakuratan
data dari penelitian ini.
I.
Identitas Responden
1. Nama
:……….………....*( boleh tidak di isi)
2. Jenis kelamin :………
3. Umur
:………
4. Pendidikan
:………
L
P
5. Bagian
:………
II.
Jawaban dari Pernyataan yang tersedia
Petunjuk :
Untuk pernyataan-pernyataan berikut ini, Bapak/Sdr dipersilahkan untuk
memberikan jawaban dengan mengisi tanda
check list (√)
pada skala 1-5 dalam
kolom jawaban yang sudah tersedia dengan pilihan sebagai berikut :
Keterangan :
Indikator
Sangat Setuju
(SS)
Setuju
(S)
Ragu-ragu
(R)
Tidak Setuju
(TS)
Sangat Tidak Setuju
(STS)
Skor 5
Skor 4
Skor 3
Skor 2
Skor 1
I.
Variabel Etika Kerja (X1)
NO
Pertanyaan / Pernyataan
Pilihan Jawaban
Gaya bicara
SS
S
R
TS
STS
1
Karyawan Perum Damri memiliki gaya bicara
yang baik
2
Saya sopan kepada sesama rekan kerja baik
kepada atasan maupun bawahan
Nilai kerja
Kerja keras
4
Kerja keras merupakan kunci sukses saya
sebagai seorang karyawan
5
Saya mempunyai semangat kerja yang tinggi
Kreativitas kerja
6
Saya selalu mengembangkan ide-ide baru
7
Saya dapat memanfaatkan waktu dengan baik
II.
Variabel Keselamatan Kerja (X2)
NO
Pertanyaan / Pernyataan
Pilihan Jawaban
Mesin dan Peralatan
SS
S
R
TS
STS
1
Kendaraan yang ada di Perum Damri sangat baik
2
Saya rasa pemeliharaan perawatan kendaraan
untuk mengurangi resiko kecelakaan kerja yang
dilakukan oleh perusahaan baik
III.
Kesehatan Kerja (X3)
NO
Pertanyaan / Pernyataan
Pilihan Jawaban
Keadaan dan kondisi karyawan
SS
S
R
TS
STS
1
Stress dalam pekerjaan yang saya lakukan tidak
membuat kesehatan saya memburuk
2
Sikap perusahaan kepadakaryawan yang sakit
sudah baik
3
Saya rasa pecahayaan, suhu udara, ditempat
kerja memenuhi standar kesehatan
5
Jaminan terhadap karyawan sudah baik
IV.
Kinerja Karyawan (Y)
NO
Pertanyaan / Pernyataan
Pilihan Jawaban
Kemampuan
SS
S
R
TS
STS
1
Pekerjaan yang sudah ditargetkan selalu
terpenuhi dengan baik
2
Seluruh
karyawan
telah
mendapatkan
pembagian peran yang sesuai dengan tingkat
kemampuan
Motivasi
3
Perusahaan telah memberikan penghargaan atas
pencapaian target kinerja kepada karyawan
4
Hubungan saya dengan rekan kerja yang lain
sangat baik
5
Perusahaan memberikan fasilitas yang memadai
untuk karyawan
Hasil kerja
6
Penurunan penumpangtidak membuat kinerja
perusahaan menurun
7
Kuantitas pekerjaan
sangat baik
untuk
meningkatkan kinerja karyawan
Organisasi
Lampiran 2 Hasil Jawaban Responden
Variabel Etika Kerja X1
35
4
4
4
5
5
3
5
31
Variabel Keselamatan Kerja (X2)
47
5
4
9
Variabel Kesehatan Kerja (x3)
59
4
4
4
4
5
21
60
4
4
4
4
4
20
Variabel Kinerja (Y)
33
4
5
5
5
4
4
4
3
3
37
Lampiran Uji Deskriptif Statistik
Variabel Etika Kerja (X1)
Statistics
x1.1 x1.2 x1.4 x1.6 x1.7 x1.8 x1.9 totalx1
N Valid 60 60 60 60 60 60 60 60
Missing 0 0 0 0 0 0 0 0
Std. Error of Mean .094 .085 .080 .095 .094 .090 .099 .417
Median 4.00 4.00 4.00 4.00 4.00 4.00 4.00 27.00
Mode 4 4 4 4 3 4 4 28
Std. Deviation .730 .660 .623 .736 .729 .701 .766 3.233
Variance .532 .436 .389 .542 .531 .491 .586 10.453
Skewness -.699 -.071 -.095 -.263 .342 .226 -.056 -.149
Std. Error of
Skewness .309 .309 .309 .309 .309 .309 .309 .309
Kurtosis .836 -.631 -.397 -.352 -.601 -.470 -.276 -.642
Std. Error of Kurtosis .608 .608 .608 .608 .608 .608 .608 .608
Range 3 2 2 3 3 3 3 14
Minimum 2 3 3 2 2 2 2 19
Maximum 5 5 5 5 5 5 5 33
Sum 246 244 248 240 220 221 215 1634
Percentiles 25 4.00 4.00 4.00 4.00 3.00 3.00 3.00 25.00
50 4.00 4.00 4.00 4.00 4.00 4.00 4.00 27.00
75 5.00 4.75 5.00 4.75 4.00 4.00 4.00 30.00
x1.1
Frequency Percent Valid Percent
Cumulative
x1.4
Frequency Percent Valid Percent
Cumulati
Total 60 100.0 100.0
x1.6
Frequency Percent Valid Percent
Cumulati
Total 60 100.0 100.0
x1.7
Frequency Percent Valid Percent
Cumulati
Total 60 100.0 100.0
x1.2
Frequency Percent Valid Percent
Cumulati
ve
Percent
Valid Rr 11 18.3 18.3 18.3
S 34 56.7 56.7 75.0
Ss 15 25.0 25.0 100.0
x1.8
Frequency Percent Valid Percent
Cumulative
Total 60 100.0 100.0
x1.9
Frequency Percent Valid Percent
Cumulative
Total 60 100.0 100.0
Variabel Keselamatan Kerja (X2)
Statistics
x2.3 x2.4 totalx2
N Valid 60 60 60
Missing 0 0 0
Std. Error of Mean .096 .087 .163
Median 4.00 4.00 8.00
Mode 4 4 8
Std. Deviation .746 .676 1.262
Variance .557 .457 1.592
Skewness -.588 -.320 -.588
Std. Error of Skewness .309 .309 .309
Kurtosis .430 .302 .619
Range 3 3 6
Minimum 2 2 4
Maximum 5 5 10
Sum 243 239 482
Percentiles 25 4.00 4.00 7.00
50 4.00 4.00 8.00
75 5.00 4.00 9.00
x2.3
Frequency Percent Valid Percent
Cumulative
Total 60 100.0 100.0
x2.4
Frequency Percent Valid Percent
Cumulative
Variabel Kesehatan Kerja (X3)
Statistics
x3.1 x3.2 x3.3 x3.4 x3.5 totalx3
N Valid 60 60 60 60 60 60
Missing 0 0 0 0 0 0
Mean 4.08 4.25 4.15 4.13 3.70 20.32
Std. Error of Mean .087 .081 .078 .090 .093 .276
Median 4.00 4.00 4.00 4.00 4.00 20.00
Mode 4 4 4 4 4 20
Std. Deviation .671 .628 .606 .700 .720 2.135
Variance .451 .394 .367 .490 .519 4.559
Skewness -.445 -.239 -.548 -.802 -.039 -.613
Std. Error of Skewness .309 .309 .309 .309 .309 .309
Kurtosis .580 -.570 1.888 1.466 -.230 .268
Std. Error of Kurtosis .608 .608 .608 .608 .608 .608
Range 3 2 3 3 3 10
Minimum 2 3 2 2 2 14
Maximum 5 5 5 5 5 24
Sum 245 255 249 248 222 1219
Percentiles 25 4.00 4.00 4.00 4.00 3.00 19.00
50 4.00 4.00 4.00 4.00 4.00 20.00
75 4.75 5.00 4.75 5.00 4.00 22.00
x3.1
Frequency Percent Valid Percent
Cumulative
x3.3
Frequency Percent Valid Percent
Cumulative
Total 60 100.0 100.0
x3.4
Frequency Percent Valid Percent
Cumulative
Total 60 100.0 100.0
x3.5
Frequency Percent Valid Percent
Cumulative
Total 60 100.0 100.0
x3.2
Frequency Percent Valid Percent
Cumulative
Percent
Valid Rr 6 10.0 10.0 10.0
S 33 55.0 55.0 65.0
Ss 21 35.0 35.0 100.0
y1.1
Frequenc
y Percent
Valid
Variabel Kinerja (Y)
Statistics
y1.1 y1.2 y1.3 y1.4 y1.5 y1.6 y1.7 y1.8 y1.9 Totally
N Valid
60 60 60 60 60 60 60 60 60 60
Missi
ng 0 0 0 0 0 0 0 0 0 0
Mean 4.17 4.08 4.08 4.15 4.00 4.05 3.68 3.72 3.53 35.47
Std. Error of
Mean .072 .090 .090 .078 .086 .099 .077 .083 .077 .422
Median 4.00 4.00 4.00 4.00 4.00 4.00 4.00 4.00 4.00 36.00
Mode 4 4 4 4 4 4 4 4 4 38
Std. Deviation .557 .696 .696 .606 .664 .769 .596 .640 .596 3.265
Variance .311 .484 .484 .367 .441 .591 .356 .410 .355 10.660
Skewness .056 -.425 -.737 -.075 -.360 -.550 .235 .329 .117 -.475
Std. Error of
Skewness .309 .309 .309 .309 .309 .309 .309 .309 .309 .309
Kurtosis .053 .242 1.361 -.286 .513 .139 -.582 -.641 -.413 .058
Std. Error of
Kurtosis .608 .608 .608 .608 .608 .608 .608 .608 .608 .608
Range 2 3 3 2 3 3 2 2 3 15
Minimum 3 2 2 3 2 2 3 3 2 27
Maximum 5 5 5 5 5 5 5 5 5 42
Sum 250 245 245 249 240 243 221 223 212 2128
Percentile
s
25 4.00 4.00 4.00 4.00 4.00 4.00 3.00 3.00 3.00 33.25
50 4.00 4.00 4.00 4.00 4.00 4.00 4.00 4.00 4.00 36.00
Total 60 100.0 100.0
y1.2
Frequency Percent Valid Percent
Cumulative
Total 60 100.0 100.0
y1.3
Frequency Percent Valid Percent
Cumulative
Total 60 100.0 100.0
y1.4
Frequency Percent Valid Percent
Cumulative
Percent
Valid Rr 7 11.7 11.7 11.7
S 37 61.7 61.7 73.3
Ss 16 26.7 26.7 100.0
Total 60 100.0 100.0
y1.5
Frequency Percent Valid Percent
Cumulative
Valid Ts 1 1.7 1.7 1.7
Rr 10 16.7 16.7 18.3
S 37 61.7 61.7 80.0
Ss 12 20.0 20.0 100.0
Total 60 100.0 100.0
y1.6
Frequency Percent Valid Percent
Cumulative
Total 60 100.0 100.0
y1.7
Frequency Percent Valid Percent
Cumulative
Percent
Valid Rr 23 38.3 38.3 38.3
S 33 55.0 55.0 93.3
Ss 4 6.7 6.7 100.0
Total 60 100.0 100.0
y1.8
Frequency Percent Valid Percent
Cumulative
Percent
Valid Rr 23 38.3 38.3 38.3
S 31 51.7 51.7 90.0
Ss 6 10.0 10.0 100.0
y1.9
Frequency Percent Valid Percent
Cumulative
Total 60 100.0 100.0
Uji Validitas
Variabel Etika Kerja (X1)
Correlations
x1.1 x1.2 x1.4 x1.6 x1.7 x1.8 x1.9 totalx1
x1.1 Pearson
Correlation 1 .303
* .306* .221 .383** .361** .137 .594**
Sig. (2-tailed) .019 .018 .090 .003 .005 .298 .000
N 60 60 60 60 60 60 60 60
x1.2 Pearson
Correlation .303
* 1 .431** .453** .153 .083 .425** .612**
Sig. (2-tailed) .019 .001 .000 .244 .528 .001 .000
N 60 60 60 60 60 60 60 60
x1.4 Pearson
Correlation .306
* .431** 1 .517** .249 .253 .189 .623**
Sig. (2-tailed) .018 .001 .000 .055 .051 .147 .000
N 60 60 60 60 60 60 60 60
x1.6 Pearson
Correlation .221 .453
** .517** 1 .379** .296* .421** .719**
Sig. (2-tailed) .090 .000 .000 .003 .022 .001 .000
N 60 60 60 60 60 60 60 60
x1.7 Pearson
Correlation .383
Sig. (2-tailed) .003 .244 .055 .003 .000 .000 .000
N 60 60 60 60 60 60 60 60
x1.8 Pearson
Correlation .361
** .083 .253 .296* .553** 1 .287* .624**
Sig. (2-tailed) .005 .528 .051 .022 .000 .026 .000
N 60 60 60 60 60 60 60 60
x1.9 Pearson
Correlation .137 .425
** .189 .421** .537** .287* 1 .670**
Sig. (2-tailed) .298 .001 .147 .001 .000 .026 .000
N 60 60 60 60 60 60 60 60
totalx1 Pearson
Correlation .594
** .612** .623** .719** .724** .624** .670** 1
Sig. (2-tailed) .000 .000 .000 .000 .000 .000 .000
N 60 60 60 60 60 60 60 60
*. Correlation is significant at the 0.05 level (2-tailed).
**. Correlation is significant at the 0.01 level (2-tailed).
Variabel Keselamatan Kerja (X2)
Correlations
x2.3 x2.4 totalx2
x2.3 Pearson Correlation 1 .573** .898**
Sig. (2-tailed) .000 .000
N 60 60 60
x2.4 Pearson Correlation .573** 1 .875**
Sig. (2-tailed) .000 .000
N 60 60 60
totalx2 Pearson Correlation .898** .875** 1
Sig. (2-tailed) .000 .000
N 60 60 60
Variabel Kesehatan Kerja (X3)
Correlations
x3.1 x3.2 x3.3 x3.4 x3.5 totalx3
x3.1 Pearson Correlation 1 .513** .427** .409** -.018 .714**
Sig. (2-tailed) .000 .001 .001 .894 .000
N 60 60 60 60 60 60
x3.2 Pearson Correlation .513** 1 .390** .270* .019 .661**
Sig. (2-tailed) .000 .002 .037 .887 .000
N 60 60 60 60 60 60
x3.3 Pearson Correlation .427** .390** 1 .432** .066 .696**
Sig. (2-tailed) .001 .002 .001 .616 .000
N 60 60 60 60 60 60
x3.4 Pearson Correlation .409** .270* .432** 1 .215 .731**
Sig. (2-tailed) .001 .037 .001 .099 .000
N 60 60 60 60 60 60
x3.5 Pearson Correlation -.018 .019 .066 .215 1 .427**
Sig. (2-tailed) .894 .887 .616 .099 .001
N 60 60 60 60 60 60
totalx3 Pearson Correlation .714** .661** .696** .731** .427** 1
Sig. (2-tailed) .000 .000 .000 .000 .001
N 60 60 60 60 60 60
**. Correlation is significant at the 0.01 level (2-tailed).
*. Correlation is significant at the 0.05 level (2-tailed).
Variabel Kinerja (Y)
Correlations
y1.1 y1.2 y1.3 y1.4 y1.5 y1.6 y1.7 y1.8 y1.9 totaly
y1.1 Pearson
Correlation 1 .400
** .444** .326* .137 .336** -.042 .040 .136 .543**
Sig. (2-tailed) .002 .000 .011 .295 .009 .747 .764 .300 .000
y1.2 Pearson
Correlation .400
** 1 .440** .372** .330** .436** .024 -.022 .177 .646**
Sig. (2-tailed) .002 .000 .003 .010 .001 .857 .866 .176 .000
N 60 60 60 60 60 60 60 60 60 60
y1.3 Pearson
Correlation .444
** .440** 1 .653** .367** .499** -.017 -.136 .259* .714**
Sig. (2-tailed) .000 .000 .000 .004 .000 .897 .299 .046 .000
N 60 60 60 60 60 60 60 60 60 60
y1.4 Pearson
Correlation .326
* .372** .653** 1 .379** .457** .040 -.020 .244 .692**
Sig. (2-tailed) .011 .003 .000 .003 .000 .762 .881 .060 .000
N 60 60 60 60 60 60 60 60 60 60
y1.5 Pearson
Correlation .137 .330
** .367** .379** 1 .399** .000 -.040 .086 .547**
Sig. (2-tailed) .295 .010 .004 .003 .002 1.000 .762 .515 .000
N 60 60 60 60 60 60 60 60 60 60
y1.6 Pearson
Correlation .336
** .436** .499** .457** .399** 1 .146 .064 .348** .761**
Sig. (2-tailed) .009 .001 .000 .000 .002 .265 .629 .006 .000
N 60 60 60 60 60 60 60 60 60 60
y1.7 Pearson
Correlation -.042 .024 -.017 .040 .000 .146 1 .249 .102 .286
*
Sig. (2-tailed) .747 .857 .897 .762 1.000 .265 .055 .439 .027
N 60 60 60 60 60 60 60 60 60 60
y1.8 Pearson
Correlation .040 -.022 -.136 -.020 -.040 .064 .249 1 .270
* .267*
Sig. (2-tailed) .764 .866 .299 .881 .762 .629 .055 .037 .039
N 60 60 60 60 60 60 60 60 60 60
y1.9 Pearson
Correlation .136 .177 .259
* .244 .086 .348** .102 .270* 1 .515**
Sig. (2-tailed) .300 .176 .046 .060 .515 .006 .439 .037 .000
N 60 60 60 60 60 60 60 60 60 60
Tota
lly
Pearson
Correlation .543
** .646** .714** .692** .547** .761** .286* .267* .515** 1
N 60 60 60 60 60 60 60 60 60 60
**. Correlation is significant at the 0.01 level (2-tailed).
*. Correlation is significant at the 0.05 level (2-tailed).
Uji Asumsi Klasik
Uji Autokorelasi
Model Summaryb
Model R R Square
Adjusted R
Square
Std. Error of the
Estimate Durbin-Watson
1 .805a .649 .630 1.986 1.743
a. Predictors: (Constant), totalx3, totalx1, totalx2
b. Dependent Variable: totaly
Uji Multikolinearitas
Coefficientsa
Model
Error Beta
Zero-order Partial Part
Toleran
1 (Consta
nt) 6.175 2.951 2.092 .041
totalx1 .359 .088 .356 4.084 .000 .585 .479 .323 .826 1.211
totalx2 .735 .232 .284 3.172 .002 .576 .390 .251 .782 1.278
totalx3 .669 .131 .438 5.121 .000 .632 .565 .406 .858 1.165
a. Dependent Variable: totaly
Uji F
ANOVAa
Model Sum of Squares df Mean Square F Sig.
1 Regression 408.060 3 136.020 34.486 .000b
Residual 220.873 56 3.944
Total 628.933 59
a. Dependent Variable: totaly
b. Predictors: (Constant), totalx3, totalx1, totalx2
Uji T
Coefficientsa
Model
Error Beta
Zero-order Partial Part
Toleran
ce VIF
1 (Consta
nt) 6.175 2.951 2.092 .041
totalx1 .359 .088 .356 4.084 .000 .585 .479 .323 .826 1.211
totalx2 .735 .232 .284 3.172 .002 .576 .390 .251 .782 1.278
totalx3 .669 .131 .438 5.121 .000 .632 .565 .406 .858 1.165
Uji Reliabilitas
Variabel Etika kerja X1
Case Processing Summary
N %
Cases Valid 60 100.0
Excludeda 0 .0
Total 60 100.0
a. Listwise deletion based on all variables in the
procedure.
Reliability Statistics
Cronbach's
Alpha N of Items
.775 7
Variabel Keselamatan Kerja (X2)
Reliability Statistics
Cronbach's
Alpha N of Items
.726 2
Variabel Kesehatan Kerja (X3)
Reliability StatisticsCronbach's
Alpha N of Items
.641 5
Variabel Kinerja (Y)
Reliability Statistics
Cronbach's
Alpha N of Items