SIMULATING VARIOUS TERRESTRIAL AND UAV LIDAR SCANNING
CONFIGURATIONS FOR UNDERSTORY FOREST STRUCTURE MODELLING
M. Hämmerle a, N. Lukač b, K.-C. Chen ( ✁ ✂)
c, Zs. Koma d, C.-K. Wang ( ☎✄✆)
c, K. Anders a, B. Höfle a,e *
a GIScience Research Group, Institute of Geography, Heidelberg University, Germany - (haemmerle, hoefle)@uni-heidelberg.de,
b Laboratory for Geometric Modeling and Multimedia Algorithms, Faculty of Electrical Engineering and Computer Science,
University of Maribor, Slovenia - [email protected]
c Department of Geomatics, National Cheng Kung University, Tainan, Taiwan - [email protected],
d Institute for Biodiversity and Ecosystem Dynamics, University of Amsterdam, The Netherlands - [email protected] e Heidelberg Center for the Environment (HCE), Heidelberg University, Germany
Commission II, WG II/10
KEY WORDS: forest structure, understory, laser scanning simulation, full waveform, 3D point cloud analysis, field campaign planning
ABSTRACT: Information about the 3D structure of understory vegetation is of high relevance in forestry research and management (e.g., for complete biomass estimations). However, it has been hardly investigated systematically with state-of-the-art methods such as static terrestrial laser scanning (TLS) or laser scanning from unmanned aerial vehicle platforms (ULS). A prominent challenge for scanning forests is posed by occlusion, calling for proper TLS scan position or ULS flight line configurations in order to achieve an accurate representation of understory vegetation. The aim of our study is to examine the effect of TLS or ULS scanning strategies on (1) the height of individual understory trees and (2) understory canopy height raster models. We simulate full-waveform TLS and ULS point clouds of a virtual forest plot captured from various combinations of max. 12 TLS scan positions or 3 ULS flight lines. The accuracy of the respective datasets is evaluated with reference values given by the virtually scanned 3D triangle mesh tree models. TLS tree height underestimations range up to 1.84 m (15.30% of tree height) for single TLS scan positions, but combining three scan positions reduces the underestimation to maximum 0.31 m (2.41%). Combining ULS flight lines also results in improved tree height representation, with a maximum underestimation of 0.24 m (2.15%). The presented simulation approach offers a complementary source of information for efficient planning of field campaigns aiming at understory vegetation modelling.
* Corresponding author
1. INTRODUCTION
Information about the state and development of forests is of crucial importance due to the eminent role which forests play, for example, as carbon sinks, habitats, provider of ecosystem services, and basis for economic exploitation (Kükenbrink et al. 2016, Chen and Wang 2016). Research is increasingly focussing on understory vegetation due to the central role of forest components located below the dominant trees (Gonzalez et al. 2013).
Consequently, capturing the spatial complexity of forest stands with high accuracy (conformity of measurements to true value) is widely recognized as a valuable asset (Ehbrecht et al. 2016, Liang et al. 2016). Especially methods that capture and analyse the complete volume embraced by forest stands allow the investigation of the understory in addition to the canopy surface of dominant trees (Liang et al. 2016, Marselis et al. 2016, Seidel et al. 2016).
A method broadly used for vegetation studies is laser scanning, which is especially well suited due to its capacity to penetrate vegetation through small gaps in the canopy, allowing for the acquisition of measurements which cover the whole volume of a forest stand. A further advantage is the active emission of measurement signals and the subsequent independence from lighting conditions (Liang et al. 2016, Koenig and Höfle 2016). The datasets provided by laser scanning are point clouds, which
consist of 3D coordinates collected by a scanning device, and optional attributes per point such as radiometric features of the captured surface (Koenig and Höfle 2016). Subsequent point cloud analysis can aim at a broad range of forest parameters such as understory gap fraction (Chen and Wang 2016, Danson et al. 2007, Zheng et al. 2016), tree positions and diameters at breast height (DBH) (Trochta et al. 2013), leaf area index (Farid et al. 2008), classification of tree species (Li et al. 2013, Brodu and Lague 2012) and aboveground biomass (Jochem et al. 2011).
Forestry research until recently examined mainly point clouds captured via airborne laser scanning (ALS) (Koenig and Höfle 2016). While being well-suited for capturing forest plots of typically several tens of square kilometres and with tens of measurements per square meter, ALS also exhibits restrictions. For example, higher measurement densities can be required, a need for more flexible field campaigns in terms of on-demand scanning can occur, or measurements have to be more accurate than the decimetres currently achieved by ALS.
Approaches which can serve these requirements include terrestrial laser scanning (TLS) and unmanned aerial vehicle-borne laser scanning (ULS) (Liang et al. 2016, Wieser et al. 2016). Especially research on understory vegetation benefits from the mentioned approaches because of a higher measurement density within the whole volume covered by a forest stand. Furthermore, in case of TLS the forest is captured ISPRS Annals of the Photogrammetry, Remote Sensing and Spatial Information Sciences, Volume IV-2/W4, 2017
from a side perspective, excluding potential occlusions of understory vegetation by dominant trees. Additionally, a denser coverage with measurements can be achieved on vertical objects such as trunks, leading to advantages in terms of deriving the diameter at breast height or similar parameters (Trochta et al. 2013, Ma et al. 2016). However, also TLS and ULS campaigns call for a thoroughly planned field campaign setup to completely over a forest with measurements (Trochta et al. 2013, Liang et al. 2016, Ehbrecht et al. 2016).
The aim of our study is to examine various TLS and ULS campaign setups with respect to their effect on understory vegetation structure parameters. To reach this goal, we analyse synthetic point clouds generated by laser scanning simulations, which makes it possible to provide data for various numbers and spatial configurations of TLS scan positions and ULS flight lines.
We examine (1) the height of individual understory trees and (2) understory canopy height raster models (uCHM) derived for 3D triangle mesh tree models covering a virtual forest plot of approximately 30 m diameter. Our results indicate that generally understory tree heights are underestimated with any method. In case of TLS, a triangular configuration of TLS scan positions is considered to offer an advantageous trade-off between accurate understory tree height modelling on the one side and a low number of scan positions on the other side. Based on the synthetic ULS datasets it is concluded that dominant trees reduce understory height model accuracy and numerous flight lines should be part of data acquisition.
The remainder of this paper is structured as follows: In the next section, details are given for the applied laser scanning simulation approach. Section 3 introduces the methods applied for deriving parameters describing understory canopy and tree height from point clouds acquired from different scan campaign configurations. The analysis results are presented and discussed in section 4, and finally the paper is concluded in section 5.
2. POINT CLOUD SIMULATION
The analysis presented in this study bases on synthetic point clouds of a virtual forest plot. The point clouds are generated with the multi-purpose Light Detection And Ranging (LiDAR) simulation framework HELIOS (Bechtold and Höfle 2016, Figure 1) by placing a terrestrial laser scanner on 12 positions in a circular arrangement with 10 m radius around 20 trees. Furthermore, the common TLS approach is compared with the emerging technology of UAV-borne laser scanning (ULS).
Figure 1: Exemplary visualization of HELIOS forest scan simulations. (a) Terrestrial laser scanning, (b) unmanned aerial vehicle-borne laser scanning. Red line: currently simulated laser
beam. Blue diamonds: TLS scan positions or ULS way points
The applied HELIOS simulation provides the full waveform for each virtual LiDAR measurement pulse. Multiple subrays that constitute the scanning cone are casted, and each subray has its
own laser energy function in time and space. In order to obtain the entire full waveform, the temporal energy discretization of each subray is summed into one signal. The accuracy of the FWF modelling depends on the number of subrays (in this study set to 19), the number of discrete bins for temporal and spatial energy functions (set to 200), as well as the used reflectance model. In this paper, the bidirectional reflectance distribution function (BRDF) model is used (Nicodemus 1965, Steinvall 2000). The applied HELIOS simulation provides (1) full waveform files containing the backscattered measurement signal strength within time bins of 5 ns per simulated laser beam, and (2) the XYZ coordinates of multiple measurement returns along a simulated laser beam derived via Gaussian decomposition of the full waveform signal. The study at hand analyses these readily available XYZ point clouds, which consist of multiple measurement returns per simulated laser beam.
Tree mesh generation is achieved in the free and open source software Arbaro (Weber and Penn 1995; license: GPLv2). The individual tree model parameters are set such that the produced 3D triangle meshes exhibit high physiognomic similarity with real-world trees, for example by defining the number of leafs per branch, the clustering of leafs on branches, leaf shape and length, number of ramifications, and tree height.
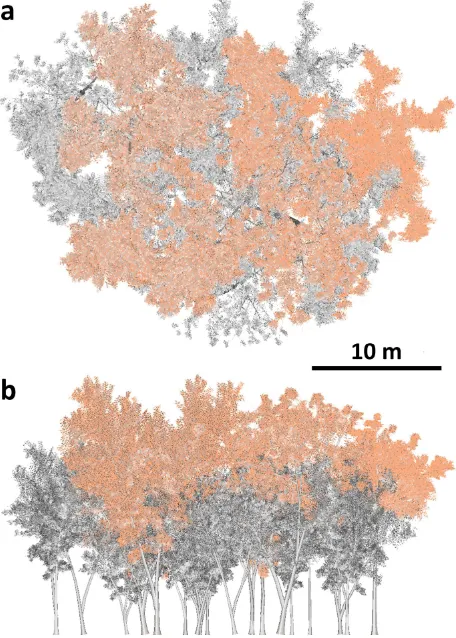
The simulated plot consists of 20 trees, which are positioned within a radius of approximately 15 m and on completely flat terrain. The trees are manually arranged in order to avoid overlapping tree crowns with one explicitly introduced exception (Figure 2). Five 3D triangle mesh tree models are labelled as dominant trees with tree heights ranging from 16 m to 20 m, 15 3D triangle mesh tree models are understory trees with tree heights ranging from 10 m to 15 m.
Figure 2: 3D triangle mesh tree models constituting the virtual forest plot scanned in the simulation. (a) Bird’s eye view, (b) side view. Orange: 5 dominant trees, grey: 15 understory trees ISPRS Annals of the Photogrammetry, Remote Sensing and Spatial Information Sciences, Volume IV-2/W4, 2017
The simulated terrestrial laser scanner is a Riegl VZ-400 device set to a horizontal and vertical angular resolution of 0.029°, corresponding to a point spacing of 5 mm at 10 m measuring range. To approximate a tilted device, which overcomes the restricted vertical field of view (FOV) of the real scanner, the simulated device was set to scan the scene completely from nadir to zenith.
The terrestrial scan positions (SP) are located within the forest plot such that a potential effect that can derive from empty space between scanner and trees at the edge of plot is excluded from the analysis. To avoid emphasized occlusion effects, a certain distance is kept between the scan positions and the tree trunks except for one tree which is explicitly placed directly next to the scanner.
The simulated ULS system comprises a Riegl VUX-1 ULS, which flies at a height of 30 m above ground. Spacing between nadir ground points is set to 0.02 m along and across flight direction. The simulated flight campaign consists of three parallel flight strips oriented in north-south direction.
We provide a repository with the precompiled HELIOS version applied for this study (cf. appendix). The repository contains the 3D triangle mesh tree models, the files setting up the simulated campaigns, the resulting raw point clouds, and the source code of HELIOS.
3. ANALYSIS METHODS
The tree height parameters examined in this study are (1) the tree height of individual understory trees, and (2) a raster model of the understory canopy height (uCHM). To examine different scanning strategies, the target parameters are derived from TLS and ULS point clouds arranged in different scan position or flight strip configurations (Figure 3).
Figure 3: Main processing steps conducted in the study
For the TLS case, 26 point clouds are analysed which result from the simulation of different scan position configurations considered to be realistic also in real field work (Table 1, Figure 4).
TLS scan position configuration Number of point clouds
Single 12
Opposing 6
Triangular 4
Rectangular 3
All combined 1
Table 1. Examined terrestrial laser scan position configurations and number of respective point clouds
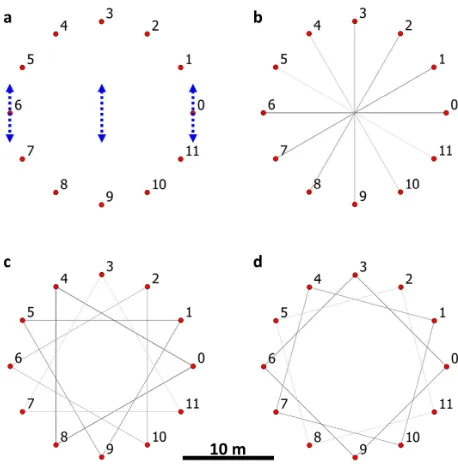
In case of ULS, three flight strip combinations are examined: (1) The single centre flight strip, (2) the combined outer flight strips, and (3) all three flight strips combined. The outer two flight strips overpass TLS scan positions 0 or 6, the central flight strip overpasses the TLS scan positions 9 and 3 (Figure 4).
To derive individual tree heights, all points belonging to a specific understory tree are extracted based on the “perfect” point cloud classification, which is offered by HELIOS by assigning an object ID to each simulated laser point. For each point cloud of the individual trees and the different scan platforms and scan position configurations, the maximum height above ground is determined. The extracted point cloud heights are finally compared to the respective reference tree height given by the initial 3D triangle mesh tree models. The differences between point cloud tree height and reference tree height are examined based on their median, maximum, and minimum values as well as the standard deviation (SD) and the root mean square (RMS).
Figure 4: Examined configurations of terrestrial laser scan positions. (a) Single or all combined, (b) opposing, (c) triangular, (d) square. Grey scale lines indicate scan position
combinations. Blue dotted arrows in (a) indicate ULS flight lines
In case of the uCHM, the point clouds comprising all understory trees are rasterized by assigning the maximum z value to the respective 0.5 m x 0.5 m raster cell. A reference uCHM is derived from a point cloud, which is generated by sampling points from each face of the 3D triangle mesh tree models. To cover the triangular faces densely with points, 50,000 points per square meter are sampled. Similar to the individual tree height differences, uCHM differences between the reference raster model and the raster models derived from synthetic point clouds are analysed based on statistical measures (median, maximum, minimum, SD, RMS).
4. RESULTS AND DISCUSSION
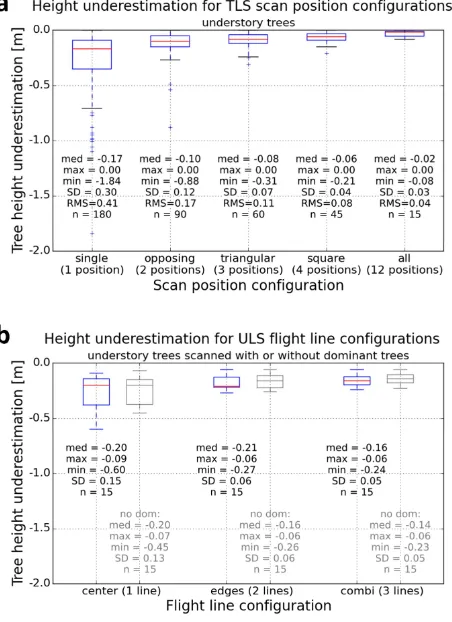
The absolute differences between (1) 3D triangle mesh tree model reference heights and (2) individual tree heights derived from the synthetic point clouds are summarized in Figure 5. In case of the 12 point clouds simulated for the single TLS scan positions, the 180 difference values (15 understory trees x 12 point clouds) reach a maximum tree height underestimation of 1.84 m, corresponding to 15.30% of the respective tree. The median underestimation of 0.17 m is relatively low. However, the single scan position configuration is considered to be of low reliability in terms of tree height derivation due to the large SD and RMS values which point at numerous and relatively large tree height underestimations.
By simulating scan campaigns with two positions opposite of each other, the maximum underestimation is distinctly reduced to 0.88 m (8.76%), and similar with SD and RMS. The triangular scan position configuration further reduces the magnitude and number of extreme values, with the maximum underestimation reaching 0.31 m (2.41%). Starting from the triangular scan position configuration, putting more effort into additional scan positions is not efficient, because with more than three scan positions, the magnitude of tree height underestimations decreases only slightly.
Figure 5: Differences between individual 3D triangle mesh tree model reference height values and respective height extracted
from synthetic point clouds. (a) TLS scan positions, (b) ULS flight strips (grey: simulation without dominant trees)
Similar in case of the ULS flight strip configurations (Figure 5b), where the combination of the two flight lines captured along the edge of the forest plot reduces the scatter of tree height underestimation values. The magnitude of the maximum tree height underestimation of 0.09 m (5.45%) is
lower compared to the single TLS scan position configuration, but higher when compared to two or more combined TLS scan positions. The median stays practically unchanged with one or two flight strips, and improves to 0.16 m for three flight strips compared to 0.08 m for three combined TLS scan positions. Excluding the dominant trees from the scan simulation and, thus, excluding potential occlusion of understory trees by overarching dominant trees, only slightly reduces the tree height underestimation (grey boxplots and values in Figure 5). Ehbrecht et al. (2016) similarly examined different TLS scan position configurations. Based on a rectangular grid of scan positions and random scan position combinations, the percentage of occluded voxels within a forest stand is derived from real-world point clouds. Similar to our results, Ehbrecht et al. (2016) suggest that multiple scan positions increase the accuracy of forest structure parameters, but at the same time the efforts for data acquisition and processing increases.
Compared to the study of Wieser et al. (2016), who derive tree heights from real-world ULS, ALS, and airborne laser bathymetry point clouds, the absolute underestimation values reach up to approximately 1.4 m, which is comparable to the single TLS scan position approach simulated in our study. However, Wieser et al. (2016) use the ULS point cloud as reference so that the underestimations derived from our synthetic ULS point clouds are excluded. Despite the caution advised regarding a direct comparison it can be stated that the underestimation values derived from our synthetic data is comparable to real-world cases in terms of magnitude.
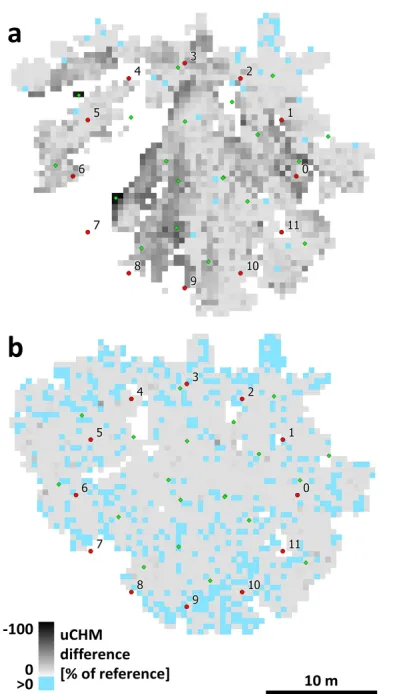
In terms of the raster height differences between the reference uCHM and the uCHMs derived from synthetic point clouds (Figure 6), the median, SD, and RMS values similarly improve with an increasing number of scan positions or flight strips. Again, the tendency of ULS-based values towards lower accuracy occurs. In case of the single TLS scan positions (SP), especially SP03 stands out with a median of 0.61 m, which can be attributed to the pronounced occlusions caused by a tree placed directly next to the scan position (Figure 7). The impact of occlusion persists even after the combination of multiple scan positions, which can be seen in the relatively large SD and RMS values for all cases where SP03 is included in a uCHM.
Figure 6: Differences between uCHMs derived from the reference point cloud, and from synthetic point clouds
A further phenomenon is the increasing number of uCHM cells with positive difference values, meaning an overestimation of understory canopy height in the synthetic point cloud (Figure 7). This can derive from discrepancies between the synthetic and the reference point clouds: The reference point cloud is sampled from faces of the tree mesh model with a given density of sample points per square unit. However, in case a face is very close to an uCHM raster cell edge, it can occur that in the reference point cloud, no point falls into the raster cell, ISPRS Annals of the Photogrammetry, Remote Sensing and Spatial Information Sciences, Volume IV-2/W4, 2017
but in the synthetic dataset, a point is recorded. In consequence, a uCHM raster cell can contain a synthetic point being higher than the points of the reference point cloud. The positive uCHM difference values are excluded from the median, SD and RMS calculation presented in figure 6.
Another influence on tree height representations can derive from specific artefacts: These can occur if a scanning cone is between the two initially captured objects. In consequence, uCHM raster cell values can comprise such artefacts.
The described artefacts are also of general interest regarding the two different perspectives examined in this study because such artefacts occur in direction of the outgoing measurement signal, i.e. outwards with respect to the sensor. Thus, upwards measurements from a terrestrial perspective can lead to artefacts pointing upwards, and vice versa for the aerial perspective with artefacts being lower than the initial object surface. Subsequently, the described artefacts can compensate tree height underestimations in TLS data, and they can emphasize tree height underestimations in ULS data.
Figure 7: Exemplary uCHM difference values. (a) uCHM derived from point cloud simulated for SP03, (b) all scan positions combined. Grey scale: uCHM underestimations from
100% of reference to 0% of reference, blue cells: uCHM overestimation
Overall, the magnitude of tree height underestimations and the effect of combining multiple scan positions are similar to the
results presented in other studies. Our simulations suggest that also in case of capturing understory vegetation, the effort for acquiring data from multiple perspectives pays off in terms of increasing accuracy of representing tree height. The highest number of TLS scan positions or ULS flight lines leads to the highest accuracy in individual understory tree height derivation and uCHM modelling. However, in case of TLS we estimate that starting from four scan positions, the increase of accuracy is marginal compared to the increased effort for data acquisition and processing.
In case of ULS, understory tree height underestimations are larger compared to the TLS case with two or more scan positions. This can be partly attributed to occlusion effects by dominant trees. However, also in case of ULS, combining multiple perspectives improves the tree height representation. A further approach to potentially improve tree height representation in ULS data is flying with less distance to the canopy, which can increase the penetration rate, and which leads to a higher measurement density.
A general aspect which is to address in context of an optimal scan campaign configuration is the requirements of the respective target application. For example, the tree height representation in datasets captured from single TLS scan positions or single ULS flight lines can already be sufficient for a study. At the same time, it can be more important to cover larger areas or to collect data for more plots, so that the approach with a low number of scan positions or flight lines may be more efficient. In this respect is has also to be kept in mind that the applied approximation of a tilted scanning device by simulating an extended vertical FOV omits the necessity to conduct multiple scans with tilted scanner orientations in case a real scene has to be captured without FOV-induced data gaps. Finally, it has to be mentioned that our results are derived from purely synthetic data. The individual 3D triangle mesh tree models are generated to represent real trees as close as possible, and they are carefully arranged to achieve a realistic virtual forest plot. The configuration of TLS scan positions and ULS flight lines is also designed to be realistic, similar to the choice of scan parameters. However, the partly overestimated uCHM heights emphasize that the results can be influenced by the applied simulation methodology. Thus, our findings contribute to campaign planning, but they cannot replace real world campaigns.
On the other hand, a simulation offers advantages in many respects. First, the synthetic point clouds are perfectly classified, i.e., each point is assigned to the corresponding object. The influence of erroneous point cloud classifications is subsequently excluded from the analysis. Second, especially in case of tree height, the reference value is known from the controlled and reproducible way. In consequence, innovative forest management strategies can be examined on the basis of simulated vegetation dynamics and respective point cloud analysis. Similarly, any scanning setup and functionality can be simulated independently from current technical restrictions or actually available devices. Thus, research strongly benefits from the opportunities to prospect innovative and specialized scanning solutions via simulation frameworks.
5. CONCLUSIONS
In our study, we examine different TLS scan position and ULS flight line configurations regarding their effect on understory vegetation height parameters. Our results base on point clouds, which are generated with a full-waveform laser scanning simulation framework (Bechtold and Höfle 2016).
We conclude that in our simulated TLS campaign, three scan positions represent a favourable trade-off between effort for data acquisition and processing. In case of ULS, the aerial perspective and subsequent occlusion of understory vegetation are considered to result in a generally lower accuracy of derived understory height parameters compared to the TLS approach. In consequence, ULS campaigns should comprise small distances between flight lines.
The presented results support the planning of efficient forest scanning campaigns with the assessment of scan position and flight line configurations. Generally, laser scanning simulation frameworks such as HELIOS are valuable tools for geoscientific research because they can generate valid datasets within a controllable frame as a basis for the development of analysis methods and to conduct real scanning experiments most efficiently. The examination of natural objects and processes can, thus, strongly benefit by this complementary source of point clouds and 3D geoinformation.
ACKNOWLEDGEMENTS
This study was supported by funds provided for the projects 3D-TAIGER (German Academic Exchange Service, ID:57217104) and 4DEMON (Ministry of Science, Research, and Arts of the German federal state of Baden-Württemberg), as well as project no. J2-6764 and core research no. P2-0041 LiDAR simulation framework for research, planning and training of laser scanning operations with airborne, ground-based mobile and stationary platforms. ISPRS Annals of Photogrammetry, Remote Sensing and Spatial Information Sciences, III-3, pp. 161-168.
Brodu, N. and Lague, D., 2012. 3D terrestrial LiDAR data classification of complex natural scenes using a multi-scale dimensionality criterion: Applications in geomorphology.
ISPRS Journal of Photogrammetry and Remote Sensing, 68(0), pp. 121-134.
Chen, K. C. and Wang, C. K., 2016. Evaluation of forest canopy and understory gap fraction derived from terrestrial laser scanning. ISPRS Annals of Photogrammetry, Remote Sensing and Spatial Information Sciences, XLI-B8, pp. 589-591.
Danson, F. M., Hetherington, D., Morsdorf, F., Koetz, B. and Allgower, B., 2007. Forest canopy gap fraction from terrestrial laser scanning. IEEE Geoscience and Remote Sensing Letters, 4(1), pp. 157-160.
Ehbrecht, M., Schall, P., Juchheim, J., Ammer, Ch. and Seidel, D., 2016. Effective number of layers: A new measure for quantifying three-dimensional stand structure based on
sampling with terrestrial LiDAR. Forest Ecology and Management, 380, pp. 212-223.
Farid, A., Goodrich, D. C., Bryant, R. and Sorooshian, S., 2008. Using airborne LiDAR to predict leaf area index in cottonwood trees and refine riparian water-use estimates.
Journal of Arid Environments, 72(1), pp. 1-15.
Gonzalez, M., Augusto, L., Gallet-Budynek, A., Xue, J., Yauschew-Raguenes, N., Guyon, D., Trichet, P., Delerue, F., Niollet, S., Andreasson, F., Achat, D. L. and Bakker, M. R., 2013. Contribution of understory species to total ecosystem aboveground and belowground biomass in temperate Pinus pinaster Ait. forests. Forest Ecology and Management, 289, pp. 38-47.
Jochem, A., Hollaus, M., Rutzinger, M. and Höfle, B., 2011. Estimation of aboveground biomass in alpine forests: A semi-empirical approach considering canopy transparency derived from airborne LiDAR data. Sensors, 11(1), pp. 278-295.
Koenig, K. and Höfle, B., 2016. Full-waveform airborne laser scanning in vegetation studies—a review of point cloud and waveform features for tree species classification. Forests, 7(9).
Kükenbrink, D., Schneider, F. D., Leiterer, R., Schaepman, M. E. and Morsdorf, F., 2016. Quantification of hidden canopy volume of airborne laser scanning data using a voxel traversal algorithm. Remote Sensing of Environment, available online.
Li, J., B. Hu and T. L. Noland (2013). Classification of tree species based on structural features derived from high density LiDAR data. Agricultural and Forest Meteorology, 171-172(0), pp. 104-114.
Liang, X., Kankare, V., Hyyppä, J., Wang, Y., Kukko, A., Haggrén, H., Yu, X., Kaartinen, H., Jaakkola, A., Guan, F., Holopainen, M. and Vastaranta, M., 2016. Terrestrial laser scanning in forest inventories. ISPRS Journal of Photogrammetry and Remote Sensing, 115, pp. 63-77.
Ma, L., Zheng, G., Eitel, J. U. H., Magney, T. S. and Moskal, L. M., 2016. Determining woody-to-total area ratio using terrestrial laser scanning (TLS). Agricultural and Forest Meteorology, 228–229, pp. 217-228.
Marselis, S. M., Yebra, M., Jovanovic, T. and van Dijk, A. I. J. M., 2016. Deriving comprehensive forest structure information from mobile laser scanning observations using automated point cloud classification. Environmental Modelling & Software, 82, pp. 142-151.
Nicodemus, F. E., 1965. Directional reflectance and emissivity of an opaque surface. Applied Optics, 4, pp. 767-775.
Seidel, D., Ehbrecht, M. and Puettmann, K., 2016. Assessing different components of three-dimensional forest structure with single-scan terrestrial laser scanning: A case study.
Forest Ecology and Management, 381, pp. 196-208.
Steinvall, O., 2000. Effects of target shape and reflection on laser radar cross sections. Applied Optics, 39, pp. 4381-4391.
Trochta, J., Král, K., Janík, D. and Adam, D., 2013. Arrangement of terrestrial laser scanner positions for area-wide stem mapping of natural forests. Canadian Journal of Forest Research, 43, pp. 355-363.
Weber, J. and Penn, J., 1995. Creation and rendering of realistic trees. SIGGRAPH '95 Proceedings of the 22nd annual conference on Computer graphics and interactive techniques. pp. 119-128.
Wieser, M., Hollaus, M., Mandlburger, G., Glira, P. and Pfeifer, N., 2016. ULS LiDAR supportet analyses of laser beam penetration from different ALS systems into vegetation.
ISPRS Annals of Photogrammetry, Remote Sensing and Spatial Information Sciences, III-3, pp. 233-239.
Zheng, G., Ma, L., He, W., Eitel, J. U. H., Moskal, L. M. and Zhang, Z., 2016. Assessing the contribution of woody materials to forest angular gap fraction and effective leaf area index using terrestrial laser scanning data. IEEE Transactions on Geoscience and Remote Sensing, 54(3), p. 13.
APPENDIX
Supplementary material: 3D triangle mesh tree models, HELIOS simulation executables, output point clouds can be accessed via DOI: http://dx.doi.org/10.11588/data/10101