Assessing the Capability of Sentinel-2A Data for Mapping Seagrass
Percent Cover in Jerowaru, East Lombok
Muhammad A. Fauzan, Ignatius S. W. Kumara, Rika Yogyantoro, Satrio Suwardana,
Nurul Fadhilah, Intansania Nurmalasari, Santi Apriyani, and Pramaditya Wicaksono
Received: September 2016 / Accepted: February 2017 / Published online: December 2017 © 2017 Faculty of Geography UGM and he Indonesian Geographers Association
Abstract Remote sensing technology has been widely used in various applications related to natural resources and environment monitoring. In this paper, we evaluated the capability of new Sentinel-2A image to map the distribution and percent cover of seagrass in optically shallow water of Jerowaru coastal area, East Lombok. Seagrass distribution map was produced from radiometrically and geometrically corrected Sentinel-2A image with overall accuracy of 61.9%. Using empirical model, seagrass percent cover was predicted with maximum coeicient of determination (R2) of 0.51 and standard error of estimate (SE) of 19.4%. he results suggest that Sentinel-2A image can be used to perform seagrass mapping time and cost-efectively and can be further improved by incorporating more robust empirical modeling technique.
Key words: Remote sensing, Sentinel-2A, Seagrass, Mapping
Abstrak Teknologi penginderaan jauh telah banyak digunakan dalam berbagai aplikasi terkait inventarisasi sumberdaya alam dan pemantauan lingkungan. Pada penelitian ini, kemampuan data penginderaan jauh Sentinel-2A diuji untuk memetakan distribusi dan persentase tutupan padang lamun di perairan laut dangkal Kecamatan Jerowaru, Lombok Timur. Peta distribusi padang lamun dihasilkan dari citra Sentinel-2A terkoreksi radiometrik dan geometrik dengan akurasi 61,9%. Menggunakan model empiris, persentase tutupan lamun diestimasi dari citra Sentinel-2A dengan koeisien determinasi (R2) sebesar 0,51 dan standard error (SE) sebesar 19,4%. Hasil penelitian ini menunjukkan data penginderaan jauh Sentinel-2A dapat digunakan untuk dalam pemetaan padang lamun dengan waktu dan biaya yang efektif.
Kata kunci: Penginderaan jauh, Sentinel-2A, Padang lamun, Pemetaan
1. Introduction
he coastal zone is essential to marine life and support a large part of the world’s living marine resources [Short & Coles, 2001]. One of the most valuable resources in the coastal area is seagrass. Seagrass habitats provide various ecological services such as ish feeding and nursery grounds, sediment stabilizer, and carbon storage [Hogarth, 2015]. Despite its importance, seagrass habitats are exposed to pressure and threat from anthropogenic and natural impact [Nadiarti, et al., 2012]. A study found that Indonesia has lost 30% area of its seagrass beds [UNEP, 2004].
In order to reverse the degradation trends, there is a growing need to map and monitor distribution and abundance of seagrass beds. his may provide useful
information for management and conservation strategy in coastal area. For decades, remote sensing technology has been widely used for mapping and monitoring coastal and shallow sea environment because of its cost-efectiveness and large area coverage [Hartono, 1994; Mumby, et al., 1997]. Several studies succesfully used remote sensing data to map seagrass area and percentage cover [Pu, et al., 2012], species composition [Fyfe, 2003], and other biophysical properties such as leaf area index [Wicaksono & Haizt, 2013], biomass [Knudby & Nordlund 2011], and above-ground carbon stock [Wicaksono, 2015].
he capability of moderate spatial resolution remote sensing data such as Landsat (30 m pixel size) and ASTER-VNIR (15 m pixel size) has already been demonstrated for mapping and monitoring seagrass biophysical characteristics [Armstrong, 1993; Mumby, et al.,1997; Wicaksono & Haizt, 2013; Pu, et al.,2014]. hose data are available for free, and has high revisit capability, and thus very useful to map large area cost efectively. Recently, a new earth-observation satellite named Sentinel-2A was launched on June 2015 as part of Sentinels mission and Europe’s Copernicus programme to provide data continuity for environmental ISSN 0024-9521
IJG Vol. 49, No.2, December 2017 (195 - 203) © 2017 Faculty of Geography UGM and he Indonesian Geographers Association
Muhammad A. Fauzan, Ignatius S. W. Kumara, Rika Yogyantoro, Satrio Suwardana, Nurul Fadhilah, Intansania Nurmalasari, Santi Apriyani, and Pramaditya Wicaksono
Cartography & Remote Sensing, Department of Geographic Information Science,
Faculty of Geography, Universitas Gadjah Mada, Yogyakarta, Indonesia.
Correspondent email: [email protected]
Muhammad A. Fauzan, dkk
monitoring of earth surface.Sentinel-2A satellite carries mult-ispectral imager (MSI) onboard with 13 spectral bands at visible, near-infrared, and shortwave-infrared wavelength with 10, 20, and 60 m spatial resolution, respectively. Moreover, the multispectral imager is capable of covering wide swath of 290 km, has frequent revisit time, and can be obtained freely, which make it very potential to be used in wide range of applications [ESA, 2015]. However, mapping seagrass abundance has never been done using Sentinel-2A data. his study aims to evaluate the performance of Sentinel-2A image to understand its potentials and usefulness for mapping seagrass biophysical properties. Seagrass percent cover was selected as the parameter of interest to be mapped, since it is currently recognized as a key parameter for seagrass monitoring efort [McKenzie, et al., 2001]. Seagrass percent cover is deined as the area of substrate which is covered by seagrass when observed directly from above [Phinn, et al.. 2008].
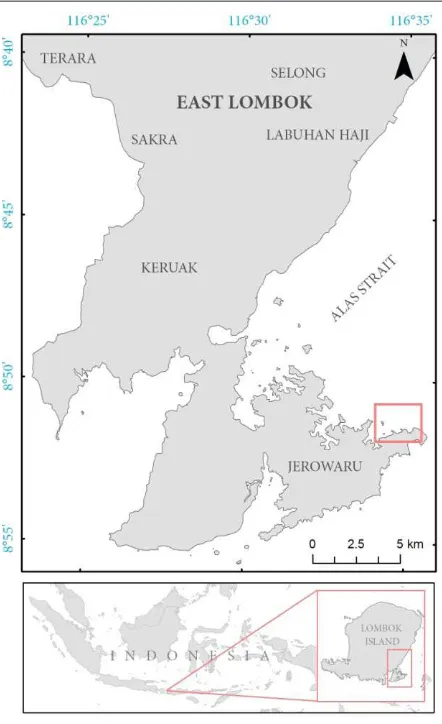
2. he Methods Study area
his research was carried out in part of north coastal area of Jerowaru District, East Lombok Region, Nusa Tenggara Barat Province. Seagrass are located in optically shallow water (<3 m depth) on sand and mud substrate and dominated by species such as Enhalus acoroides, halassia hemprichii, and Cymodocea rotundata. Several less-dominant species such as Halophila ovalis and Halodule universis are alsopresent. he condition of seagrass beds vary from continous beds with single species and mixed species to patchy beds. Seagrass beds in this study area are associated with other benthic organisms such as micro benthos and coral reefs.
Field methods
Fieldwork was carried out from 22 – 25 May 2016. Prior to ield survey, visual and digital image interpretation was performed to determine ield data location. Point-based ield data of substrate type, seagrass species composition, and percent cover were collected with photo-quadrat and photo-transect method [Roelfsema, et al. 2014] by snorkeller using digital underwater camera and 1 m2 quadrat. A handheld global positioning system device (GPS) was towed to a snorkeller to acquire ield data position. Photos taken from ield survey were interpreted in the laboratory.
Figure 1. he location of study area
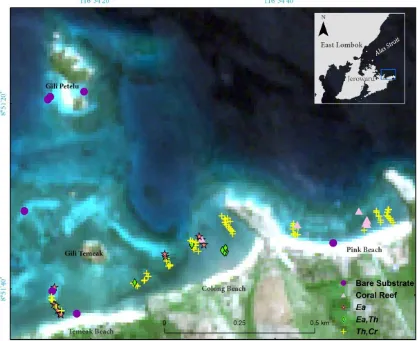
A total of 253 data points were collected and generalized into 96 samples to match Sentinel-2A image pixel size, which are presented in Figure 2. From all these samples, 80 samples are seagrass, and 16 others are non-seagrass. Half of seagrass samples were used to train the maximum likelihood classiication algorithm and develop the empirical model, while the other half was used for accuracy assessment.
Image data and pre-processing
efect was compensated using method developed by Lyzenga [1981], producing single depth-invariant bottom index from each pair of spectral bands. In this study, we named these depth-invariant bottom index (DII) bands as b2b3, b2b4, and b3b4, representing the pair of the origin spectral bands being used. hese three DII bands no longer contains relectance information of seabed objects but the normalized index value invariant to the variation of depth.
Benthic habitat mapping
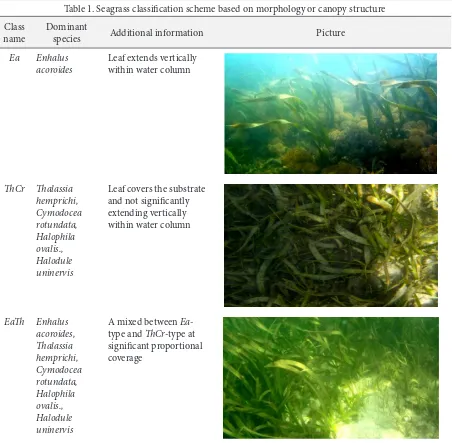
Digital supervised image classiication with Maximum Likelihood algorithm was applied on three DII from Sentinel-2A image to produce benthic habitat map. his habitat map was used to distinguish seagrass and non-seagrass area, since only seagrass pixels were used to map seagrass percent cover. Since seagrass biophysical properties were controlled by species [Wicaksono, 2015], it was necessary to diferentiate seagrass based on its morphology or canopy structure [Wicaksono & Haizt, 2013]. he classiication scheme used consists of six classes, which are bare substrate, coral reefs, Ea-seagrass,
Eah-seagrass, hCr-Eah-seagrass, and optically deep water. Details of seagrass classes are presented on Table 1. Confusion matrix analysis [Congalton, 1991] were used to assess the classiication accuracy of benthic habitats map.
Seagrass percent cover mapping
Empirical modelling approach was performed to estimate seagrass percent cover by calibrating DII values with corresponding ield seagrass percent cover data. We developed four linear regression models, three models for each class of seagrass (Ea, hCr, Eah) and one model for all class of seagrass regardless of their species and canopy structure. Seagrass percent cover data were used as the dependent variable while DII values were as the independent variable. From three DII bands, only bands that produced signiicant correlation at 95% conidence level (95%CL) with ield data were used as input in the empirical modeling of seagrass percent cover using regression analysis. he accuracy of the estimated seagrass percent cover was calculated using standard error of estimate (SE).
Muhammad A. Fauzan, dkk
Table 1. Seagrass classiication scheme based on morphology or canopy structure
Class name
Dominant
species Additional information Picture
Ea Enhalus
acoroides
Leaf extends vertically within water column
Leaf covers the substrate and not signiicantly extending vertically
Source: Wicaksono & Haizt [2013]
3. Result and Discussion Mapping seagrass distribution
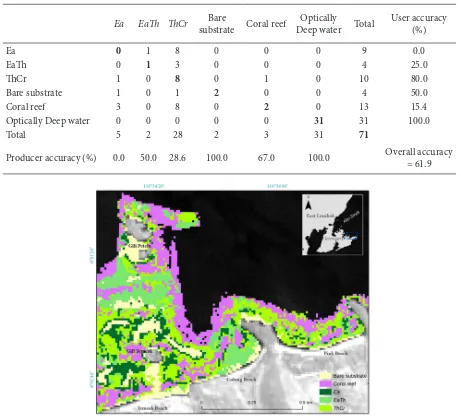
he result of Maximum Likelihood classiication is shown in Figure 3. An overall accuracy of 61.9% was obtained. he class with
the lowest user and producer accuracy is Ea,
where the user accuracy is zero percent (0%),
which mean that there is no chance that the Ea
class in the classiied image is actually seagrass
in the ield. In addition, 0% of Ea class producer
accuracy also means that no Ea class in the ield is
correctly classiied. Eah class, which contains Ea
species, was also tend to be missclassiied as hCr
class. Both bare substratum and coral reef class also sufered from similar misclassiication, where
most of them were classiied as hCr. Optically
deep water is the only class that was classiied correctly, suggesting that it was spectrally distinct
compared to benthic habitats in optically shallow water.
hese errors may come from various factors. he irst factor could be the environmental conditions of our study site. Our study site is a complex environment, where multiple species of seagrass and other benthic covers such as coral reefs and macro algae are present. During the high tide, the wave is likely causing a turbulance, which increases the water turbidity, due to the presence of limestone clifs which separates one beach to another. he suspension caused by wave turbulance may afect the relectance from water column and limit the penetration capability of Sentinel-2A visible bands.
he second factor is the spatial resolution
of Sentinel-2A image. At 100 m2, relectances
generalized. In addition, it is also problematic when diferent benthic objects are located adjacent to each other. he bandwidth and wavelength sensitivity of Sentinel-2A spectral bands may also incapable of detecting the diference of unique relectance from each seagrass class. Previous study shows that at less complex environment with homogenous benthic type, multispectral data have better performance in mapping benthic habitats [Green, et al., 2000; Goodman, et al., 2013].
hird, these high misclassiication rates of seagrass classes are mainly due to the limitation of samples available. Given more samples, we may yield better results as in Wicaksono & Haizt [2013]. he last factor, even though the probability is small, the error may be caused by the misidentiication and inconsistencies
of interpreter in interpreting the ield photos, suggesting that mapping benthic habitats as well as seagrass species composition in complex environment using remote sensing is still a diicult task.
Mapping seagrass percent cover
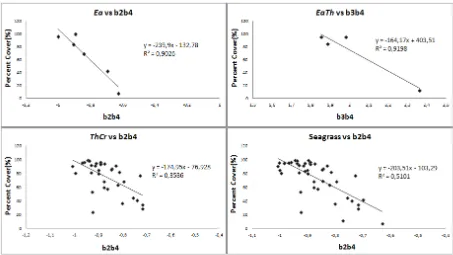
he empirical modeling of seagrass percent cover using Sentinel-2A image was performed using linear regression analysis. Linear regression models between Depth-invariant bottom index (DII) and ield seagrass percent cover data produced high coeicient of determination (R2). Linear regression graphics of the strongest
relationship between DII and ield seagrass percent cover for each seagrass class are presented in Figure 4. he accuracy of the estimated seagrass percent cover was provided at Table 3.
Table 2. Confusion matrix for classiication of nearshore benthic habitats at the study area. Field data in columns, classiication results in rows
Ea Eah hCr Bare
substrate Coral reef
Optically
Deep water Total
User accuracy (%)
Ea 0 1 8 0 0 0 9 0.0
Eah 0 1 3 0 0 0 4 25.0
hCr 1 0 8 0 1 0 10 80.0
Bare substrate 1 0 1 2 0 0 4 50.0
Coral reef 3 0 8 0 2 0 13 15.4
Optically Deep water 0 0 0 0 0 31 31 100.0
Total 5 2 28 2 3 31 71
Producer accuracy (%) 0.0 50.0 28.6 100.0 67.0 100.0 Overall accuracy
= 61.9
Muhammad A. Fauzan, dkk
he resultant regression function obtained from these empirical models can only be applied on the corresponding seagrass pixels. hus, we have four diferent seagrass percent cover models based on the empirical model of each seagrass class. Table 3 shows the SE of the estimated seagrass percent cover from the model. Because the habitat map produced from multispectral classiication was not capable to distinguish seagrass with diferent type of canopy structure, it was not possible to map seagrass percent cover for each seagrass type separately using these three empirical models. Hence, the only model used to map seagrass percent cover is the model developed from DII b2b4 for all seagrass class.In this complex environment where the water is slightly turbid and multiple seagrass species and associate benthic habitats are present, empirical model created from DII b2b4 derived from Sentinel-2A image had R2 of 0.51 with SE of 19.4%.
he accuracy of seagrass mapping of this research is lower than the result obtained by Topouzelis et al. [2016]. Nevertheless, the accuracy of seagrass percent cover model obtained in this research is not comparable to the research conducted by Topouzelis, et al. [2016] although they used similar sensor, especially since their class complexity is lower than in our research. heir classiication scheme consists of seagrass, sot bottom and hard bottom, while in this research we mapped the species composition.
Table 3. Accuracy assessment for seagrass percent cover model
Validation sample Band SE
(%)
Ea (n=5) DII b2b4 37.8
hCr (n=28) DII b2b4 18.0
Eah (n=3) DII b3b4 63.8
Total seagrass (n=36) DII b2b4 19.4
Separating seagrass from other benthic habitats is more feasible than diferentiating various seagrass species. However, our accuracy is comparable to other several studies that utilized diferent sensors. Using hyperspectral EO-1 Hyperion data with 30 m spatial resolution, Pu, et al. [2012] achieved R2 of 0.78 and SE
of 15.7% at shallow clear water Northwest coastline of Florida. Landsat 5 TM data produced lower result with
R2 of 0.59 and SE of 21.2%.
When mapping seagrass percent cover, Phinn, et al. [2008] suggested a classiication method with several classes of percent cover range in case the correlation between spectral band relectance and seagrass percent cover is not signiicant to enable the development of percent cover estimation based on regression analysis. At the same spatial resolution as Sentinel-2 data,
SPOT-5 data managed to map monobed Posidonia
oceanica seagrass at Laganas Bay, Greece with four
Figure 4. Linear regression analysis between DII value and ield seagrass percent cover showing mild (b2b4 -
benthic classes including dense cover seagrass, sparse cover seagrass, algae, and sand with high classiication accuracy of 96% [Pasquialini, et al., 2005]. his research also revealed that increasing the spatial resolution does not always have a positive impact in the accuracy of
classiication. In fact, pan-sharpened SPOT-5 image
with 2.5 m spatial resolution at the same region and classiication scheme produced lower classiication accuracy of 73% [Pasquialini, et al., 2005]. Phinn, et
al. [2008] used Landsat 5 TM, CASI, and Quickbird
image with spatial resolution of 30 m, 4 m, and 2.4 m respectively, to map four categories of seagrass percent cover at multi-species seagrass bed of Moreton Bay, and resulted in classiication accuracy not larger than
45%, suggessting the inefectiveness of these images
in distingusishing seagrass percent cover class using digital classiication.
Most of seagrass percent cover mapping approach used digital classiication and resulting in classes of seagrass percent cover range, or simpler class such as dense or sparse class of seagrass. However, mapping seagrass percent cover with empirical model results in
more preciseinformation since every pixel will have its
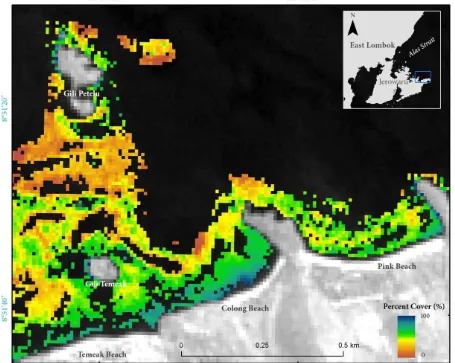
own percent cover value. his model later can be used as the baseline for deriving another seagrass biophysical properties such as standing crop or above-ground biomass and leaf-area index, which are the properties that highly correlated with seagrass percent cover [Wicaksono, 2015]. he resulting seagrass percent cover map is presented in Figure 5.
4. Conclusion
North coastal area of Jerowaru District is a complex environment, with the presence of several species of seagrass and associate benthic habitats. We found that even in the complex environment such as our study area, Sentinel-2A image can be used to map seagrass habitat distribution up to 61.9% overall accuracy and seagrass percent cover with SE of 19.4%. he accuracy could be better given more samples used to train and calibrate the image. Applying additional spectral transformations such as Principle Component Analysis (PCA) or Independent Component Analysis (ICA) [Wicaksono, 2016] might increase the accuracy and robustness of empirical modelling result. Hence,
Muhammad A. Fauzan, dkk
we concluded that Sentinel-2A could be a good data source for mapping and monitoring resources in coastal and nearshore optically shallow water environment over large area overtime cost-efectively.
Acknowledgement
Indetiication of seagrass species from ield photos was partially assisted by KSK Biogama (Faculty of Biology, Universitas Gadjah Mada). Land and water transportations during ieldwork was provided by Pak Hisyam and Pak Laodang. Finally, authors wish to thank Dr. Wirastuti Widyatmanti for valuable inputs during the study.
References
Armstrong, R. A. (1993). Remote sensing of submerged vegetation canopies for biomass estimation.
International Journal of Remote Sensing, 14(3), 621-627.
Chavez, P., Berlin, G., & Mitchell, W. (1977). Computer Enhancement Techniques of Landsat MSS Digital Images for Landuse/Landcover Assessments.
Remote Sensing of Earth Resources, 6, 259.
Congalton, R. G. (1991). A review of assessing the accuracy of classiications of remotely sensed data.
Remote Sensing of Environment, 37(1), 35-46.
[ESA] European Space Agency. (2015). ESA Bulletin
161(1).
Fyfe, S. K. (2003). Spatial and temporal variation in spectral relectance: are seagrass species spectrally
distinct? Limnology and Oceanography, 48,
464-479.
Green E. P., Mumby P. J., Edwards, A. J., Clark, C. D. (2000). Remote Sensing Handbook for Tropical
Coastal Management. Coastal Management
Sourcebooks 3, UNESCO, Paris.
Goodman, J. A., Purkis, S. J., & Phinn, S. R. (2013).
Coral Reef Remote Sensing A Guide for Mapping, Monitoring and Management. (S. R. Phinn, Ed.) Springer.
Hartono. (1994). he use of SPOT image for mangrove inventory in Cimanuk Delta, West Java, Indonesia.
Indonesian Journal of Geography, 26(28), 11-26.
Hogarth, P. J. (2015). he Biology of Mangroves and
Seagrasses. Oxford: Oxford University Press. Knubdy, A., Nordlund, L. (2011). Remote Sensing of
seagrasses in a patchy multi-species environment. International Journal of Remote Sensing, 32(8), 2227-2244.
Lyzenga, D. R. (1981). Remote sensing of bottom relectance and water attenuation parameters in shallow water using aircrat and Landsat data. International Journal of Remote Sensing, 71-82.
McKenzie, L., Finkbeiner, M. A., & Kirkman, H. (2001).
Seagrass Mapping Methods. Global Seagrass
Research Methods. F. T. Short & R .G. Coles. Amsterdam: Elsevier, 101-122.
Mumby, P. J., Green, EP., Edwards, AJ., Clark, CD. (1997). Measurement of seagrass standing crop using satellite and digital airborne remote sensing. Marine Ecology Progress Series, 159, 51-60. Nadiarti, Riani, E., Ita D., Sugeng, B., Ari, P., Harald, A.
(2012). Challenging for seagrass management in
Indonesia. Journal of Coastal Development, 15(3),
234-242.
Pasqualini, V., Pergent-Martini, C., Pergent, G., Agreil, M., Skoufas, G., Sourbes, L., Tsirika, A. (2005).
Use of SPOT 5 for mapping seagrasses: An
application to Posidonia oceanica. Remote Sensing
of Environment, 94, 39-45.
Phinn, S., Roelfsema, C., Dekker, A., Brando. V., Anstee, J. (2008). Mapping seagrass species, cover and biomass in shallow waters: An assessment of satellite multi-spectral and airborne hyper-spectral imaging systems in Moreton Bay
(Australia). Remote Sensing of Environment, 112,
3413-3425.
Pu, R., Bell, S. S, Meyer, C. A., Baggert, L. P, Zhao, Y. (2012). Mapping and assessing seagrass along the western coast of Florida using Landsat TM and
EO-1 ALI/Hyperion imagery. Estuarine, Coastal,
and Shelf Science, 115, 234-245.
Pu, R., Bell, S. S., Meyer, C. A. (2014). Mapping and assessing seagrass bed changes in Central Florida’s west coast using multitemporal Landsat
TM imagery. Estuarine, Coastal, and Shelf Science,
149, 68-79.
Roelfsema, C., Kovacs, E.M., Phinn, S. (2014). Field data sets for seagrass biophysical properties for the Eastern Banks, Moreton Bay, Australia,
2004-2014. Scientiic Data.
Short, F.T., Coles, R.G. (2001). Global Seagrass Research
Methods. Amsterdam: Elsevier.
Topouzelis, K., Spondylidis, S. C., Papakonstantinou, A., Soulakellis, N. (2016). he use of Sentinel-2 imagery for seagrass mapping: Kalloni Gulf
(Lesvos Island, Greece) case study. Proceedings
of SPIE 9688, Fourth International Conference of Remote Sensing and Geoinformation of the Environment.
[UNEP] United Nations Environment Programme.
(2004). Seagrass in the South China sea. UNEP
Technical Publication, 3. Bangkok.
Wicaksono, P., Haizt, M. (2013). Mapping seagrass from space: addressing of complexity of LAI
seagrass mapping. European Journal of Remote
Wicaksono, P. (2015). Remote Sensing Model Development for Seagrass and Mangrove Carbon Stock Mapping. Dissertation. Yogyakarta: Faculty of Geography, Universitas Gadjah Mada.
Wicaksono, P. (2016). Improving the accuracy of multispectral-based benthic habitats mapping using image rotations: the application of principle component analysis and independent component
analysis. European Journal of Remote Sensing, 49: