Reviewer Boards
Coordinator : Dr. Felicia Zahida, M.Sc
Reviewers : 1. Assoc. Prof. Dr. Michael Murkovic
(Biochemistry, Graz University of Technology Austria)
2. Prof. Marco Nemesio E. Montano, Ph.D
(Seaweed Biotechnology, University of the Philippines)
3. Ir. Ign. Pramana Yuda, M.Sc., Ph.D.
(Biotechnology, Universitas Atma Jaya Yogyakarta)
4. LM. Ekawati Purwijantiningsih, S.Si., M.Si
(Biotechnology, Universitas Atma Jaya Yogyakarta)
5. Dr. Kumala Dewi, M.Sc
(Biology, Gadjah Mada University)
6. Dr. M.M. Maryani, M.Sc
(Biology, Gadjah Mada University)
7. Dr. Vincentia Irene Meitiniarti
Seminar Committee
Accountable Person : Drs. B. Boy Rahardjo Sidhart a, M .Sc.
Chief : Dra. L. Indah M . Yuliant i, M .Si.
Chairman : Dr. rer. nat . Y. Reni Sw ast i, S.TP.,M P. Secretary : Yr. Gunaw an Sugiyant o (Coordinat or)
F.X. Sigit Nugroho
Bernadet a Sept in Purnama Wat i
Exchequer : M . Erni Pudyast ut i, S.Pd.
Programme Coordinator : Dr. rer. nat . Yuliana Reni Sw ast i, S.TP.,M P. (coordinat or)
Dr. Felicia Zahida, M .Sc
Ir. Ign. Pramana Yuda, M .Si., Ph.D.
L.M . Ekaw at i Purw ijant iningsih, S.Si.,M .Si Nelsiani To’bungan, S.Pd., M .Sc
Promotions and documentation coordinator
: Rr. A. Vit a N.P.A., S.Pd., M .Hum., P.h.D Johan Sumarlin, S.Kom
Decorration coordinator : A. Wisnu Trisno Widayat (coordinat or) FX. Widyo Hart ant o
Alb. Agus Adi Riyant o Equipment coordinator : A. Hart ono (coordinat or)
V. Lilik Wibaw ant o
Hospitality coordinator : Fr. Sulist yow at i (coordinat or) C. Puput Pramest i, S.Si.
Grant coordinator : Drs. F. Sinung Pranat a, M P. (coordinat or) Drs. P. Kiant o At modjo, M .Si.
Drs. A. Wibow o Nugroho Jat i, M S Dra. E. M ursyant i, M .Si.
Secretariat coordinator : Jacqueline Hayu Vika Dhavesia
Welcome Speech
Chair of the Seminar Committee
Distinguished Guests, Honorable Speakers, Ladies and Gentlemen,
It is a great pleasure to welcome all of you to the International Seminar “Natural Resources: From Local to Global”. The Faculty of Biotechnology of Universitas Atma Jaya Yogyakarta runs this seminar to commemorate the 50th Anniversary of the Universitas Atma Jaya Anniversary and the 25th Anniversary of the Faculty of Biotechnology. Your presence is your present for the anniversary of our university and faculty as well.
The Anniversary is not the only reason to run this seminar. A greater reason is behind the seminar. Indonesia is rich in biodiversity. It is a challenge for us, as scientist, to maintain the biodiversity and to develop the potential of the biodiversity for the common good. Through this seminar, the scientific research on Indonesian biodiversity can be shared and probably the finding of the new research can inspire us for further exploration. Therefore, the seminars goal is to facilitate the spread of the research on local potential of biodiversity to the global level. Hopefully, it can attract more researchers to explore the wealth of local biodiversity.
The committee invites speakers who are expertise in the research concerning biodiversity. Our invited speakers are Assoc. Prof. Dr. Michael Murkovic from Graz University of Technology Austria (food scientist), Assoc.Prof. Worawidh Wajjwalku from Kasetsart University Bangkok Thailand (Veterinary disease biotechnology), Dr. Kathryn McMahon from Edith Cowan University Australia (Seagrass biotechnology), Prof. Marco Nemesio E. Montano, PhD from University of the Philippines (Seaweed biotechnology), Prof. Jun Kawabata from Hokkaido University Japan (food biochemist), Endang Semiarti, PhD from Universitas Gadjah Mada, Indonesia (Plant biotechnology), Ign. Pramana Yudha, PhD from Universitas Atma Jaya Yogyakarta (Conservation genetics), Dr Machmud Thohari from Technical Team for Environmental Biosafety, Ministry of Enviroment & Forestry Indonesia (Environmental Biosafety), Dr Harvey Glick from Asia Regulatory Policy & Scientific Affairs Monsanto Company (Regulatory Policy & Scientific Affairs Monsanto). It is a good opportunity to learn from the speakers to enhance and to update our knowledge. I hope this seminar is of benefit to all of us.
In conclusion, I wish you a successful seminar and a pleasant stay in Yogyakarta.
With kind regard
Coordinator of conference program
WELCOME SPEECH
On behalf of the Faculty of Biotechnology, Universitas Atma Jaya Yogyakarta and the Committee of the International Seminar, I would like to first of all to extend our heart-felt thanks for your presence at this Seminar. This seminar is so significant in a sense that it focuses on natural resources with local content but by utilizing biotechnology they will become global and worldwide products and services as well.
Biotechnology has been developed very rapidly and it is believed to be “a new wave in the economic world”. Biotechnology has contributed in all aspects of humans’ life, such as food production, health, industry, environment, etc. The role of biotechnology for the betterment of human beings, however, is still need to be improved. Indonesia, with its huge biodiversity, has a potency to develop and applied biotechnology nationwide.
The role of biotechnology has increased rapidly. Many are believed that biotechnology has become an integral part of modern industries with high economic values. On the other hand, it needs to be closely managed in order to avoid its negative impacts. The are some example of negative impacts with relate to biotechnology application, such as intellectual property rights, genetically modified organisms (GMOs), environmental degradations, biodiversity issues, indigenous people knowledge, biosafety, etc.
The Seminar covers topics such as: Functional Foods, Food Biotechnology, Biopharmacy, Health/Medical Biotechnology, Environmental Biotechnology, Legal Aspect of Biotechnology, Bioinformatics, and Social-Economic Aspects of Biotechnology. This Seminar will be presented nine (9) invited speakers with different topics and expertise. There will be some papers and posters to be presented also in this Seminar from some participants from the Philippines and Indonesia.
Henceforth, in commemorating its 50th anniversary Universitas Atma Jaya Yogyakarta (UAJY) and 25th anniversary of Faculty of Biotechnology, Universitas Atma Jaya Yogyakarta (UAJY) on September 2015, it is worthy and appropriate to explore the newest innovations in the field of research and development of biotechnology to be applied in many aspects for the betterment of human beings. The Seminar takes this opportunity to discuss and hopefully find ways to solve problems faced by human beings in the world.
I would like to take this opportunity to express my sincere thanks and gratitude to the Committee and in particular to the honorable speakers. Before closing this remarks, allow me to ask the Rector of Universitas Atma Jaya Yogyakarta to open this Seminar officially.
Finally, this is an opportune time for me to wish you all in the two (2) fruitful days of interesting and beneficial programs and hope you have a pleasant stay in Yogyakarta.
Thank you very much and may God bless us all. Amen. Yogyakarta, 8 September 2015
Dean
Brief Contents
Reviewer Boards i
Seminar Committee ii
Welcome Speech Chair of Seminar Committee iii
Welcome Speech Dean Faculty of Biotechnology Universitas Atma Jaya Yogyakarta
iv
Brief Contents v
1. Age Structure of Babylonia spirata L 1758 From Gesing Beach, Yogyakarta, Indonesia (Felicia Zahida)
1 2. The Effect of Nitrogen Excess in Medium on Carotenoid and Chlorophyll
Content of Chlorella Zofingiensis Donz Culture (Eko Agus Suyono, Umi Muavatun, Faridatul Husna, Husnul Khotimah, Ika Pratiwi, Rahmah Husna, Fitri Cahyani, Yuni Purwanti, Thoriq Teja Samudra)
9
3. Enzymatic Modification of Chicken Feathers Waste As Livestock Feed Rich in Nutrients (Ditya Lasarati, Maharani Pertiwi Koentjoro, Endry Nugroho Prasetyo)
15
4. Detection of Bovine Viral Diarrhea Virus for Identification of Persistently Infected Animal in Dairy Cattle Herds (P. Anika, R. Warsito, H. Wuryastuti)
24 5. The Study of Bioactive Compound Lesser Yam (Dioscorea esculenta), Wild
Yam (Dioscorea hispida), and Arrowroot (Maranta arundinacea) Tubers as Source of Antioxidants (Ari Yuniastuti, Retno Sri Iswari, Nanik Wijayati)
29
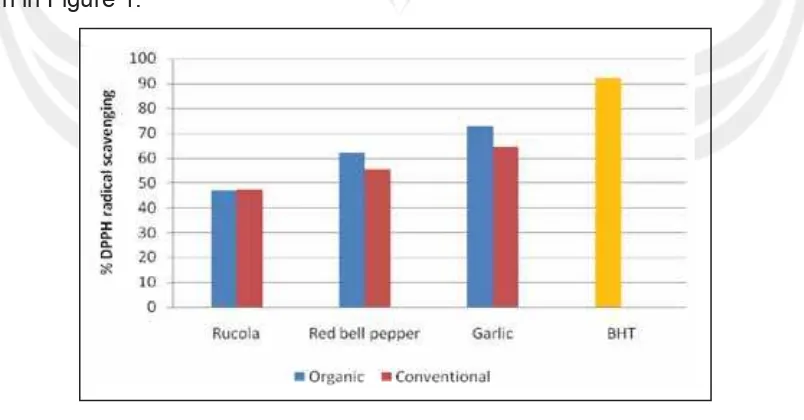
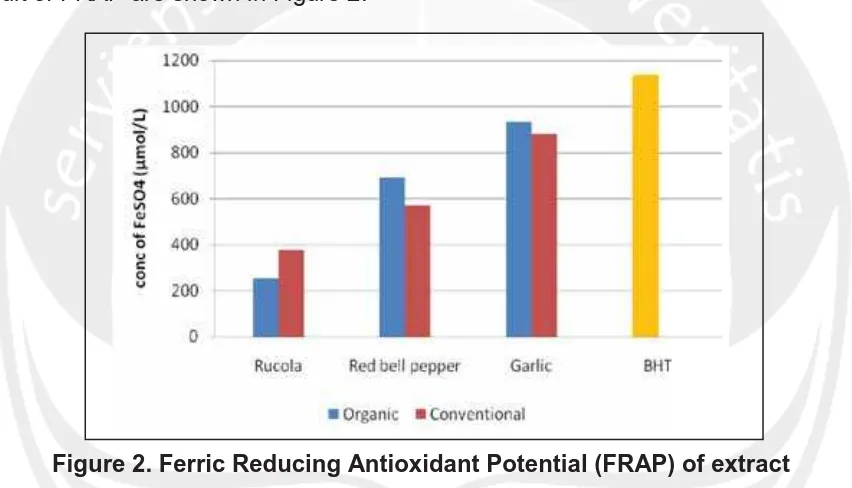
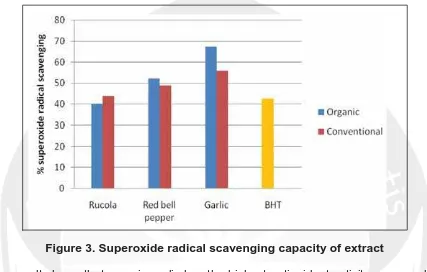
6. Phenolic Compound and Antioxidant Activity of Arganically and Conventionally Grown Vegetables as Potential Functional Food Ingredients (Ignasius Radix A.P. Jati)
36
7. Hypoglycemic In Vivo Bioassay of Protein Isolate from Cowpeas (Vigna unguiculata) Sprout (Vigna unguiculata) Sprout (Bayu Kanetro)
45 8. Effect of Combination Between Carrying material and Different Store
Duration on Production of Biofungisides Trichoderma harzianum pellet (Juni Safitri Muljowati, Purnomowati, Aris mumpuni)
49
9. Optimization Production and Characterization of Chitin Deacetylase by Thermophilic Bacillus Sp. Sk II-5 (Qintan Istighfarin Atmaja, Nur Shabrina, Maharani Pertiwi Koentjoro, Endry Nugroho Prasetyo)
57
10. The Antioxidant Activities of The Extracts of Red Fruit (Pandanus conoideusLam.) Pre-dried byDétente Instantanée Contrôlée (DIC)(Ratih, Kohar, Indrajati, Anesia Qalbye, Hadiyat, M. Arbi, Allaf, Karim)
65
11. Using species specific primers for detecting DNA in a wildlife feces (Sena Adi Subrata)
76 12. Antioxidant and Antibacterial Activity of Humped Bladderwort Extract
(Utricularia gibba) (Shanti Dwita Lestari, Siti Hanggita Rachmawati, Ivan Andeska Marpaung)
81
13. Diversity of Termite Species in Tropical Forest in West Kalimantan (Yuliati Indrayani and Tsyoshi Yoshimura)
88 14. The Effect of Salicylic Acid and Phenylalanineon the Total Phenolic Acid
Contentin Cell Suspension Culture of Moringaoleifera Lam. (Yunita Permanasari, Elvian Haning Pramesti, Isdiantoni, Maharani Pertiwi Koentjoro, Nurul Jadid, Endry Nugroho Prasetyo)
15. Mangrove Degradation Impacts on Biomass of Intertidal Macrozoobenthic: a Case Study at Sembilang, South Sumatra, Indonesia (Agus Purwoko and Wim J. Wolff)
102
16. The Effect of Elicitors (Salicylic Acid and NaCl) on Total Flavonoid and Flavonol Content in Moringa oleifera Lamk. Cell Suspension Culture (Elvian Haning Prameisti, Nurul Jadid, Isdiantoni, Maharani Pertiwi, Endry Nugroho Prasetyo)
117
17. Development of Cecal Coccidiosis Immunized Chicken for Controling on E. tenella Infection by Administration of attenuated E. tenella (Muchammad Yunus, Endang Suprihati, Suryanie Sarudji)
128
18. The Character of Biogas Fermentation on Simple Sugars by Enterobacter ludwigii Mutants (Mariana Wahjudi, Bryant Roossel Macciano, Junus Rangan and Mangihot Tua Goeltom)
131
19. Selection of Natural Antimicrobial in Poteran Island Based Ethnobotany (Fanindya Citra Ayu Ardian, Isdiantoni, Maharani Pertiwi Koentjoro, Endry Nugroho Prasetyo)
140
20. Improvement of Growol As a Probiotic-Functional Food (Case Study at Kalirejo, Kokap, Kulon Progo, DIY) (Chatarina Wariyah and Sri Luwihana)
150
21. Biogrouting: Urease Production From Carbonat Presipitation Bacteria (Oceabobacillus sp.) (Sidratu Ainiyah, Endy Nugroho, Puspita Lisdiyanti, Maharani Pertiwi)
157
22. α-Glucosidase Inhibitors from Indonesian Indigenous Plants, Pluchea indica L. leaves and Caesalpinia sappan Wood (Ines Septi Arsiningtyas, Eisuke Kato, Jun Kawabata)
167
23. Mixture of Sambiloto (Andrographis panniculata Nees.) and Salam (Syzygium polyanthum (Wight.) Walp.) Extract to Improve GLUT4 and PPAR-γ Expression in Hyperglicemic Wistar Rats (Wahyu Dewi Tamayanti, Ferawati, Iwan Sahrial Hamid, Elisabeth C. Widjajakusuma)
178
24. PCR Detection of Early Mortality Syndrome in Penaeus vannamei and
Penaeus monodon in the Philippines (Irma M. Dabu and Mary Beth B. Maningas)
184
25. Simple, Efficient and Inexpensive: Innovations to WSSV Diagnostics for The Shrimp Industry (Mary Beth B. Maningas, Pocholo Mari T. Arabit, Sharlaine Joi Ann B. Orense, Joselito A. Tabardillo Jr., Benedict A. Maralit, Erica M. Ocampo, Patrick Ellis Z. Go, Ricardo S. Balog, Christopher Marlowe A. Caipang)
192
26. Molecular Aspects of Zinc Intake (Zn) and Selenium (Se) on Glycosylated hemoglobin (HbA1c) in patients with type 2 Diabetes Mellitus (DMT2) (Indranila KS, Judiono, Yuliati Widiastuti)
203
27. Sorghum (Sorghum bicolor L. Moench) Leaves Bioethanol Production (Birgitta Narindri, Muhammad Nur Cahyanto, Ria Millati)
211 28. Dilation of The Brain Ventricles Due to Infection of Toxoplasma Gondii
(Lucia Tri Suwanti, Mufasirin, Hani Plumeriastuti)
218 29. Effect of Paclobutrazol on Growth and Saponin Content of Binahong
(Anredera cordifolia (Ten.) Steenis) (Rosiana Dwi Wahyuni and Kumala Dewi)
220
30. Preproduction Chitin Deasetilase from Fisheries Waste (Rischa Jayanty, Maharani Pertiwi Koentjoro, Endry Nugroho Prasetyo)
229 31. Growth Responses of Kencur (Kaempferia galangaL.) with Addition of IBA
and BAP in In Vitro Propagation (Muji Rahayu, Bambang Pujiasmanto,
32. Bacterial Diversity on Red Macroalgae Kappaphycus alvarezii Infected by Ice-Ice Disease (Nur Shabrina, Qintan Istighfarin Atmaja, Isdiantoni, Maharani Pertiwi Koentjoro, Endry Nugroho Prasetyo)
244
33. Characteristics of Tilapia (Oreochromis niloticus) Fillet Chips on Different Formulation of Flour Dough during Storage (Nunuk Siti Rahayu)
252
34. Degradation of Crude Oil-Contaminated Soil by Oxidoreductases (Muhamad Abdul Qorip, Nur Shabrina, Maharani Pertiwi Koentjoro, Endry Nugroho Prasetyo)
264
35. Utilization of Wood and Bran Waste for Laccase Production by Pleurotus ostreatus (Febrian Mayang Arumingtyas, Maharani Pertiwi Koentjoro, Endry Nugroho Prasetyo)
273
36. Variation of Rice Husk, Corn Husk and Corn Hump Ratio as Alternative Growth Media for Pleurotus osteatus (White Oyster Mushroom) (Maria Goretti M. Purwanto, Theresia D. Askitosari, Tjandra Pantjajani, Andreas L. Wijoyo)
280
37. Enhancing Production of Woody Edible Mushrooms by Modifying Nitrogen Source Components of The Medium (Aris Mumpuni and Purnomowati)
285
38. Biochemical and Moleculer Characterization of Typical Staphylococcus aureus Isolates from Pasteurized Milk in Yogyakarta (Maria Irene Irwanto and Tri Yahya Budiarso)
290
39. Variability and Intraspecies Classification of Gembolo (Dioscorea bulbifera
L.) in Yogyakarta and Surronding Areas Based on Morphological Characters (Purnomo)
296
40. Potentiality of Ketapang (Terminalia catappa L.) Leaf Extract as Antimicrobial Agent against Ice-ce Disease (Siti Luthfiyah, Isdiantoni, Maharani Pertiwi Koentjoro, Endry Nugroho Prasetyo)
306
41. Effect of Drying Methods on Hygiene Level and Seaweed (Eucheuma cottonii) Quality (Risanda Martalina Astuti, Maharani Pertiwi Koentjoro, Endry Nugroho Prasetyo)
314
42. Acute Lung Toxicity of Juice and Soup of Katuk (Sauropus Androgynus) Leaves as Breastmilkbooster Related to Bronchiolitis Obliterans (Amelia Lorensia, Oeke Yunita, Anreas Kharismawan, Cindy Edelweis)
326
43. Mouse Sperm Agglutination with Total Protein Extracted from Endosperm Seeds ofTerminalia catappa(Hery Haryanto, Aceng Ruyani, Selfianti)
336
44. The Plankton Characteristic of Winong Lake in Gunung Kidul (Agus Suyanto)
341
45. Cloning of cDNA Encoding Membrane Protein of Tachyzoite of
Toxoplasma gondiiIn pUC19 (Mufasirin, Wayan T. Artama, Sumartono, Sri Hartati)
349
46. Accumulation of Mercury in Legume Cover Crops Inoculated with Rhizosphere Microbes (Hanna Artuti Ekamawanti and Wiwik Ekyastuti)
Age Structure of Babylonia spirata L 1758 From Gesing
Beach, Yogyakarta, Indonesia
Felicia Zahida
Faculty of Biotechnology, Universitas Atma Jaya Yogyakarta Jl. Babarsari 44, Yogyakarta 55281
Email: [email protected]
Abstract
Babylonia spirata L 1758 from Gesing Beach Yogyakarta has been harvested more than a decade but it seems that the community does not use their potency well. There is a need to understand the real potency and the possibility to be harvested
more. Nowadays there is a need to see the specific characteristic of Babylonia
spirata through its age structure to understand further its population dynamic. The
aim of this research was to elucidate and estimate the age structure of Babylonia
spirata from Gesing Beach Yogyakarta. Method use was sampling 5% of the harvest snails and measure its shell length (mm). Data were then builded in length frequency of the shells. Analysis used was Elefan I from FiSAT package to elucidate growth
parameter K and L∞. Second phase of the analysis were using Bhattacharya and
Monte Carlo methods to build the age structure of Babylonia spirata. Result shows
that growth parameter value were K 0,27 and L∞ was 55.65 mm. K was low means that this species need quite a long time to reach its maximum size. Age structure composed of five (5) age classes using Bhattacharya method, and four (4) classes using Monte Carlo method. Age structure shows tendency of increase and no indication of overfishing.
Keywords: Babylonia spirata, Pantai Gesing, Elefan I, metode Bhattacharya dan
Monte Carlo
1. INTRODUCTION
Babylonia spirata is well known as Keong Macan in Indonesia. This species is common in Indo-Pacific region. Altena dan Gittenberger (1981) classify it in genus
Babylonia Schülter 1838, and familia Buccinidae. Distribution in Indonesia is from South Sumatera, Java and Madura. Although Indonesia exportsthis snail to other countries, only fewpeople know about this species as an edible food. Only a few restaurants serve this snail fresh and as one of their delicacy food.
Recently, some peoples posted to the internet that they eager to buy Keong Macan in all size, in an unlimited amount. But again, this is because of the export demand. They offered that opportunity with a good price and this increase the enthusiasm to harvest more.
work in rough big waves. Thatfact supports the possibility condition that the statusof the B. spirata is not overfishing yet.This is why basic knowledge on population dynamics needs to be revealed.
One of the part needs to be elucidated is the age structure of the Babylonia spirata L, 1758. This is a starting point to understand the population dynamics of the species B. Spiratain its habitat in Indonesia. Some researches that were done earlier are:
Yulianda (2009) on the development of Babylonia. spirata(Linnaeus 1758) larvae;
Andamari (2009) reseached on variation of fishing gear and handicrafts of Keong
Macan (Babylonia spirata L. 1758) in Cilacap water. Diniah (2009) Utilization of
Keong Macan as natural resources using bubu as trap tool.This research emphasized on optimation of folding-bubu’s utilization in substrat; Yulianda (2007)
on the feed utilization for somatic growth and reproduction Keong Macan (Babylonia
spirata., L. 1758); Apritia (2006) worked on tendency to eat natural baits of Keong
Macan (Babylonia spirata L.). This was a laboratory research.Previous reserch done
was on catching method, bait, and factors that affect arrest of Keong Macan (Zahida 2014).
This research aim to reveal the age structureof Keong Macan, Babylonia spirata, and the age grups number in population. Secondly,this aims to estimate the future tren of the population. Analysis comparation were usingBhattacharya and Monte Carlo methods.
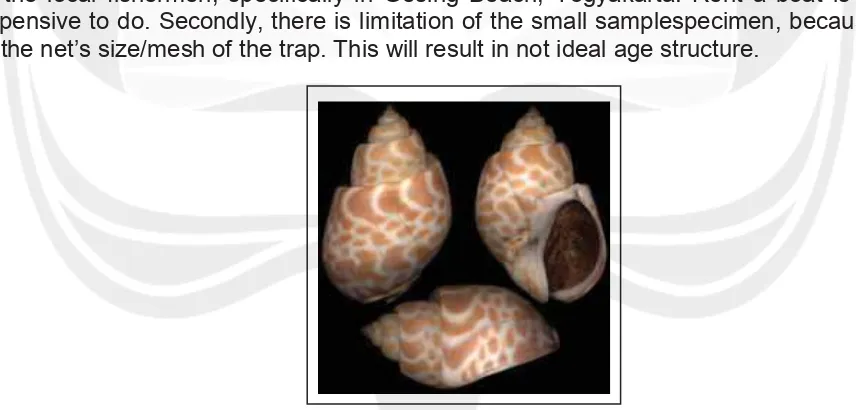
Limitations of this study are, first, there is a dependency to the situation and condition of the local fishermen, specifically in Gesing Beach, Yogyakarta. Rent a boat is to expensive to do. Secondly, there is limitation of the small samplespecimen, because of the net’s size/mesh of the trap. This will result in not ideal age structure.
Figure 1. Babylonia spirata L fromGesing Beach, Daerah Istimewa Yogyakarta (Photograph by Felicia Zahida)
2. METHODS
methods (Pauly 1984; Sparre and Venema, 1998). FiSAT II package was downloaded from website FAO.Results were analyzed descriptively.
3. RESULTS AND DISCUSSIONS 3.1 Harvest Activity
Data collections of Keong Macan from Gesing beach show irregularity in activity, this indicate that fishermen were depend more on fishes harvest compare to snail harvest. When high price of fishes presence they do not harvest snail. Figure 2 shows the irregularity of the harvest activities recently.
Figure 2. Harvest activities of B. spirata from Gesing beach year 2008-2011
Figure 2. shows that snails harvest is an alternative activity when fishes harvest is not satisfactory. Year 2008 was a boomingtime of B. spirata, but several years later were not. This may affects the research.
Figure 3. Gesing Beach, Girikarto, Gunung Kidul, Yogyakarta GPS position 8o06’30,30”S and 110o28’05,63”E; 08o06’28,53”S and 110o28’07,56”E
Gesing Beach was hidden at the western Gunung Kidul municipality. This location is easily accessible from Imogiri rather than Wonosari, as we can see at the map Figure 3. The community is small, so as the harvest results. Peaks were in April-September (2008), February-August (2009, 2010), June-July (2011). The difference of the harvest results were because of the priority of catch fishes.
3.2 Growth Parameter
B.spirata’s growth curve can be showed in Figure 4. Prediction number of cohort from population present in that area was formedusing Elefan I analyzes.
Figure 4. Growth curve of B. spirata from Gesing beach
The number of cohort is many, because in tropical country, the reproduction activity was year round. In order to develop age structure, length frequency should be developed into age group. In Figure 4, above, starting of curve, mid August, represent the birth time. Numbers of curves represent number of cohorts.
Figure 5. Growth curve with restructured data frequencyof shell length
Figure 5, shows the restructured frequency of shell length and has the same tren as
curve usually developed as bimodal as representative of dry and wet season. If we consider the season, as we have 2 seasons in a year, we understand that the age of
B. spirata most probably be five years.
Figure 4 and 5 shows the growth of each cohort. Detail of the growth rate can be seen in Table 1.Length at age was develop using von Bertallanffy Growth Formula. Input data was K value from Elefan analysis i.e. 0.27 and L∞55.65.L(t) was developed
using t input from 1 to 10 and growth rate could be counted and got.
Tabel 1. Growth rate of B. spirata from Gesing Beach
Age t
Shell length L(t), mm
Growth rate
∆L/∆t
Length Ḹ(t) mm
1 13.17 -
-2 23.22 10.05 18.195
3 30.89 7.67 27.05
4 36.75 5.86 33.82
5 41.22 4.47 38.99
6 44.64 3.42 42.93
7 47.24 2.6 45.94
8 49.23 1.99 48.24
9 50.75 1.52 49.99
10 51.91 1.16 51.33
Table 1 shows fast growth at early stage of life, it reaches13.17mm with in a season. Then, the growth was slowed down, and reaches stationer at size about 51.91 mm.Growth rate shows at collum three. At first season growth rate reaches 10.05 mm, then further decrease every season to 1.99 mm at the eighth season, and 1.16 mm at the tenth season. In the last three year the growth rate only 1-2 mm and continuously decrease and reach its minimum or no more growth. Within about five years, shell length of B. spirata reach its infinity, L∞was 55.65 mm (Elefan analysis). Elefan method’s beneficial to get growth parameter and trace yearly growth of cohort, at the time t using shell length.
3.4 Age composition estimation of B. spirata
Figure 6. Number of age composition from Bhattacharya analysis
Analysis shows several curves and its peaks of age group of B. spirata. Population
has been grouped into five (5) groups. Every peak represents one age group. Basically Bhattacharya method separates a number of normal distribution. As a first normal distribution has been achieved, it was removed from the group of total distribution. This procedures had been repeated several times until all population distributed (Sparre and Venema, 1998).
Tabel 2. Decomposition composite distribution using Bhattacharya Methods
Age group
(mm) S.D Populasi S.I
27.5 1.2 6.67 n.a
35.29 1.13 38.59 2.38
40.51 1.19 26.52 2.16
44.35 1.29 22.68 2.07
49.02 0.54 7.23 2.12
Annotation S.D.is standard deviasi, and S.I. is separation index.
Tabel 2. Shows five age-group using Bhattacharya. First cohort age group has an average of shell length of 27.5 mm. Then one after the other is, 35.29; 40.51; 44.35; respectively and on the fifth year became 49.02 mm. Every age-group with population percentage of 6.67; 38.59; 26.52; 22.68 respectively and finally 7.23 %. The youngest age group was so few, due to the size net.
Table 3. Monte Carlo simulation from shell length data of B. spirata
Age Frequency Mean L S.D of L
0 30 7.12 7.53
1 37 15.40 12.7
2 33 16.87 13.51
3 0 0 0
G-5
G-4
G-3
G-2
G-1
Figure 7. Age structure of B. spirata from Gesing Beach. G: age group
This age structure was disregard sex of organisms. The age structureform was also not ideal because the smallest age group was limited by the size of net of the trap. This has a positive effect for the population because it reserves young generation for the next future. This condition also categorized as normal situation, especially for invertebrate which its young age/larvae is in the form of plankton.
Figure 8 and 9 below show local trap for B. spirata. called bintur. Bait used was
“runcah” or defective fishes. As showed here, it is impossible to catch small snails using this trap. Again, this condition gave an opportunity for small snail to escape and gave them opportunity to get bigger and reproduce.
Figure 8. Trap (bintur) for B. spirata, square-form with opening in the middle, from Gesing Beach, Yogyakarta
4. CONCLUSION
Elefan analysis shows growth parameter K= 0.27, means that the growth was slow.
B.spirata growth from birth to adult needs 10 seasons or five years.L∞size was 55.65 mm. Bhattacharya analysis confirm that the number of age group were five. As a comparison Monte Carloanalysisshows that the number of age group was four.
5. REFERENCE
1. Altena, C.O. Van Regteren and Gittenberger, E. 1981. The Genus Babylonia
(Prosobranchia, Buccinidae) Monograph. Zoogilische Verhandelingen. 188.
2. Apritia and Agung, V. 2006. Kecenderungan Makan Keong Macan (Babylonia
spirata L.) Terhadap Umpan-umpan Alami. Program Studi Pemanfaatan Sumber Daya Perikanan dan Ilmu Kelautan. IPB. Bogor. http://repository.ipb.ac.id/handle/123456789/45946.
3. Andamari and Retno. 2009. Keong Macan (Babylonia spirata L, 1758) di
Perairan Cilacap.Prosiding Seminar Nasional Moluska 2. Moluska Peluang Bisnis dan Konservasi. Bogor, 11-12 Februari 2009.
4. Diniah. 2009. Pemanfaatan Sumber Daya Keong Macan Menggunakan Unit Penangkapan Bubu. Prosiding Seminar Nasional Moluska 2. Moluska Peluang Bisnis dan Konservasi. Bogor, 11-12 Februari 2009.
5. Pauly, D. 1984. Some simple methods for the assessment of tropical fish
stocks. FAO Fisheries Technical Paper 234. FAO UN, Rome.
6. Sparre, P. and Venema, S.C. 1998. Introduction to Tropical Fish Stock
Assessment Part 1: Manual. FAO, Rome.
7. Yulianda and Fredinan. 2009. Perkembangan Larva Keong (laut) Macan,
Babylonia spirata (Linnaeus 1758). Prosiding Seminar Nasional Moluska 2. Moluska Peluang Bisnis dan Konservasi. Departemen Manajemen Sumberdaya Perairan Fakultas Perikanan dan Ilmu Kelautan IPB. Bogor
8. Yulianda and Fredinan. 2007. Efisiensi Pakan Bagi Pertumbuhan Somatik dan
reproduksi Keong Macan (Babylonia spirata, L. 1758). Prosiding Seminar
Nasional. Moluska Dalam Penelitian, Konservasi dan Ekonomi. BRKP DKP RI bekerjasama dengan Jurusan Ilmu Kelautan, FPIK UNDIP. Semarang.
9. Zahida. 2014. Metode Penangkapan, Umpan serta Faktor-faktor yang
mempengaruhi Penangkapan Keong Macan Babylonia spirata L. 1758 di
The Effect of Nitrogen Excess in Medium on Carotenoid
and Chlorophyll Content of Chlorella Zofingiensis Donz
Culture
Eko Agus Suyono1,2, Umi Muavatun1, Faridatul Husna1, Husnul Khotimah1, Ika Pratiwi1, Rahmah Husna1, Fitri Cahyani1, Yuni Purwanti1, Thoriq Teja Samudra1
1
Faculty of Biology, Gadjah Mada University
Jl. Teknika Selatan, Sekip Utara, Yogyakarta, Indonesia 55281 2
Centre for Energy Studies, Gadjah Mada University Sekip K1A, Kampus UGM, Yogyakarta, Indonesia 55281
Email address: [email protected]
Abstract
Chlorella zofingiensis Donzis the prospective carotenoid producer. Under unfavorable condition, such as Nitrogen limitation, it has been reported that C.Zofingiensishas the ability to synthesize high amounts of carotenoids. However, the effect of nitrogen excess on the carotenoid production of the microalgae is not widely studied yet. Agriculture waste that is rich of nitrogen can be potentially used to enhance the carotenoid as well as the chlorophyll ofnthe microalgae. Therefore, this research aims to study the effect of nitrogen excess on the production of its carotenoids and chlorophylls. This research used medium consisted of commercial micronutrient fertilizer, urea and ZA with the ratio of 0.25: 0,5: 1 (low excessnitrogen medium)and0.5: 1: 2 (high excess nitrogen medium). The parameters measured were dry weight, chlorophyll a and b, and carotenoid. The dry weight was calculated by measuring the difference weight of the wet and dry samples. Both chlorophyll and carotenoid were measured using spectroscopy method. The highest carotenoids, chlorophyll a and b and dry weight were produced in the high nitrogen excess medium. They accounted for 0.5 mgL-1, 2 mgL-11.5 mgL-1and 80 mgL-1, respectively. Furthermore, the ratio of carotenoids and chlorophyll a and b to the dry weight on high excess nitrogen medium tend to increase.Therefore, the high nitrogen excess treatment was able to enhance carotenoid, chlorophyll a and b and dry weight of the microalgae.
1. INTRODUCTION
C.zofingiensis Dönz is freshwater green algae classified into classes Chlorophyceae, orders Chlorococcales and family Chlorellaceae (Pickett-Heaps, 1975). This algae is non-motile algae and unicellular. Its cell has spherical shape with a diameter from 2 m to 15 m. Chlorophyll a in C. zofingiensisis dominant so that the cell is green. This microalgae grows optimally at temperatures between 25 ° C-28 ° C and the salinity with a maximum of 5 ppt (Bold and Wyne, 1985). This microalgae is able to photosynthesize in order to produce organic carbon compounds (Richmond, 2004). Carotenoids are pigments that most commonly occur in nature and synthesized by all
largest carotenoidproducers. Algae carotenoids show the diversity of structures and about 100 different carotenoids been found in algae (Britton et al., 1995).
In algae, carotenoids play an important role in the process of photosynthesis with chlorophyll. Besides having the photosynthetic pigment chlorophyll, the green algae also have carotenoids as additional pigments. The main carotenoid own green algae including -carotene, lutein, violaxantin, anteraxantin, zeaxantin, and neoxantin (Burtin, 2003). Currently, microalgae have been used as substrates for biodiesel, pharmaceutical, dietary supplements, and natural feed in aquaculture (Aslull and Omar, 2012).
Corsini and Karidys (1990) states that nitrogen is an important part of the protein, protoplasm, chlorophyll and nucleic acids. Nitrogen is absorbed in the form of ammonium (NH4+) or nitrate (NO3). N deficiency will also limit growth because there
will be no formation of new protoplasm. Meanwhile, excessive nitrogen fertilization will result vegetative growth. Therefore. it is interesting to evaluate the effects of excess nitrogen on the chlorophyll and carotenoid of C. zofingiensis.
2. METHODS 2.1 Chemicals
This research used medium agricultural fertilizers: urea: ZA with a ratio of 0.25: 0,5: 1 (low excessnitrogen medium) and 0.5: 1: 2 (high excess nitrogen medium).
2.2 Procedures
The study was conducted in Wukir Sari, Cangkringan, Pakem, Sleman, Daerah
Istimewa Yogyakarta (DIY). C. zofingiensis was cultured on a mass scale in the 3600
liter pool. Environmental parameters measured were temperature, pH, and density.The mediums were local agricultural fertilizer (farmpion), urea and ZA with ratio of 0.25:0,5:1 (low excess nitrogen medium) and 0,5:1:2 (high excess nitrogen
medium). As a control, C. Zofingiensis was cultivated in medium with local
agricultural fertilizer (farmpion) without the addition of urea and ZA. Nitrogen contentin fertilizers and ZA were 21%, while thenitrogen contentin urea was 46%. Samples were taken every day for 7 days. The parameters measured werechlorophyll, dry weight, and carotenoid.
2.2.1 Chlorophyll Measurement
Chlorophyl a, b (ml/m3) =
2.2.2 Dry weight measurement
Calculation of dry weight by taking a 40 mL sample then adding 2 ml of 5% SDS-MSDO, centrifuging at a speed of 3300 rpm for 10 minutes. After the supernatant was taken and dried in an oven at a temperature of 30 ° C to constant weighed, it was measured its weighusing an analytical balance.
2.2.3 Carotenoid measurement
Samples were taken 10 mL inserted into the tube, then centrifuged at a speed of 3300 rpm for 15 minutes. Samples were spared the supernatant, and then added to 2 mL of acetone, then centrifuged again with a rate of1800 rpm for 10 minutes. The sample was transferred into a glass cuvette spectrophotometer then inserted and calculated absorbance at a wavelength of 470, 645 and 662 nm. Based on the absorbance of the spectrophotometer concentration of carotenoids was determined by using the following equation.
3. RESULT AND DISCUSSION
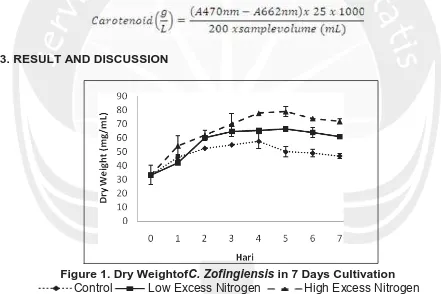
Figure 1. Dry WeightofC. Zofingiensis in 7 Days Cultivation
Control Low Excess Nitrogen High Excess Nitrogen
Figure 1. showed that the highest dry weight was obtained in the treatment of high excess nitrogen. This was due to the cells cultured in high nitrogen
content, the photosynthesis productwas more stored in the form of carbohydrates rather than used for asexual reproduction through fission
a b
Figure 2. (a) Chlorophyll aConcetration of C. zofingiensis (b) Chlorophyll b Concentration ofC. Zofingiensis in 7 Days Cultivation
Control Low Excess Nitrogen High Excess Nitrogen
According toMulders et al., (2014), if microalgae was cultured in medium with high
nitrogen content, the production of chlorophyll a and b would tend to increase.Similar to Guedes and Malcata (2012), a high nitrogen content that was 2- 3 times higher than normal concentration in the medium increased the synthesis of pigments in cells, especially chlorophyll. Zhu et al., (2014) stated that the increase in chlorophyll a and b were caused by the increased concentration of nitrogen in the medium. Similarly, indicated in figure 2, that the highest chlorophyll a and b were obtained at high treatment of excess nitrogen. Meanwhile, the content of chlorophyll a and b in all treatments tend to be the same (figure 3). Thus, the increase in chlorophyll a and b was followed by an increase in dry weight.
a b
a b
Figure 3. (a) Chlorophyll a Contentper Dry Weigth Content ofC. zofingiensisin 7 Days of Cultivation (b) Chlorophyll bContent per Dry Weigth ofC.
zofingiensisin 7 Days of Cultivation
a b
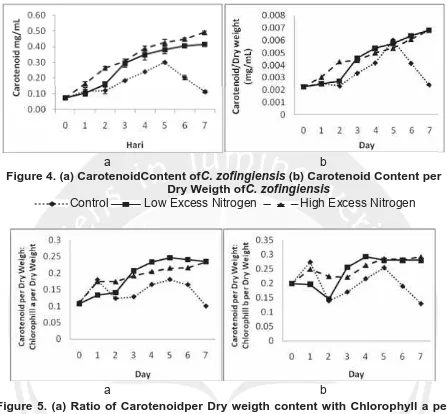
Figure 4. (a) CarotenoidContent ofC. zofingiensis (b) Carotenoid Content per Dry Weigth ofC. zofingiensis
Control Low Excess Nitrogen High Excess Nitrogen
a b
Figure 5. (a) Ratio of Carotenoidper Dry weigth content with Chlorophyll a per Dry weigth in C. zofingiensis (b) Ratio of Carotenoidper Dry weigth content with Chlorophyll b per Dry weigth in C. zofingiensis
Control Low Excess Nitrogen High Excess Nitrogen
In figure 4 and 5, showed that the carotenoid content tend to increase in conditions of low and high excess nitrogen. Similarly, the ratio of carotenoid content per dryweight
to chlorophyll a and b per dry weight. According Mulders et al., (2014), a high
nitrogen concentration increased the growth of cells as well as caused stress on the culture. Furthermore, increased cell growth culture under stress would also increase the synthesis of secondary metabolites for cell protection. Carotenoids are synthesized when the culture experiencing environmental stress including nitrogen stress (Wang et al., 2003).
4. CONCLUSIONS
increase. Therefore, the high nitrogen excess treatment was able to enhance carotenoid, chlorophyll a and b and dry weight of the microalgae.
5. REFERENCES
1. Pickett-Heaps, J.D. 1975. Green algae: structure, reproduction and evolution
inselected genera. Sinauer Associates. Pp.72.
2. Bold, H.C. and Wyne, M.J. 1985. Introduction to the algae: Structure and
reproduction. Englewood Cliffs, N.J. Pp. 662-706.
3. Vilchez, C., Forgan, E., Cuaresma, M., Bedmar, F., Garbayo, L. and Vega, J.M.
2011. Marine carotenoid: biological functions and commercial applications.
Marine Drugs, 9: 319-333.
4. Britton, G. 1995. Structure and properties of carotenoids in relation to function.The FASEB Journal,9 : 1551-1558.
5. Burtin, P. 2003. Nutritional value of seaweeds. The Electronic Journal of
Environmental, Agricultural, and Food Chemistry, 2: 498-503.
6. Alsull, M. and Omar, W.M.W. 2012. Responses of Tetraselmis sp. and Nannochloropsis sp. isolated from Penang National Park coastal waters, Malaysia, to the combined influences of salinity, light and nitrogen limitation.
International Conference on Chemical, Ecology and Environmental Sciences (ICEES 2012).
7. Corsini, N. and Karydis, M. 1990. An algal medium best and fertilizers and its
evaluation in mariculture.Journal Applied Phycology, 2:333-339.
8. Richmond, A. 2004. Handbook of Microalgal Culture : Biotechnology and
Applied Phycology. UK : Blackwell Science Ltd. Pp. 3, 105.
9. Jiménez, C. Cossío, B.R., Labella, D. and Xavier, N.F. 2003. The feasibility of
industrial production of Spirulina (Arthrospira) in southern Spain. Aquaculture,
217: 179-190.
10. Mulders, K.J.M., Jorijin, H.J., Dirk, E.M., Rene, H.W. and Packo, P.L. 2014. Effect of Biomass Concentration on Secondary Carotenoids and Triacylglycerol
(TAG) 6. Pp. 8-16Accumulation in Nitrogen-Depleted Chlorella zofingiensis.
Algal Research, 6: 8-16.
11. Guedes, A.C. and Malcata, F.X. 2012. Nutritional Value and Uses of Microalgal in Aquaculture. Aquaculture, 4: 61-78.
12. Zhu, S., Yajie, W., Wei, H., Jin, X., Zhongming, W., Jingliang, X. and Zhenghong, Y. 2014. Enhanced Accumulation of Carbohydrate and Strach in
Chlorellazofingiensis Induced by Nitrogen Starvation. Applied Biochemistry and Biotechnology, 174: 2435-2445.
13. Wang, B., Zarka, A., Trebst, A. and Boussiba, S. 2003. Astaxantin Accumulation in Haematococcus pluvialis (Chlorophyceae) as an Active Photoprotective
Enzymatic Modification of Chicken Feathers Waste As
Livestock Feed Rich in Nutrients
Ditya Lasarati1, *Maharani Pertiwi Koentjoro2, and Endry Nugroho Prasetyo1 1
Biotechnology Laboratory, Department of Biology, Institut Teknologi Sepuluh Nopember, Gedung H 1stfloor, Kampus ITS Keputih Sukolilo Surabaya, 60111 Indonesia 2
Laboratory of Environmental Microbiology, Department of Biological and Environmental Science, Faculty of Agriculture - Shizuoka University & Structural Biology Research Center,
Inter-University Research Institute Corporation - High Energy Accelerator Research Organization (KEK), Tsukuba-Ibaraki, Japan
*Corresponding author email address: [email protected]
Abstract
Feathers is organic waste consists of 90% keratin protein structure that link by disulfide and hydrogen bonds. Structures and linkages of keratin make feathers waste unsoluble in the water and very difficult to degrade. The alternative and innovative solution to overcome abundant of feathers waste is by the utilization of keratinolytic microorganism capable of producing keratinase and degrade keratin become amino acids and peptides. Chicken feathers waste containing high keratin protein has the potential to be used as an alternative sources of protein and can be applied in the manufacture of animal feed. This research aimed at utilization of chicken feather waste that are modified enzymatically by keratinase to produce water soluble protein and converted into alternative protein source in livestock feed that are
cheap and rich in nutrients. Keratinase produced by Bacillus sp. SLII-I through
fermentation using FM media. Keratinase isolated by centrifugation method then activity and protein content of keratinase is measured. This researched reported that
Bacillus sp. SLII-I capable of producing crude keratinase with 2.08 (mg/second)/ ml enzyme activity that can increase water soluble protein level of feathers waste until
22.06%. Broiler chicken (Gallus domesticus) that consumed feed containing 5%
feather meal indicated production performance of 1194.8 gram/head of feed consumption, 567 gram/head of addition of weight, and 2.1 of feed conversion ratio. An enzymatic engineered chicken feathers waste showed the performance of broiler chicken that is better than soybean meal as conventional sources of protein but could not yet substitute the use of conventional protein sources of fishmeal.
Keywords: Bacillus sp. SLII-I, Keratinase, Keratin, Feed, Broiler chicken.
1. INTRODUCTION
Chicken feathers is organic waste that generated in bulk quantities as a by-product in poultry industry. In general, each bird has up to 125 gram of feather (Lakshmi et al.,, 2013) that represent 5-7% of the total weight of mature chickens (Matikevičienė et
al., 2009). Meanwhile, more than 400 million chicken being processed every week
worldwide (Lakshmi et al., 2013) so that the accumulation of feather waste reaches
water resources (Cai et al., 2008; Matikevičienė et al., 2009) and feather protein wastage (Cai et al., 2008).
Chicken feathers are high protein resource consist of 90% keratin (Matikevičienė et al., 2009; Cai et al., 2008). keratin protein that have α-helix (α-keratin) or -sheet ( -keratin) structure link by disulfide and hydrogen bonds (Riffel and Brandelli, 2006; Mazotto et al., 2011). The structures fold and form complex structures (Kreplak et al., 2004). Structures and linkages of keratin make keratin have high mechanical stability
(Mazotto et al., 2011) and resistance to degradation by common proteolytic enzymes
such as trypsin, papain, and pepsin (Mousavi et al., 2013).
Feathers waste is poorly recycled in nature and has limited utility due to the
chemically unreactive nature of keratin (Lakshmi et al., 2013). Despite the rigid
structure of keratin, it can be degraded by mechanical, chemical, and biological
methods (Mousavi et al., 2013). The major drawback of mechanical and chemical
degradation methods is requires great input energy, give rise to environmental problems, and are destructive to certain amino acids such as methionine, lysine and tryptophan and also in the formation of non-nutritive amino acids such as
lysinoalanine and lanthionine (Marcondes et al., 2008) that leads to low protein
quality and digestibility (Zerdani et al., 2004) so the feathers waste that converted into feed supplement conventionally resulting in feed of poor quality which is nonviable economically (Acda, 2010).
The alternative and innovative solution to overcome abundant of feathers waste is by the utilization of keratinolytic microorganism capable of producing keratinase. Keratinase belongs to hydrolase group that capable of hydrolyze keratin more
efficient compared to other protease (Vigneshwaran et al., 2010; Kanmani et al.,
2011). Keratinase attack disulfide bonds to degrade keratin (Agrahari, 2013). Biodegradation of keratin using keratinase produce peptide and rare amino acids such as serine, cysteine and proline (Mousavi et al., 2013) and essential amino acids such as threonine, valine, methionine, isoleucine, leucine, lysine, histidine and tyrosine (Ali et al., 2011). Chicken feathers waste containing high keratin protein has the potential to be used as an alternative sources of protein and can be applied in the manufacture of animal feed (Sastry et al., 1986) that are cheap and rich in nutrients (Balaji et al., 2008; Khardenavis et al., 2009). Hence, this research conduct to utilize chicken feather waste that are modified enzymatically by keratinase that are produced by Bacillus sp. SLII-I and then converted into alternative protein source in broiler chicken (G. domesticus) livestock feed.
2. METHODS
2.1 Keratinase Production and Isolation
Bacillus sp. SLII-I (10%) inoculated in feather meal broth and feather meal media to make it adjust to feathers as carbon source. The flasks were incubated at room
temperature for 24 hours at 110 rpm. Keratinase produced by Bacillus sp. SLII-I
through fermentation using feather meal media (FM) containing 0.5 g/L NaCl, 0.3 g/L K2HPO4, 0.4 g/L KH2PO4and 10 g/L of feather meal. Then, keratinase isolated when
2.2 Keratinase Activity
The keratinase activity was assayed as follows: 1.0 gram keratin properly diluted in 160 ml phosphate buffet (50mM, pH 7.0-7.2) was incubated with 0.16 ml keratinase enzyme at 50 °C in waterbath for 2 hours. The reaction is stopped by cooling the solution. Then, solution was filtered through Whatman No.1. Obtained filtrate containing water soluble protein that was determined based on Bradford method (1967). Keratinase activity in this research was defined as the ability of keratinase hydrolyze keratin into 1 mg water soluble protein every second compared to the control and calculated by the following equation:
Keratinase Activity ((mg/second)/ml)= (∆DP⁄T)/V × DF Where:
∆DP = Total water soluble protein compared to the control (mg) T = Incubation time (second)
V = Keratinase volume (ml) DF = Dilution factor
2.3 Protein Determination
Protein content was analyzed using Bradford method with bovine serum albumin as standard protein (Bradford, 1967). Readings were carried out in a spectrophotometer at 595 nm.
2.4 Enzymatic Modification of Chicken Feathers Waste
Enzymatic modification of chicken feather was done by means of reaction between feathers and keratinase directly. One gram feather meal properly diluted in 160 ml phosphate buffet (50mM, pH 7.0-7.2) was incubated with keratinase enzyme (0.04 ml, 0.08 ml, 0.12 ml, 0.16 ml, and 0.20 ml) at 50 °C in waterbath for 2 hours. The reaction is stopped by cooling the solution. Then, solution was filtered through Whatman No.1. Obtained filtrate containing water soluble protein that was determined based on Bradford method (1967). An enzymatic engineered feathers waste which have the highest increase level of water soluble protein converted into alternative source of protein.
Conversion of feathers into feed was done using Poovendran et al., (2011). The flask containing solution of feather meal, phosphate buffer, and enzyme after incubated, were taken out and boiled. Simmering continued until all of the liquid was vaporized and a dry powder was left is feather meal that used as an alternative sources of protein in livestock feed.
2.3 Experimental Diets and Management of Animals
A total of 30 broiler chickens (DOC/ Day Old Chick) were provided by the local broiler hatchery and were used in this research. Broiler chickens were brooded for 6 days on crumbled standard commercial starter that were provided ad libitum with water
and food supplement. On the 7th day, chicken were weighed and randomly allocate
pens. The chickens were placed in pens with 5 chickens in each pen.
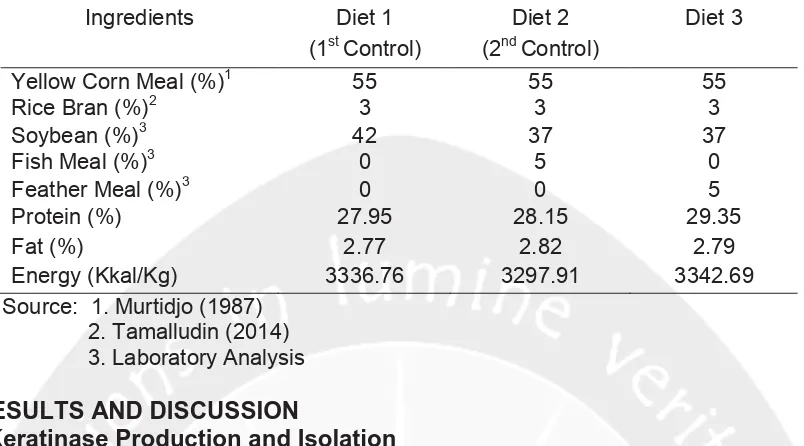
Table 1. The Composition of Experiment Diets for Broiler Chicken
Ingredients Diet 1 (1stControl)
Diet 2 (2ndControl)
Diet 3
Yellow Corn Meal (%)1 55 55 55
Rice Bran (%)2 3 3 3
Soybean (%)3 42 37 37
Fish Meal (%)3 0 5 0
Feather Meal (%)3 0 0 5
Protein (%) 27.95 28.15 29.35
Fat (%) 2.77 2.82 2.79
Energy (Kkal/Kg) 3336.76 3297.91 3342.69
Source: 1. Murtidjo (1987) 2. Tamalludin (2014) 3. Laboratory Analysis
3. RESULTS AND DISCUSSION
3.1 Keratinase Production and Isolation
Keratinase produced by Bacillus sp. SLII-I through fermentation using feather meal
media (FM) containing feather as carbon source in the form of keratin. Fermentation by Bacillus sp. SLII-I on FM media show the change visually (Figure 1) on texture of feathers becomes soft as a result of the hydrolysis of protein (Deliani, 2008) and color of white feathers become yellowish after 24 hours incubation as a consequence of the browning reaction caused by activity of bacteria producing oxidize enzyme (Winarno, 2002). Fermentation of chicken feather is also causing unique smell as a result of protein degradation that can produce peptone, amino acids, and components may inflict foul odor like NH3 and H2S (Deliani, 2008).
Figure 1. Fermentation of Chicken Feathers by Bacillus sp. SLII-I in FM media A: Chicken Feather Without Fermentation; B: Chicken Feathers After 24 h
Fermentation
Keratinase isolation was done after fermentation. Growth curve of Bacillus sp. SLII-I was necessary to know the right time for isolating keratinase. Figure 2 show the
highest keratinase production happened on 14th hours when culture has entered
stationary phase and keratinase accumulating maximally in media (Anitha and Eswari, 2012). The growth of Bacillus sp. SLII-I in stationary phase due to activating
of Bacillus sp. SLII-I. Keratinase isolated when culture in early stationer stage by centrifugation method at 3500 rpm for 30 minutes. The supernatant was collected for keratinase activity and protein determination.
Figure 2. Growth Curve of Bacillus sp. SLII-I in FM Media for Keratinase Production
3.2 Keratinase Activity and Protein Determination
Keratinase activity and protein determination is necessary to confirm that enzyme produced in the process of fermentation and isolation is keratinase. Bacillus sp. SLII-I is capable of producing enzyme with 2.08 (mg/second)/ml keratinase activity and 6.6 mg/ml protein content. This means that enzyme produced by the Bacillus sp. SLII-I is keratinase. Keratinase belongs to hydrolyses group that capable of hydrolyze keratin
more efficient compared to other protease (Vigneshwaran et al., 2010; Kanmani et
al., 2011). The hydrolysis of keratin by keratinase produced amino acids and peptide (Mousavi et al., 2013) that soluble in water.
3.3 Water Soluble Protein of Enzymatic Engineered Chicken Feathers Waste
Keratin protein in chicken feathers are insoluble in water and have low digestibility (Joshie et al., 2007). Keratinase had a role in hydrolyze keratin via termination of
hydrogen and disulfide bonds to produce amino acids and peptides (Mousavi et al.,
Figure 3. Increase Level of Water Soluble Protein of Enzymatic Engineered Chicken Feathers Waste
3.4 Performance of Broiler Chicken
Table 2 show that difference protein source in diets had a considerable influence (P<0.05) to the performance of Broiler chicken (G. domesticus). Broiler chicken (G. domesticus) that consumed feed contain fishmeal protein source give the highest production performance than broiler chicken that consumed feed contain only soybean meal and feather meal. It was because of feed contain fishmeal have higher energy-protein level than feed contain only soybean meal. Pesti (2009) states that feed utilization efficiency depend on dietary protein and the energy level. Feed with high energy and protein content is more efficient to produce growth than feed with low energy and protein content (Tamalludin, 2014). Feed contain hydrolysate feather meal show higher value of feed consumption and addition of weight than feed contain soybean meal protein but not as good as fishmeal. It was because of low digestibility of feather meal than fish meal. Although, feed contain feather meal have the highest energy and protein value (Table 1).
Table 2. Performance of Broiler Chicken (G. domesticus)
Diet Feed Consumption (gram /head)
Addition of Weight (gram/head)
Feed Conversion Ratio Diet 1
1stControl (Soybean Meal)
983.6A 232.6A 4.27B
Diet 2 2ndControl (Fish Meal)
2244.3C 1203.0C 1.86A
Diet 3 (Feather Meal)
1194.8B 567.0B 2.11A
The difference of feed intake of broiler chicken (G. domesticus) is affected by the balance of nutrient content in feed. Fish meal contain high essential amino acids of lysine and methionine (Rahman, 2002) while soybean meal have low methionine amino acid (Ketaren, 2008). Feather meal is rich in leucine, isoleucine, and valin amino acids but low in methionine and tryptophan (Ketaren, 2008). Fish meal have better quality of protein and balance amino acids than soybean meal and feather meal so it gives high feed intake followed by high body gain weight resulting in feed conversion ratio that meet standard. The declining of protein content and deficiency
in essential amino acids (Burman dan Burgess, 1986; Trisiwi et al., 2004; Ketaren,
2008) had harmful consequences for growth and lowered feed intake (Grazziotin, 2008; Waldroup et al., 2012)
However, feather protein is considered an excellent source of metabolizable protein (Wang and Parsons, 1997). Despite the limited nutritional value of keratin, both the digestibility and amino acids of feather protein might be improved by enzymatic modification of keratin by keratinase. This research indicated that protein hydrolysate of feather meal could substitute about 5% of soybean meal protein and showed the performance of broiler chicken that is better than soybean meal conventional sources of protein. But, feather meal could not yet substitute fish meal although showed comparable feed conversion ratio value (P>0.05) with fish meal. This problem can be resolved with the utilization of soybean meal, fish meal, and feather meal resulting to good quality of protein and balanced amino acids in livestock feed.
4. CONCLUSIONS
Bacillus sp. SLII-I is capable of producing keratinase with 2.08 (mg/second)/ml keratinase activity and 6.6 mg/ml protein content that can increase water soluble protein level of feathers waste until 22.06%. An enzymatic engineered chicken feathers waste could substitute about 5% of soybean meal protein and showed the performance of broiler chicken that is better than soybean meal conventional sources of protein but could not yet substitute the use of conventional protein sources of fishmeal.
5. ACKNOWLEDGEMENT
The authors are grateful for the academic grant provided by Biomaterial and Enzyme Technology Research Team (2014/2015) supervised by Dr. techn. Endry Nugroho Prasetyo, MT. in which the study was conducted. Special thanks are also given to father Tjahjo Harsojo and mother Theresia Puspita for the motivation, support and prayers; to family of Scylla serrata 2011 and Biomaterial and Enzyme Research Team (2014/2015) for the motivation, support and assistance during the study.
6. REFERENCES
1. Acda, M.N. 2010. Waste chicken feather as reinforcement in cementbonded composites. Philippine Journal of Science, 139: 161-166.
2. Agrahari, S. 2013. Production of Extracellular Keratinase Enzymes From
Bacillus Pumilis Sn3 Isolated From Soil Sample Of Ghazipur Poultry Waste Site.
3. Ali, T.H., Nadia, H.A. and Latifa, A.M. 2011. Production, Purification and Some Properties of Extracellular Keratinase from Feathers-Degradation by Aspergillus
oryzae NRRL-447. Journal of Applied Sciences in Environmental Sanitation, 6:
123-136.
4. Anitha, A. and Eswari, R. 2012. Impact of Newly Isolated Bacillus megaterium
(A1) on Degradation of Feather Waste. International Journal of Pharma and Bio
Sciences, 1: 212-221.
5. Balaji, S., Kumar, M.S. and Karthikeyan, R. 2008. Purification and Characterization of An Extracellular Keratinase from A Hornmeal-Degrading
Bacillus subtilis MTCC (9102). World Journal of Microbiology and Biotechnology, 24: 2741-2745.
6. Bradford, M.M. 1976. A Rapid and Sensitive Methods for the quantitation of Microgram Quantities of Protein Utilizing the Principle of Protein-Dye Binding.
Analytical Biochemistry, 72: 248-254.
7. Burman, K.N. and Burgess, A.D. 1986. Responses to Amino Acid. Nutrient Requirements of poultry and Nutritional Research. Poultry Sci. Symposium Kent TN 15.
8. Cai, C.G., Lou, B.G. and Zheng, X.D. 2008. Keratinase production and keratin
degradation by a mutant strain of Bacillus subtilis. J Zhejiang Univ Sci., B. 9: 60-67.
9. Deliani. 2008. Pengaruh Lama Fermentasi Terhadap Kadar Protein, Lemak,
Komposisi Asam Lemak dan Asam Fitat Pada Pembuatan Tempe. Tesis. Medan: Universitas Sumatera Utara.
10. Gaman, P.M. and Sherrington, K.B. 1992. Pengantar Ilmu Pangan, Nutrisi, dan
Mikrobiologi. Gadjah Mada University Press. Yogyakarta.
11. Grazziotin, A., Pimentel, F.A., De Jong, E.V. and Brandelli, A. Poultry feather hydrolysate as a protein source for growing rats. Braz. J. vet. Res. anim. Sci.,
45: 61-67.
12. Han, M., Luo, W., Gu, Q. and Yu, X. 2012. Isolation and Characterization Of A Keratinolytic Protease From A Feather-Degrading Bacterium Pseudomonas Aeruginosa C11. African Journal of Microbiology Research, 6: 2211-2221.
13. Joshi, S.G., Tejashwini, M.M., Revati, N., Sridevi, R. and Roma, D. 2007. Isolation, Identification and Characterization of a feather degrading bacterium.
International journal of poultry science,6: 689-693.
14. Kanmani, P., Karuppasamy, P., Pothiraj, C. and Venkatesan, A. 2011. Studies On Lignocellulose Biodegradation of Coir Waste in Solid State Fermentation
Using Phanerocheate chrysosporium and Rhizopus stolonifer. African Journal of
Biotechnology, 8: 6880-6887.
15. Ketaren and Nurjama’yah. 2008. Pemanfaatan limbah bulu ayam sebagai
sumber protein ayam pedaging dalam pengelolaan lingkungan hidup. Tesis. Medan: Universitas Sumatera Utara.
16. Khardenavis, A.A., Kapley, A. and Purohit, H.J. 2009. Processing of poultry feathers by alkaline keratin hydrolyzing enzyme from Serratia sp. HPC 1383.
Waste Management, 29: 1409-1415.
18. Laskhmi, P.J., Chitturi, Ch. M.K. and Lakshmi, V.V. 2013. Efficient Degradation
of Feather by Keratinase Producing Bacillus sp. International Journal of
Microbiology. Volume 2013, Article ID 608321, 7 pages.
19. Lee, C.G., Ferket, P.R. and Shih, J.C.H. 1991. Improvement of feather digestibility by bacterial keratinase as a feed additive. FASEB J., 59: 1312
20. Marcondes, N.R., Taira, C.L., Vandresen, D.C., Svidzinski, T.I.E., Kadowaki,
M.K. and Peralta, R.M. 2008. New featherdegrading filamentous fungi. Microbial
Ecology, 56: 13-17.
21. Matikevičienė, V., Masiliūnienė, D. and Grigiškis, S. 2009. Degradation Of Keratin Containing Wastes By Bacteria With Keratinolytic Activity. Proceedings of the 7th International Scientific and Practical Conference. Rēzeknes Augstskola, Rēzekne, RA Izdevniecība.
22. Mazotto, A.M., Coelho, R.R.R., Cedrola, S.M.L., de Lima, M.F., Couri, S., de
Souza, E.P. and Vemelho, A.B. 2011. Keratinase Production by Three Bacillus
spp. Using Feather Meal and Whole Feather as Substrate in a Submerged
Fermentation. Enzyme Research. Volume 2011, Article ID 523780.
23. Mousavi, S., Salouti, M., Shapoury, R. and Heidari, Z. 2013. Research Article:
Optimization of Keratinase Production for Feather Degradation by Bacillus
subtilis. Jundishapur J Microbiol. October 6: 7160.
24. Murtidjo and Bambang, A. 1987. Pedoman Meramu Pakan Unggas.
Yogyakarta: Kanisius.
25. Pesti, G.M. 2009. Impact of Dietary Amino Acid and Crude Protein Level in
Broiler Feeds on Biological Performance. Journal of Applied Poultry Research,
18: 477-486.
26. Rahman, N. 2002. Pemanfaatan Hidrolisat Protein Bulu Ayam sebagai
Konstituen Formula Pakan Ayam Pedaging Masa Finisher. Tesis. Malang: Universitas Brawijaya.
27. Riffel, A. and Brandelli, A. 2006. Keratinolityc Bacteria Isolated From Feather Waste. Brazilian Journal of Microbiology, 37: 395-399.
28. Sastry, T.P., Sehgal, P.K., Gupta, B. and Mahendra, K. 1986. Solublised keratins as a Novel filler in the retaining of upper leather. Leather Science, 33: 345-359.
29. Tamalludin, F. 2014. Ayam Broiler. Jakarta: Penebar Swadaya.
30. Trisiwi, H.F., Zuprizal and Supadmo. 2004. Pengaruh Level Protein dengan Koreksi Asam Amino Esensial dalam pakan terhadap Penampilan dan Nitrogen
Ekskreta Ayam Kampung. Buletin Peternakan, 28: 131-141.
31. Vigneshwaran, C., Shanmugam, S. and Sathish, K.T. 2010. Screening and
Characterization of Keratinase from Bacillus licheniformis Isolated from
Namakkal Poultry Farm.
32. Waldroup, P.W., Jiang, Q. and Fritts, C.A. 2005. Effects ofglycine and thereonine supplementation on performance of broiler chicks fed diets low in crude protein. International Journal of Poultry Science, 4: 250-257.
33. Wang, X. and Parsons, C.M. Effect of processing system on protein quality of feather meals and hog hair meals. Poultry Science, 76: 491-496.
34. Winarno, F.G. 1992. Kimia Pangan dan Gizi. Jakarta: Gramedia.
Detection of Bovine Viral Diarrhea Virus for Identification of
Persistently Infected Animal in Dairy Cattle Herds
*P. Anika1, R. Wasito2 and H. Wuryastuti2 1
Departement of Inter University Center, Faculty of Biotechnology, University of Gadjah Mada, Jogjakarta, Indonesia
2
Departement of Pathology, Faculty of Veterinary Medicine, University of Gadjah Mada, Jogjakarta, Indonesia
3
Departement of Internal Medicine, Faculty of Veterinary Medicine, University of Gadjah Mada, Jogjakarta, Indonesia
Abstract
Bovine viral diarrhea disease (BVD) is an infectious diseases caused by BVD virus that affects economic loss worldwide due to abortion and infertility. Most of the BVD eradication programs are focus on finding persistently infected animal because it can shed large amount of virus in secretions and excretions throughout its lifetime and are primary route of virus transmission. This research objectives were:1) To detect the presence of BVD virus in dairy cattle herds in East Java, Jogjakarta and Central Java and 2) To identify the occurance of persistently BVDV infection among the herds. For the first screening, 87 serum samples from unvaccinated cows in East Java, Yogyakarta and Central Java that had reproductive problems historically were tested by ELISA antibody-BVDV. Results showed that of the 87 samples, 65 positive, 20 negative, and 2 suspected. Seronegative samples were further tested by RT-PCR
to find the BVDV antigens followed by ACE method to detect protein Erns as spesific
protein abundantly produced by PI animal. Based on RT-PCR test results, from 22 seronegative samples, 11 were negative and 11 were positive BVDV. However, only 10 out of the 11 samples were coming from PI animals. Based on the results, it can be detected and identified persistent BVDV infection in a group of dairy cows in East Java, Yogyakarta and Central Java.
1. INTRODUCTION
Bovine viral diarrhea virus (BVDV) has spread throughout the world and resulted in economic losses. The disease is endemic in most of the cattle population in the world
(Radostits et al., 2000). Clinical symptoms caused by BVDV disease varies greatly
ranging from mild clinical symptoms such as mild fever and leukopenia to clinically fatal such as abortion, stillbirth, congenital defects, weak calves, stunted growth, and mummification (Baker, 1987).
BVDV during the first trimester of pregnancy. This calf will act as a virus factory which will produce and spread the virus continuously throughout his life (Meyling et al.,, 1990). The presence of PI animals in a population characterized by a high prevalence of seropositivity (> 90 %) (Houe and Meyling, 1991).
Accurate and effective diagnosis are required for the detection of PI animals. Several diagnostic methods that have been used for detecting the BVD are virus titration, serum neutralization test, ELISA, immunohistochemistry (IHC), virus isolation, RT-PCR and quantitative RT-RT-PCR. The type of the method selected were based on the type of sample collected such as blood, milk, saliva, follicular fluid, tissues, ear notches, nasal swabs and serum (Lanyon et al., 2014). According to Saliki et al.,. (2000), specific and sensitive diagnostic methods for detecting the PI animals were virus isolation, IHC, RT-PCR and ELISA Ag. In this study, the methods used for detecting the PI animals were total antibody ELISA, RT-PCR and, antigen capture ELISA (ACE). This research objectives were:1) To detect the presence of BVD virus in dairy cattle herds in East Java, Yogyakarta and Central Java and 2) To identify the occurance of persistently BVDV infection among the herds.
2. METHODS 2.1 Chemicals
Eighty-seven blood samples were collected from cattle that historically have never been vaccinated against BVDV and have experienced of having reproductive disorders were used in this study. The cows were coming from several locations such as Central Java, Yogyakarta and East Java. Other chemical used include ammoniumchloride 0.85% (w/v), Tris 0.2% (w/v) pH 8.0, a solution of phosphate buffered saline (PBS), lysis buffer solution, ELISA kits (for BVDV antibodies and BVDV antigen), RNA isolation kit, One-Step RT-PCR (Invitrogen) kit, chloroform (1:1), and a DNA marker.
2.2 Procedures
Blood is collected aseptically in lavender tube, kept into a cooler and sent to the lab ± 1 day later. Blood samples were then centrifuged at 2000 rpm for 20 min for serum collection. Subsequently, the samples were tested using the antibody ELISA kits commercially available. Seronegative samples were then tested by RT-PCR. Isolated RNA were synthesized to cDNA using One-Step RT-PCR (Invitrogen) kit with a total volume of reaction was 25 L each tube. The composition of the reaction were as
follows : RT - Mix 12.5 mL, RT - Taq enzyme 0.5 mL, MgSO41 L, template RNA of
2.5 mL ( 10 ng ), 1 L forward primer (10 pmol), reverse primer 1 L (10 pmol).
3. RESULTS AND DISCUSSION
In this study, first step screening for detecting the BVDV infection in a dairy cows herds were done serologically using ELISA antibody techniques against BVDV.
According to Tan et al., (2006), in the group of cows that were not vaccinated,
serologic testing is a convenient method to determine the prevalence of the disease. Furthermore, the serological cases were considered to have been the result of a natural infection. Results showed that BVDV infection were occured in 65 out of 87 total samples tested (Swasthikawati, 2015). Twenty-two seronegative samples were further tested by RT-PCR using specific primers that amplify the gene 5'-UTR BVDV. Of the total 22 samples tested, 11 samples showed a positive result (Figure 1).
Table 1. Test result of ELISA antibody anti-BVDV, RT-PCR and ACE
Test Negative Positive Suspected
ELISA antibodyanti-BVDV* 20 of 87 65 of 87 2 of 87
RT-PCR 11 of 22 11 of 22 0 of 22
Antigen Capture ELISA (ACE) 1 of 11 10 of 11 0 of 11 * Swasthikawati (2015)
Figure 1. The results of RT - PCR ( 288 bp ) after running on a 1.5 % agarose gel. 1 : negative control BVDV ( dH2O ); 2 : 100 bp DNA marker; 3 :
BVDV positive control; 4 - 7 : BVDV positive field samples
Initial screening showed that the rate of BVDV prevalence in dairy cows was 74.71 % with OD values > 0.7. According to Lanyon et al., (2014), Brownlie et al., (2000)
and Houe et al., (1995) high titer antibodies to BVDV and high prevalence rates