HYPERSPECTRAL DATA FOR LAND USE / LAND COVER CLASSIFICATION
Divya Vijayan V a, *, G Ravi Shankar, T Ravi shankar
a
National Remote Sensing Centre, Balanagar, Hyderabad, 500037 (divya_v, ravishankar_g, ravishankar_t)@nrsc.gov.in
KEY WORDS: Hyperion, Spectral Angle Mapper, Red Edge Inflection Point
ABSTRACT:
An attempt has been made to compare the multispectral Resourcesat-2 LISS III and Hyperion image for the selected area at sub class level classes of major land use/ land cover. On-screen interpretation of LISS III (resolution 23.5 m) was compared with Spectral Angle Mapping (SAM) classification of Hyperion (resolution 30m). Results of the preliminary interpretation of both images showed that features like fallow, built up and wasteland classes in Hyperion image are clearer than LISS-III and Hyperion is comparable with any high resolution data. Even canopy types of vegetation classes, aquatic vegetation and aquatic systems are distinct in Hyperion data. Accuracy assessment of SAM classification of Hyperion compared with the common classification systems followed for LISS III there was no much significant difference between the two. However, more number of vegetation classes could be classified in SAM. There is a misinterpretation of built up and fallow classes in SAM. The advantages of Hyperion over visual interpretation are the differentiation of the type of crop canopy and also crop stage could be confirmed with the spectral signature. The Red edge phenomenon was found for different canopy type of the study area and it clearly differentiated the stage of vegetation, which was verified with high resolution image. Hyperion image for a specific area is on par with high resolution data along with LISS III data.
* Corresponding author at: National Remote Sensing Centre. Hyderabad Tel: 04023884278
E-mail: [email protected].
1. INTRODUCTION
Hyperspectral remote sensing are characterised by imaging and spectroscopic property, which differentiates the terrestrial features into unique spectral signature. This property is valuable in evidently classifying land use / cover features especially vegetation and water bodies. A major limitation of broadband remote sensing products is that they use average spectral information over broadband widths resulting in loss of critical information available in specific narrow bands. Thus the advent of hyper spectral remote sensing with continuous narrow band information opens the possibility of identifying even the species level discrimination in vegetation studies. Recent developments in hyperspectral remote sensing or imaging spectrometry have provided additional bands within the visible, near infrared (NIR) and shortwave infrared (SWIR) region of the electromagnetic spectrum. Most hyperspectral sensors acquire radiance information in less than 10 nm bandwidths from the visible to the SWIR (400-2500 nm). Hyper spectral remote sensing by virtue of its contiguity and narrow bandwidth is increasingly used to characterize, model, classify, and map agricultural crops and natural vegetation. Schmidt and Skidmore, 2002 attempted hyperspectral studies at the herbaceous and grassland level and showed that 27 saltmarsh vegetations could be discriminated. Hyper spectral applications for vegetation studies (Schlerf, 2011) introduced the red edge phenomenon and red edge inflection point (REIP), which is correlated to the chlorophyll content in the canopy. Hyperspectral remote sensing in vegetation studies include species composition, vegetation or crop type biophysical properties, biochemical properties disease and stress studies, nutrients, moisture, light use efficiency and net primary productivity (Thenkabail, 2012). Hyperion hyperspectral imagery over a given region, when combined with either SVMs
or ANNs to classifiers, can potentially enable a wider approach in land use/cover mapping (Petropoulos et al., 2012). An attempt has been made to compare the multispectral LISS III and Hyperion image at sub class level classification of major land use/ land cover features to understand the potential use of hyperspectral data in Land use study
2. MATERIALS AND METHOD
2.1 Study area
The Study area covers a strip of hyperion image with 210 39'12.81" to 23031' 49" N latitude and 72042' 05.50" and 730 07' 04.51"E longitude and covers area of Anand and Valsad in Gujarat in western India.
Figure 1. Location of study area The International Archives of the Photogrammetry, Remote Sensing and Spatial Information Sciences, Volume XL-8, 2014
2.2 Data used
Hyperion data of EO-1 used in the present study was acquired over out test site on March 16th, 2013 from the United States Geological Survey (USGS) archive. The imagery was received as a full long scene (185-km strip) and at level 1 (L1GST) processing level in GeoTIFF format, stored in 16-bit signed integer radiance values. Hyperion acquired over 400-2500 nm in 220 narrow-bands each of 10-nm wide bands. Of these there are 196 bands that are calibrated. Which includes bands 8 (427.55 nm) to 57 (925.85 nm) in the visible and near-infrared and bands 79 (932.72 nm) to band 224 (2395.53 nm) in the short wave infrared. Hyperion bands in noise region were dropped and 153 useful bands remained for the study.
For comparative evaluation, multispectral Resourcesat 2 LISS III data with a spatial resolution of 23m has been used. Also world view data acquired on February 13th 2013 has been used to supplement and improve the classification.
2.3 Methods
The L1G of hyperion data product is radiometrically corrected, geometrically resampled, and registered to a geographic map projection with elevation correction applied.
The data 16-bit and format HDF (Hierarchical Data Format) and converted toBand Interleaved by Pixel (BIP) or Band Interleaved by Line (BIL)
The image was subset to remove uncalibrated bands and the bad lines were removed.
Area of interest was extracted from the subset image
Atmospheric correction for the data has been done using FLAASH (Fast Atmospheric Analyst Line of the Spectral Hypercube) - For atmospheric correction, where the radiance will be converted to reflectance.
The parameters adopted for the implementation of atmospheric correction were: sensor altitude: 705 km (above sea level). mean elevation of the image area 0.6 km (kilometers above the sea), pixel size 30m; atmospheric model "Mid-Latitude Summer"aerosol model - rural scattering algorithm MODTRAN– ISAACS
Spectral and spatial using genetic algorithm and geometry diffusion respectively using minimum noise fraction has been used for dimensionality reduction.
Spectral Angle Mapper (SAM) was used for comparing the angles between the reflectance spectrum of the classified and the reference spectrum obtained from spectral library generated for different features. Each pixel is assigned to a class according the lowest spectral angle value.
The results are finally validated with the available high resolution data.
3. RESULTS AND DISCUSSION
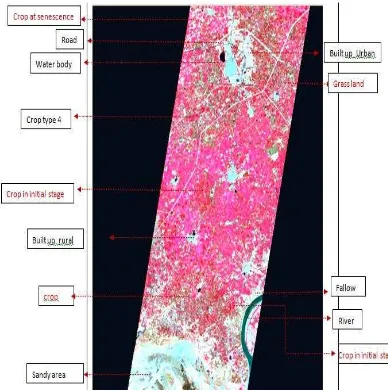
The atmospherically corrected hyperspectral image (30 m resolution) can distinguish most of the land use/ cover features on the earth surface. The land use/cover features on hyperion images are more clear and distinct than LISS III image. The various subclasses of major classes are distinct in hyperspectral image especially wasteland subclasses like sandy area, salt affected etc. Built up features like rural and compact are clearer than LISS III image. The different types of vegetation can be distinguished with the varying colour intensity of red band in RGB
Figure 2. Visual comparisons of the image
Figure 3. Land use/cover features in Hyperion Image
Water bodies could be distinguished clearly in hyperion due to the absorption properties of spectral bands. Among vegetation classes like agriculture, forest, grassland in LISS III, only some classes like plantation, crop and forest type could be identified by virtue of their shape/pattern or density of vegetation type, which is clearer in hyperspectral image. The different types of vegetation and crop classes could be identified in hyperspectral image by colour and verified using spectral reflectance, even health of vegetation can be identified. Thus hyperspectral image is on par with any high resolution image.
Hyperion data R:G:B 53:29:19 LISS III R:G:B 3:2:1
3.1 Comparison of SAM classification with LISS III visual interpretation
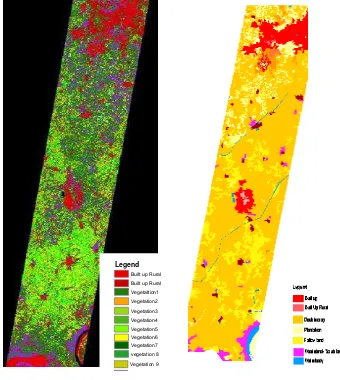
The Spectral Angle Mapping of hyperion data and visual interpretation of LISS III is shown in (Figure 5.) below
Figure 4. Reference image with SAM classification
Figure 5. SAM of hyperion and Visual interpretation of LISS III
The result of Spectral Angular Mapping classification showed that there is an increase in area under agricultural and wasteland classes, when compared with LISS III. In SAM classification a similarity is noted in the reflectance of built up and some wasteland area like sandy/barren area. Hence, there is a possibility of over classification of some of the classes. Vegetation/crop classes were very distinct with absorption band in blue (430/450) and red (650) reflectance peak in green (550), the red edge and the near-infrared and short-wave infrared region with its typical water vibrational absorption features. A part from the routine 54 classes, more vegetation classes can be distinguished from the image. were different. For hyperion there was misinterpretation of fallow and also between scrub land between crop and fallow. For LISS III there was misinterpretation between built up sparse and scrub land and also fallow and scrubland.
An overlay of visual interpretation of Liss III and SAM classification provided a better understanding of the type and extent of each land use/ land cover features.
3.2 Differentiating vegetation from canopy structure
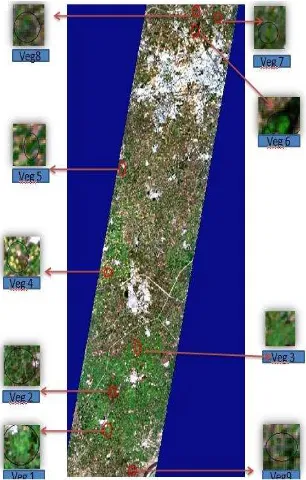
Different class of vegetation wereidentified from the image like plantation, wetland vegetation, grassland and crops at initial and senescence stage which are depicted in the figure 5 with range from veg1 to veg9. The spectral signature for the different vegetation are identified and used for spectral library generation and classification of image.
Figure 6. Different Vegetation type identified
Vegetation which is in the senescence stage can be distinguished visually from the hyperspectral image. The yellow patches in the true colour compared with the patches in high resolution data is shown (figure.7) below.
Figure 7. Hyperspectral image and High resolution image of crop at senescence
Reflectance of wetlands in hyperspectral image is more when compared with the high resolution data of less than 15m resolution. Aquatic vegetations was showing more absorption in Short wave infra red region. The algal blooms in the waterbody are clearly delineated from the hydric part in hyperspectral data
Figure 8. Hyperspectral image and High resolution image of Aquatic vegetation
3.3 Differentiating vegetation from canopy structure
The canopy structure is primarily defined by leaf area index (LAI) and leaf angle distribution. The LAI is defined as the total one-sided leaf area per unit ground area and represent the leaf amount of canopy. Optical properties of a vegetation canopy depend mainly on the optical properties of the canopy constituents and on the canopy structure. The most important canopy elements are the leaves and the underlying soil. As the plant grows the visible and mid-IR reflectance decreases and the near -IR reflectance increases and the reverse is observed during senescence (Guyot, 1990).
Red edge is the abrupt increase in reflectance from visible to near infra red defined by the point of maximum slope. The wavelength position of the red edge is Red Edge Inflection Point is between 680 and 740nm. REIP depends on the amount of chlorophyll seen by sensor and is characterised by chlorophyll concentration and LAI. An increase in chlorophyll concentration increases the chlorophyll absorption and broadens the associated Chl-a absorption feature located at 680nm, as a consequence the REIP shifts towards longer wavelength-red shift. Decrease in chlorophyll absorption and will shift the REIP towards wavelength –blue shift (Schlerff, 2011).
Figure 9. REIP for the different vegetation classes
The increased reflectance in the green and red domains is the most important leaf reflectance response to plant stress. The spectral reflectance curve for the different crops under study showed that the crop nearing to senescence (veg 4) (near to harvest) is having highest peak in green (550 nm) and red (650 nm), shows vegetation is with less chlorophyll content. The healthy vegetation with crops in initial stage (young vegetation) (veg9, veg2 and veg5) will be having low reflectance in this region. Wetland vegetation has intermediate reflectance and Plantation with good canopy is showing more reflectance.
4. CONCLUSION
Hyperspectral images have better discriminating capability for land use/ land cover features when compared to any broad band images. Visual interpretation of LISS III should be overlayed with SAM classified hyperspectral data to improve the accuracies and reduce the uncertainties in classification of the sub category of major land use classes. Further, the feature property can be verified with the spectral signature generated. In this study crop in senescence could be clearly identified from the image and is verified with the canopy reflectance of the crop. The algal bloom and wetland areas can be distinguished with hyper spectral data and is clearer
remote sensing is lack of data for temporal studies for specific location which is always needed for assessing land use changes, difficulty in handling the data and the preprocessing formalities of the huge data and inflexibility to work in different softwares other than ENVI. Inspite of all the limitation, hyperspectral data has a vast potential in land cover studies which need further exploration.
REFERENCES
Gouyt, G., 1990. Optical properties of vegetation canopies. In: steven, M.D. Clark, J.A. (Eds.): Application of remote sensing in agriculture. London. Butterworths, pp. 19-43.
Thenkabail, P.S. Lyon, J.G. and Huete, A., 2011. Hyperspectral Remote Sensing of Vegetation. CRC Press, pp. 781.
Schlerf, M., 2011. Hyperspectral remote sensing applications for vegetation studies. In :Ranganath R. Navalgund and Shibendu S. Ray (Eds.): Hyperspectral Data Analysis Techniques and Applications. Indian society of remote sensing., Dehradun, pp.79-99.
Schmidt, K. S. and Skidmore, A. K., 2002. Spectral discrimination of vegetation types in a coastal wetalnd. Remote sensing of Environment, 85, pp. 92-108.
Petropoulos, G. P., Aravantis, K. and Sigrimis, N., 2012. Hyperion hyperspectral imagery analysis combined with machine learning. Expert Systems with Applications, 39, pp. 3800-3809.