URBAN GROWTH SCENARIOS OF A FUTURE MEGA CITY: CASE STUDY
AHMEDABAD
A. Lehner a,b *, V. Kraus a, K. Steinnocher a
a AIT Austrian Institute of Technology, Energy Department, Giefinggasse 2, 1210 Vienna, Austria - (arthur.lehner.fl,
valentin.kraus.fl, klaus.steinnocher)@ait.ac.at
b University of Salzburg, Department of Geoinformatics, Schillerstrasse 30, 5020 Salzburg, Austria
Theme Session 17 - Smart cities
KEY WORDS: Urban remote sensing, Smart city, Urban planning, Urban growth, Ahmedabad, India
ABSTRACT:
The study of urban areas and their development focuses on cities, their physical and demographic expansion and the tensions and impacts that go along with urban growth. Especially in developing countries and emerging national economies like India, consistent and up to date information or other planning relevant data all too often is not available. With its Smart Cities Mission, the Indian government places great importance on the future developments of Indian urban areas and pays tribute to the large-scale rural to urban migration. The potentials of urban remote sensing and its contribution to urban planning are discussed and related to the Indian Smart Cities Mission. A case study is presented showing urban remote sensing based information products for the city of Ahmedabad. Resulting urban growth scenarios are presented, hotspots identified and future action alternatives proposed.
1. INTRODUCTION
1.1 Urban Growth
Urbanization (1) is a global phenomenon, with rates varying from continent to continent. While in Europe more than 70% of the population live in urban areas, the urbanization rate in Asia is still below 50%, but – in contrast to Europe – growing extremely fast; statistical data for India presents a rate of urbanization of 31 % (Mucke et al., 2014). Although in an international comparison these rates may appear low, the increasing population pressure has resulted in unplanned growth in the urban areas.
Spatial and demographic processes caused by urbanization refer to the increased importance of towns and cities as a concentration of population within a particular economy and society (Bhatta, 2010). It thus appears that urban growth goes hand in hand with economic growth and is therefore widely accepted. Bhatta (2010) though, has presented that within the scientific world, there is no common sense whether compact or disperse urban growth is particularly favorable.
It is generally agreed that rapid and unplanned urban growth threatens sustainable development when the necessary infrastructure is not developed or when policies are not implemented. In some cities, unplanned or inadequately managed urban expansion leads to rapid sprawl, pollution, and environmental degradation, together with unsustainable production and consumption pattern. Thus accurate, consistent and timely data on global trends in urbanization and city growth are critical for assessing current and future needs with respect to urban growth and for setting policy priorities to promote inclusive and equitable urban and rural development (United Nations, 2014).
* Corresponding author
1 Urbanization in this context means the number or percentage of people residing in cities or urban areas of one country compared to the total number
of people living within the whole state territory.
Although information in form of changes in land cover and land use are indicators for the development of districts or quarters, we have to be aware that we usually can only do statements about long ago activities or the recent past. The evolution of urban strategies and urban development plans or land use plans needs further data and information about buildings, recreational areas, impervious surface etc. Urban remote sensing derived products may not only display urban growth patterns and urban sprawl from the past but may also be used to develop future scenarios of urban growth and its spatial distribution. These scenarios can then be used by municipalities and planning authorities to point out the demand for sustainable and guided urban expansion.
This paper deals with the visualization of urban growth scenarios and city development based on data and information acquired via remote sensing. By means of different building structures and densities different scenarios are created to display different land consumption rates.
1.2 India and Smart City
The 1st Smart Cities India 2015 Expo held at Pragati Maidan in New Delhi highlighted the ambitious ‘Smart City’ initiative of the Indian government. In June 2015, the Indian Prime Minister Narendra Modi, former Chief Minister of the state Gujarat, announced that hundred Indian cities will develop under the
‘Smart Cities Mission’. This mission will last five years (2015 – 2020) and contains a budget of more than 7 billion dollars (Rs 48,000 crore). Ahmedabad, among other five cities of the state Gujarat will be part of this mission. Although it is unclear what a
“smart city” is,the objective(s) is clear: “In the approach to the
Smart Cities Mission, the objective is to promote cities that provide core infrastructure and give a decent quality of life to its citizens, a clean sustainable environment and application of
‘Smart Solutions’.” (Government of India, 2015) “Smart ISPRS Annals of the Photogrammetry, Remote Sensing and Spatial Information Sciences, Volume III-2, 2016
solutions” in the context of the Indian Smart City approach comprise robust IT connectivity and digitalization, intelligent traffic management, smart metering and smart parking; it means the application and incorporation of the supply of public and commercial services into one digitized network.
The Indian government’s approach and its vision of Smart cities (strongly) differ from the European idea of smart cities, not only in terms of dimensions (former with a population of more than 1 billion inhabitants) but also in terms of its fundamental attitude (adequate water supply, sanitation etc.); hence European smart city projects and ideas are not further discussed in this work. Isolated and sporadic improvements shall make room for one integral and holistic method of approach.
All in all Smart Cities India contains many governmental areas, from smart ports, smart army forces and smart airports to the creation of industrial parks and corridors like the DMIC: The Delhi Mumbai Industrial Corridor (DMIC). The Smart Cities India program is a program to enhance amongst others quality and performance of urban services, reduce costs and resource consumption within urban environments which includes comprehensive urban planning strategies. However, as experienced and claimed in many scientific researches, the lack of data, data availability and data actuality are very often limiting factors. The Smart Cities mission and the achievement of its goals though require consolidated knowledge about the urban area including distribution of built-up area, relation of built-up and green areas, knowledge about future development axis, building density etc.
Urban remote sensing may play an important role for the
application of Smart Solutions that “will involve the use of
technology, information and data to make infrastructure and services better.” (Government of India, 2015)
1.3 Potential of Urban Remote Sensing in Context of Smart City
Urban planners in developing countries are confronted with a fast growth of urban agglomerations. Informal settlements are very often parts of cities and informal economic activity often plays an important role within cities economy. Through the lack of resources the gathering of data on the ground becomes more and more challenging.
Urban remote sensing may substitute missing data and bridge information gaps, can emphasize spatial trends and facilitates city planners to implement energy planning in a spatial context. The perpetual improvement of active and passive sensors as well as the accessibility of high resolution images and other remote sensing data are the base for the nowadays numerous activities in the field of urban remote sensing. However, the fields of application of earth observation for urban planning and energy planning purposes often maintain to be uncertain or unknown to urban planners, municipalities or policy makers.
This paper is a contribution to propose the use of urban remote sensing for smart city projects. Urban remote sensing will support
city planners or other planning authorities to implement “Smart Solutions” that are required for the challenges of the Indian Smart
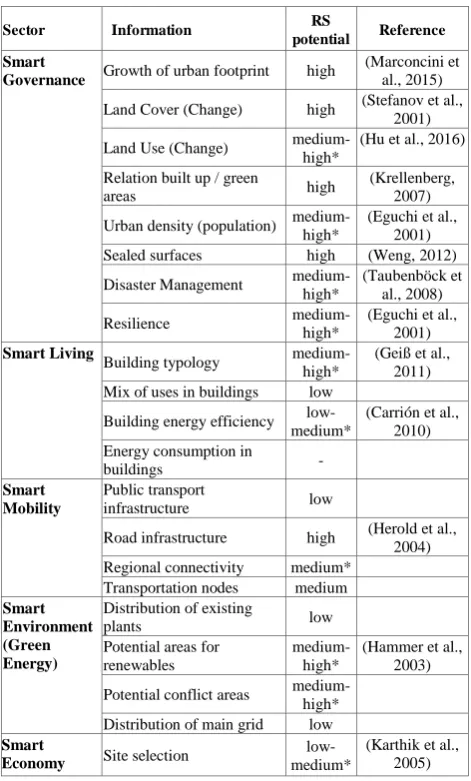
Cities Mission or other urban growth and urbanization driven tasks. A compilation of urban remote sensing potentials and its contribution to the future challenge Smart City is listed in Table 1.
*ancillary data required
Table 1, Tasks and Potentials of Remote Sensing
2. STUDY AREA AHMEDABAD, GUJARAT
For the demonstration of the potentials of remote sensing derived scenarios in the context of urban planning and Smart City, a case study was set up for the city of Ahmedabad in India.
Ahmedabad is one of the 25 districts of the state Gujarat which lies in the northwest of India. (Figure 1) Although Ahmedabad is not the capital city of the state (which is Gandhinagar, named after Mahatma Gandhi) it is the largest city of Gujarat and has around 6 million inhabitants and estimations predict a (constant) rise to 11 million inhabitants by 2035.
The Sabarmati River divides Ahmedabad physically in two big regions, the eastern and the western region with a historic center which is located at the eastern bank of the river. The climate is hot and dry with a rainy season (monsoon) between June and September. The average annual rainfall is about 800 mm. However, precipitation mostly occurs during the monsoon season in terms of heavy rain events.
Today, Ahmedabad is a big industrial center, base of many regional banks, nationwide and global industrial players (e.g. Peugeot, Torrent Pharmaceuticals Ltd., Arvind Limited etc.) and has a high economic importance for western India. It can be observed that its economic base is now shifting towards tertiary
Sector Information RS
potential Reference
Smart
Governance Growth of urban footprint high
(Marconcini et al., 2015)
Land Cover (Change) high (Stefanov et al.,
2001)
Urban density (population) medium-high* (Eguchi et al., 2001)
Sealed surfaces high (Weng, 2012)
Disaster Management
medium-Road infrastructure high (Herold et al.,
2004)
Distribution of main grid low
Smart
sectors, which currently accounts for more than 50 % of total employment, caused by projects and initiatives like the Gujarat International Financial Tech-City (GIFT CITY), the Sabarmati Riverfront Development Project, the Narmada Valley Project, the DMIC: The Delhi Mumbai Industrial Corridor (DMIC) or the Smart Cities Mission.
Figure 1: Location of Ahmedabad
The city of Ahmedabad is subdivided into 64 wards (districts). The main governing agencies are the Ahmedabad Municipal Corporation (AMC) and the Ahmedabad Urban Development Authority (AUDA), while the latter is responsible for both land use planning and strategic planning of the city.
At first glance the allocation of tasks and authorities seems to be clear. However, the numbers of wards, the name of particular wards as well as the borders of particular wards vary through time; they differ in various publications and governmental reports. In addition to rapid change of administrative units the population statistics also corresponds to different administrative units, depending on the year of census.
3. METHODOLOGY
From a minimum of data and information a plausibility test was to be developed allowing to verify predictions about urban growth, spatial trends and their materialization within the urban environment. Beyond that, a fast method was developed that allows a visualization of distinct scenarios and predictions about future urban growth, including effects of different building densities. The methodology used for this work is not genuinely new. However, we applied these methods in a new context: the city-wide spatial verification of a population forecast in order to support urban planners efficiently and to avoid additional costs. Thus our approach was to work with freely accessible data from remote sensing. Under these terms and conditions subsequently presented data was chosen.
3.1 Data Basis & Preliminary Study
For the metropolitan area of Ahmedabad (AMC) a geo data base has been set up, consisting of satellite imagery and ancillary data. Two types of satellite data were collected for this area:
- VHRI from Pleiades satellites (geometric resolution: 0.5 m) - Multitemporal Landsat scenes (geometric resolution: 30 m)
The Landsat scenes – acquired on July 14, 2014 from Landsat 8 and on July 06, 1999 from Landsat 5 – were downloaded from USGS. They cover the entire area of investigation at the same season which is important for change detection analysis. In a preliminary study the Pleiades imagery (acquired on Feb 23 and on March 08, 2013) was used for the analysis of land cover objects, the Landsat images were the basis for analyzing land cover changes over time (Steinnocher et al., 2015).
Ancillary data derived from statistics (Urban Management Centre, 2013) as well as OpenStreetMap (OSM) data was used to enhance the information content. As statistical data is often available on larger administrative units or only implicitly related to spatial units, some of the required GIS data sets were derived
from “analogue” maps. These data sets were geocoded and classified. The results were discussed on two scale levels: on a regional scale, covered by Landsat imagery and on a local scale, covered by VHR imagery from Pleiades (Steinnocher et al., 2015).
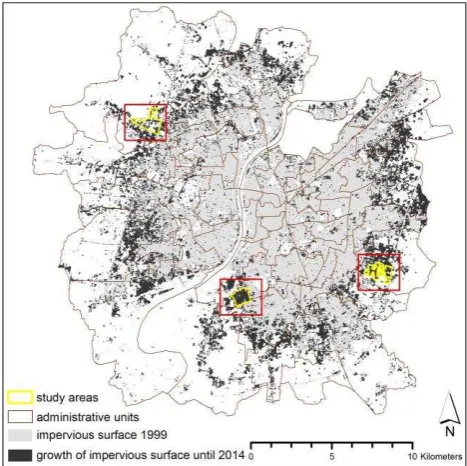
The urban footprint is defined as impervious area. The analysis of the urban footprint is based on data from Landsat 5 (1999) and Landsat 8 (2014). (Figure 2) For change detection, post classification comparison was used applying identical training areas for both dates and ancillary population data was linked to the derived geo-information products. (Steinnocher et al., 2015)
Figure 2: Growth of urban footprint for Ahmedabad
In order to obtain more information about the growth of Ahmedabad, especially about the relationship between the growth of the impervious area and the population change, further research had to be undertaken. Based on the results on the regional scale, urban growth analysis has been carried out; urban growth scenarios were developed and are discussed in this paper. ISPRS Annals of the Photogrammetry, Remote Sensing and Spatial Information Sciences, Volume III-2, 2016
3.2 Analyzing Population Change and the Change of Impervious Surface
Population change per ward can be related to the change of impervious surface. Assuming a linear correlation between those two factors, the calculation should not only give an informative review regarding the land consumption per capita. It also can be the initial approach for scenario based investigations. Due to the high dynamic population prospects of Ahmedabad (the city is prospected to have 11 million inhabitants in 2035), these studies should provide essential information in order to answer the
- How much additional land will be needed for urban growth if the investigated ward-wise land consumption ratio remains the same?
- In case the population forecast proves to be true – is there ‘enough space’ inside the current city limits, assuming a steady land consumption rate?
The urban footprint of Ahmedabad had been computed for 1999 and 2014. Data about the urban population based on administrative unit level was available for 2001 (census) and 2011 (Urban Management Centre, 2013).
In order to analyze the relation between population change and the change of impervious surface for each ward, a time gap between the geodata and the census data was evident but inevitable.
The Ahmedabad urban footprint raster 1999 was subdivided into smaller parts, represented by the geographical extent of each ward. The same calculations were performed using the urban footprint 2014, though the urban footprint raster had to be edited to some extent. Big roads like the Sardar Patel Ring Road, its large on-ramps as well as large industrial zones or infrastructure like wastewater treatment plants were built up during the period of investigation. Water areas like the Sabarmati River, small lakes or basins had been detected as sealed areas to some extent. In order to avoid major influences on the change of impervious surface/population change-ratio, these areas were excluded from the sealed surface change raster manually. For extracting the big roads and the water areas, OSM data was used. For a more precise analysis the geometric resolution of the footprint raster were set to a 5m pixel size instead of the original Landsat pixel size of 30m.
A zonal histogram was computed to achieve the frequency distribution of the cell values of the sealed change raster for each ward.
The population change (2001/2011) could also be analyzed on ward-level. The Zonal Histogram Table could then be linked to the population change 2001/2011 per ward. The results showed the population change per sealed surface change raster pixel (5 m²) for each ward.
3.3 Extrapolation of the Urban Population
The extrapolation of the urban population on a ward level based on the increase of population and observed in the period 2001 – 2011, was estimated. The average annual growth rate had to be calculated. (Husa and Wohlschlägl, 2004)
��,�+�= ( √� ��+��� − 1) (1)
where rt,t+n = average annual growth rate n = number of periods (years)
Pt = population at the beginning of the observation period
Pt+n = population at the end of the observation period
t,t+n = observation period
The population extrapolation was computed on a ward-wise level, assuming steady population growth rates.
��+�= ��∗ 1 +��+� �
(2)
where Pt+x = future population
Pt = base population (start of projection) rt,t+n = average annual growth rate x = years projected into the future
The calculations were performed for different observation periods, each starting from 2011. The extrapolated population on a ward level by the year 2020, 2025, 2030 and 2035 could be estimated.
Knowing the average land consumption rate per capita per ward 2011 and assuming constant values over time, the population extrapolation on ward level could be linked to it. The results showed the estimated growth of impervious surface for the observation periods on ward level.
3.4 Attractiveness Layer Calculation
In order to visualize the spatial distribution of impervious surface over time, a model for ArcGIS was set up, consisting of different raster analysis tools. The objective of the analysis was to create a layer showing the most favorable areas for urban settlements via combining different attractiveness layer.
Having estimated the growth of impervious surface on ward level for specific points in time, these values (size of area) could be converted into a number of raster pixels which then should be selected in the final attractiveness layer. The selected pixels should represent the highest values of the final attractiveness layer indicating the most favorable areas for the calculated growth of impervious surface on ward level.
The data for the ArcGIS model included the urban footprint raster (1999 and 2014), an NDVI raster (calculated from Landsat 2014 showing areas of high and low vegetation with pixel values ranging from 85 to 159) and a raster layer consisting of unsuitable areas for urban development. The raster layer was created by merging the areas used for editing the urban footprint raster 2014 with a raster consisting of high valued NDVI pixels (values above 125). Furthermore, manually selected arterial roads (OSM data) were used for the analysis. The area most favorable for urban development should be close to existing urban settlement and arterial roads. Considering future development, areas around new urban development were regarded as more attractive than areas around older urban areas. Furthermore, areas with low vegetation ISPRS Annals of the Photogrammetry, Remote Sensing and Spatial Information Sciences, Volume III-2, 2016
should be more favorable. Due to the available data, a fuzzy site analysis was computed. Instead of classes with crisp boundaries (yes/no membership), the input layers were transformed to a 0 to 1 scale, indicating the degree of membership from low to high. In a first step Euclidian distances from the urban footprint and from the arterial streets were calculated. A Fuzzy Membership
Function (“linear”) was computed, assuming a descending
attractiveness within a growing distance. The maximum distance was set to 3000 m from the impervious surface and 1500 m from the arterial streets. The Fuzzy Membership Function was used due intrinsic data characteristics. Neither from analytical perspective nor from a planning point of view it is reasonable to set crisp boundaries regarding the attractiveness for new settlements as attractiveness does not necessarily decrease within default distance. Moreover, it is probable that spatial characteristics of a certain area within one ward will not be one-to-one transferable to another area of the same ward or another one of a different ward. Local experts though may be able to adapt and improve the suggested methodology based on their experience and knowledge. For the presented study fixed distances were used as a standard parameter for all wards, as the emphasis of the used methodology lay on fast processing, covering big areas while using small amount of data.
The urban footprint was divided into two zones: impervious surface 1999 with a pixel value of 1 and impervious surface 2014 with a pixel value of 2. The Focal Statistics Tool was run, computing the sum of these values within a 150 cells neighborhood on a cell by cell basis. This leads to the establishment of a new raster that allows a differentiation between areas with recently sealed surface and areas with anteriorly sealed surface whereupon areas with recent building activity are considered as more attractive as older ones. A Fuzzy
Membership Function (“linear”) was generated, considering the range from the lowest to the highest computed value. In order to obtain a layer, showing more favorable areas when having lower
NDVI values, the Fuzzy Membership Function “small” was
computed using the NDVI raster to generate an additional attractiveness layer. (DeMers, 2002)
The Null values, which occurred in each attractiveness layer, were set to 0 in order to be able to combine the layers via the Weighted Sum Tool without excluding city areas. The attractiveness layers were weighted as follows: distance to urban footprint (weight 0.4), Focal Statistics on impervious surface1999/2014 (weight 0.3), NDVI calculation (0.2) and distance to arterial streets (weight 0.1). The combined attractiveness layer indicated the most favorable areas for urban development covering the whole city area (AMC). The impervious surface, unsuitable areas for urban settlement as well as the areas with very high NDVI values (above 125) were excluded.
The values for the estimated growth of impervious surface for the different observation periods on ward level were joined to the ArcGIS vector layer consisting of the ward boundaries. A feature iteration was computed selecting the calculated amount of pixels for each observation period on ward level basis. After iterating each ward for each particular observation period, the raster files containing the estimated growth of impervious surface were merged resulting in four different raster files: the estimated urban growth 2020, 2025, 2030 and 2035. (Figure 9)
3.5 Challenges
Because of the unavailability of census data from the year 2011, population data had to be extracted from other data sources
(Urban Management Centre, 2013) to be able to calculate the population change per pixel. This data covered only the city of
Ahmedabad (“AMC new”) for this point in time. Thus, the area to the north of Ahmedabad as well as Gujarat’s capital
Gandhinagar could not be investigated. Nevertheless, the area, covered by the Landsat scenes was included in the attractiveness layer calculations. Thus it had an impact on the layer calculations, mainly in the AMC border areas.The primary population data (Urban Management Centre, 2013) was classified on a ward level. The administrative city boundaries were changed and spread out during the investigated time span. In order to assign concrete population change values to the wards, recalculations had to be carried out. Besides that, time gaps between the obtained geodata and the population data were evident (Landsat 1999 and census data 2001/Landsat 2014 and Urban Management Centre, 2013).
After calculating the average annual growth rate it became obvious that some wards showed extremely high growth rates. Whereas the average annual growth rate for the whole city was about 1.21 %, five wards appeared to have rates between 5.97 % and 18.64 %. Extrapolating the population growth, these extremely high rates were reduced to 3.8 % which still means that the population in these wards would be more than doubled within 24 years (2011 to 2035). In contrast, six wards situated around the city center experienced a population decrease from 2001 to 2011. Latter were not included in the extrapolation, though the number of inhabitants from the year 2011 of this six wards was added at end to the result of the extrapolation.
Moreover, geodata covering areas that should be excluded from the estimated urban growth modelling (e.g. protected areas, flooding zones) as well as zoning plans or land development plans were not available and could not be taken into consideration.
4. RESULTS
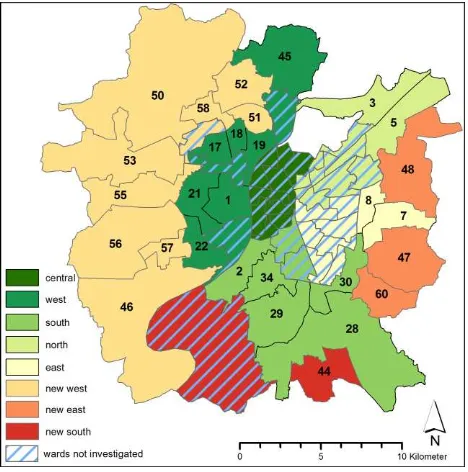
The wards were divided in ward zones, according to the change of the administrative city boundaries (Figure 3).
Figure 3: Reviewed wards Ahmedabad ISPRS Annals of the Photogrammetry, Remote Sensing and Spatial Information Sciences, Volume III-2, 2016
The scatterplot (Figure 4) shows the growth of population (steps of 10.000 inhabitants) in relation to the increase of impervious surface within particular wards.
One can identify wards that experienced either a considerable increase in population or in sealed surface. Based on the assumption that impervious surfaces are especially likely to be associated with the human transformation of the environment characteristic of roads, buildings and other aspects of the urban area (Stern and Entwisle, 2005) we may recognize a correlation between impervious surface and the number of inhabitants. Therefore, points, which lay below the trend line, represent wards that faced a significant increase of impervious surface while growth of population remained low.
Figure 4: Scatterplot
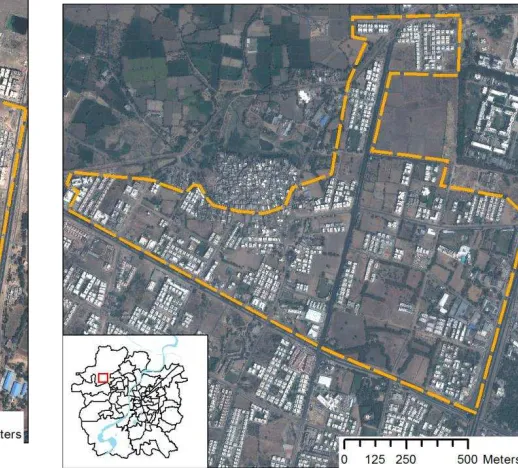
Three representative examples, two for strong population growth and one for significant increase of impervious surface (and urban sprawl), within three different wards were chosen: n° 1 is represented by ward 47 “Vastral”, n° 2 by ward 34 “Danilimda” and n° 3 by ward 50 “Gota”:
For the investigation area of Ward 47 “Vastral” (Figure 5), the scatter plot showed a significant rise of inhabitants and one of the highest gains of impervious surface for the city of Ahmedabad.
Figure 5: Investigated area of Ward 47 “Vastral”
Resulting spatial trends can be verified as indicated in the scatter plot; a high number of high-rise buildings and small gaps between buildings. Latter may be regarded as an obstacle for a completed urban area and sustainable urban development because of their size and their reduced attractiveness to investors.
Figure 6: Investigated area of Ward 34 “Danilimda”
Although the scatter plot indicates a rather small increase of impervious surface and moderate growth of population for Ward
34 “Danilimda” (Figure 6), relating to the total size of the district
the change of population and impervious surface remains high. The VHR satellite data shows densely built low-rise buildings and hardly any green or open spaces. Residential buildings appear to be in direct neighborhood to industrial or commercial premises. High population density in Ward 34 may not originate from building heights but may rather have its seeds in a high floor-space index and a high residential density.
Figure 7: Investigated area of Ward 50 “Gota”
The investigation area of Ward 50 “Gota”, as recognized from
visual interpretation, can be seen as exemplary for the “new west” wards. It is characterized by low-rise buildings that are widely spread and apparently do not belong to one connected project. Visual inspections (Figure 7) document the spatial trend that was already displayed in the scatter plot; a significant increase of impervious surface goes along with a relatively small growth of population, two factors that are origin and stimulus of urban sprawl and land consumption.
4.1 Scenarios
Until now, computed results were validated by visual inspection of the VHR satellite data (Pleiades). Based on the assumption that there is linear correlation between the impervious surface, its increase and population growth, respectively, numeric scenarios for the future urban expansion could be generated. These scenarios (scenario A and scenario B) differ in the rate of urban growth.
First, a verification of the assumption (2035: 11 Million inhabitants) that was stated in chapter 2.1 was performed. Original data was the number of inhabitants in the year 2011 which was about 5 Million (4.94 Million), an assumed averaged rate of urbanization of 3 % (2) for the entire city of Ahmedabad and the predicted population of 11 Million. It resulted a duration of round 27 years, i.e. that by given rate of urbanization (3 %) Ahmedabad will contain a plus of 6 Million inhabitants not until the year 2038. The overall growth rate has to rise to 3.4 % with regard to prediction of 11 Million inhabitants in the year 2035 (scenario A).
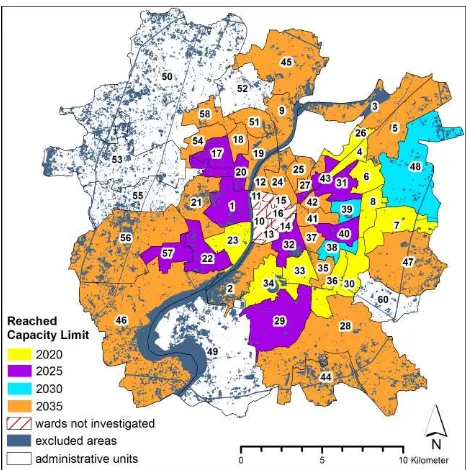
Incorporated in the assumption of linear correlation mentioned at the beginning and invariable population density (steady inhabitants-per-pixel ratio), it could be documented for several cases that urban growth goes beyond the limits of administrative units; i.e. that more than 20 wards of Ahmedabad will have reached their capacity already long before the year 2035, whereby the threshold capacity was set to 80 % (Figure 8).
Figure 8: Capacity limits of different wards of the AMC
22.38 % for entire India (Factbook, 2010)
From the investigated wards, only Ward 49 “Lambh”, Ward 50
“Gota”, Ward 52 “Kali”, Ward 53 “Thalt”, Ward 55 “Bodak” and Ward 60 “Ramol” will maintain capacity which may originate from their location within the city or their size since “Gota” and
“Thalt” are one of the largest districts of Ahmedabad.
The scenario resulted in a predicted number of 6.7 Million inhabitants for the year 2035; we recognize it as scenario B. The results show that these additional (1.76 Million) citizens will be able to settle within the current metropolitan area of Ahmedabad (AMC).
Figure 9: Urban Growth Scenario B
However, due to the fact, that within the scenario B various wards were not able to host the particular added inhabitants, latter had to be manually shifted to other more capacious wards. Scenario B (Figure 9) showed that a gain of about 1.76 Million inhabitants will bring the metropolitan area of Ahmedabad (AMC) to the limits of its capacities and revealed that the remaining built up area of many wards is nowadays already negligibly small.
Considering the aforementioned conditions of urban growth and population density, the metropolitan area of Ahmedabad will be able to host a maximum number of 7.1 Million inhabitants. It can therefore be concluded that scenario A is not probable, assuming that the metropolitan area of Ahmedabad will not be expanded and that building density will not increase.
5. CONCLUSION
In this work it could be demonstrated that urban remote sensing can be effectively used to visualize the increase of impervious surface and to verify projections and urban growth scenarios. With a minimum of freely available data, we were able to produce comprehensible future scenarios for urban growth. Potential building land could be highlighted and may enable a differentiated view on the spatial distribution of the additional impervious surface and thus may allow urban planners to see the big picture.
The effect of legal restrictions can be reviewed. These constraints are amongst others land use plans, master plans or other planning instruments which are spatially active; within the case study, regions that have faced a high development pressure could be detected and urban areas that are characterized by a high consumption of land, could be identified.
Nowadays planning authorities of emerging and developing countries face a gap of data and information that are needed for
the development of “Smart Solutions”. It is mostly tough for them to keep track of construction activities and the rapid change of land use and land cover.
Local urban planners can therefore use freely available data and their expert knowledge to evolve urban growth scenarios for their particular city; it allows them to perform plausibility checks and to develop appropriate tools and instruments for urban planning. Through weighting factors like the distance to radial roads, the distance to existing structures or the weighting of recent built-up areas as more attractive to urban developers, they can use their local knowledge and experience to improve the presented urban growth scenarios.
Urban remote sensing certainly can support urban planners in decision making. It is an alternative to classic urban management and will be an essential component for the challenges of the Indian Smart Cities Mission.
REFERENCES
Bhatta, B., 2010. Analysis of urban growth and sprawl from remote sensing data. Springer Science & Business Media.
Carrión, D., Lorenz, A., Kolbe, T.H., 2010. Estimation of the energetic rehabilitation state of buildings for the city of Berlin using a 3D city model represented in CityGML. Int. Arch. Photogramm. Remote Sens. Spat. Inf. Sci. 38, 31–35.
DeMers, M.N., 2002. GIS modeling in raster. Wiley New York.
Eguchi, R.T., Huyck, C.K., Adams, B.J., Mansouri, B., Houshmand, B., Shinozuka, M., 2001. Resilient disaster response: using remote sensing technologies for post-earthquake damage detection. Earthq. Eng. Extreme Events MCEER Res. Prog. Accompl. 2003, 2003.
Factbook, C.I.A., 2010. The world factbook. See Also Httpswww Cia Govlibrarypublications-World-Factb.
Geiß, C., Taubenböck, H., Wurm, M., Esch, T., Nast, M., Schillings, C., Blaschke, T., 2011. Remote sensing-based characterization of settlement structures for assessing local potential of district heat. Remote Sens. 3, 1447–1471.
Government of India, 2015, Smart City, MISSION TRANSFORM-NATION, Mission Statement & Guidelines, Ministry of Urban Development, Governemnt of India, June, 2015
Hammer, A., Heinemann, D., Hoyer, C., Kuhlemann, R., Lorenz, E., Müller, R., Beyer, H.G., 2003. Solar energy assessment using remote sensing technologies. Remote Sens. Environ. 86, 423– 432.
Herold, M., Roberts, D.A., Gardner, M.E., Dennison, P.E., 2004. Spectrometry for urban area remote sensing—Development and
analysis of a spectral library from 350 to 2400 nm. Remote Sens. Environ. 91, 304–319.
Hu, T., Yang, J., Li, X., Gong, P., 2016. Mapping Urban Land Use by Using Landsat Images and Open Social Data. Remote Sens. 8, 151.
Husa, K., Wohlschlägl, H., 2004. Proseminar “Grundzüge der Bevölkerungsgeographie”. Lehrbehelf zur Lehrveranstaltung. Universität Wien, Wien
Karthik, M., Suri, J., Saharan, N., Biradar, R.S., 2005. Brackish water aquaculture site selection in Palghar Taluk, Thane district of Maharashtra, India, using the techniques of remote sensing and geographical information system. Aquac. Eng. 32, 285–302.
Krellenberg, K., 2007. Urban Environmental Monitoring in Buenos Aires—Determining Green Areas, in: Applied Remote Sensing for Urban Planning, Governance and Sustainability. Springer, pp. 77–95.
Mucke, P., Jeschonnek, L., Garschagen, M., Schauber, A., Seibert, T., Welle, T., Birkmann, J., Rhyner, J., Kohler, S., Loster, T., 2014. WeltRisikoBericht 2014: Risikoraum Stadt. Bündnis Entwicklung Hilft.
OSM, OSM - © OpenStreetMap contributors
Stefanov, W.L., Ramsey, M.S., Christensen, P.R., 2001. Monitoring urban land cover change: An expert system approach to land cover classification of semiarid to arid urban centers. Remote Sens. Environ. 77, 173–185.
Steinnocher, K., Walangitang, D., Filipczak, D., 2015. Earth observation for Low Carbon Action plan development-A concept for EO supported energy planning, in: Urban Remote Sensing Event (JURSE), 2015 Joint. IEEE, pp. 1–4.
Stern, P.C., Entwisle, B., 2005. Population, Land Use, and Environment: Research Directions. National Academies Press.
Taubenböck, H., Post, J., Roth, A., Zosseder, K., Strunz, G., Dech, S., 2008. A conceptual vulnerability and risk framework as outline to identify capabilities of remote sensing. Nat. Hazards Earth Syst. Sci. 8, 409–420.
Weng, Q., 2012. Remote sensing of impervious surfaces in the urban areas: Requirements, methods, and trends. Remote Sens. Environ. 117, 34–49.
Urban Management Centre (2013) ‘City Health Plan Ahmedabad’. Ahmedabad: Health Department, National Urban Health Mission NUHM, Ahmedabad Municipal Corporation.
United Nations, 2014, World Urbanization Prospects, The 2014 Revision, Highlights, Department of Economic and Social Affairs, United Nations, New York, 2014, p. 4