TLS DATA FOR 2D REPRESENTATION AND 3D MODELING. DIFFERENT
APPROACHES TESTED IN THE CASE OF SAN GIOVANNI IN SALUZZO (CN) ITALY
C.Bonfanti a, F.Chiabrando a, *, F.Rinaudo a
a
Politecnico di Torino, Department of Architecture and Design,10125 Torino, Italy - (cristina.bonfanti,filiberto.chiabrando,fulvio.rinaudo)@polito.it
KEY WORDS: TLS, 3D models, 2D drawing, architectural Heritage, Open-source.
ABSTRACT:
TLS (Terrestrial Laser Scanners) data today represents one of the most attractive ways to face the metric survey of an architectural object. When a restoration project is needed not many restorers are used to managing 3D models and traditional graphic results such as plans and sections are usually required. The paper defines a correct balance between the use of traditional (manual and total station) and TLS techniques in order to satisfy the usual requirements for the metric survey of an architectural object in order to obtain a complete 2D documentation of the San Giovanni Church in Saluzzo (Cn)- Italy that would be used for the restoration both of the decorative apparatus and of the structure of the church. Furthermore using the acquired 3D data some tests on commercial and open-source software for 3D modeling purpose are realised.
The paper deals first of all with the followed methodology for the 2D documentation starting from 3D data. Moreover an analysis and a comparison between different software packages for the 3D modeling phase is reported.
* Corresponding author.
1. INTRODUCTION
In the last few years, a great deal of experience has been gained on the use of TLS data and techniques in order to obtain 2D representation and 3D models of Cultural Heritage objects (Guidi et al., 2009; Bariani et.al., 2012; Manferdini and Remondino 2012 ). Since the TLS instruments offer today good performances and a high level of accuracy, the national and international researches are focused on the processing steps that involve these big amount of data acquired from TLS, in order to carry out suitable products for Cultural Heritage documentation and knowledge. The final users usually require 2D graphical results such as plans, elevations and sections. As a consequence recent years have seen the development starting from the acquired 3D data, of several methodologies for the extraction of two dimensional information for the realisation of traditional 2D drawings. On the other hand, one of the most significant improvement that these techniques has generated in the Cultural Heritage field is the introduction of digital 3D modeling even more used as highly effective and intuitive means of communication and valorization or as interfaces to share and visualize collected information. According to the afore mentioned assumptions the acquired point clouds generally are used for the realisation of fully 3D models that are able to reproduce the real shape of the surveyed objects from where it is possible to recover the 2D drawings. This is mainly due to the great advances in data processing methodologies which allow also non-experts to enter the field of 3D modeling and exploit the great potentialities given by 3D models. The TLS methodology outcome an increasing request and needs for digital 3D recording for several applications like conservation, restoration, historical studies, education, 3D GIS, etc.
2. SAN GIOVANNI IN SALUZZO (CN) - ITALY
2.1 Historical background
The medieval core of the ancient Saluzzo contains a small jewel of Gothic architecture in Piedmont (the Marquis’s Chapel) that is integrated inside the most important religious building in the old town, the San Giovanni Church.
The present church of San Giovanni is part of the compact historic town that is largely built behind the hill and surrounded by walls for defensive reasons (Figure 1).
Historians tell us that the church was built after 1320 and it became the seat of the Dominicans from 1325; a series of variations, enlargements and the change of orientation were applied around 1370 and a decisive expansion in the late fifteenth century was carried out.
The present church of San Giovanni is organised into three naves divided by pillars with semi-columns that support the pointed archesof therib vaults.
A wide stairway in the central nave allows to overcome the significant height difference between the external square and the floor of the church (-2.52 m). Imposed by the steep terrain inclination in the old Saluzzo, the difference in elevation made the building construction difficult to accomplish. The apse is occupied by the funeral Chapel of the Marquis of Saluzzo, one of the most important examples of flamboyant Gothic in Piedmont (Comba R., 2009).
The terminal portion of the central aisle and the subsequent Marquis Chapel have complied with the pre-existing road: the building overlaps the street and the apse is supported by a high base. In this way the Marquis Chapel emerges from dense medieval buildings and it is visible only from the plain below. Along the aisles, various chapels, built in different periods, are located; inside some of them, the access to the Cloister, the Sacristy and the areas of the ancient convent are still open. The realisation of the church was influenced by the need to adapt the church expansions to the surrounding urban context, already characterised by houses and crossing roads, such as Tapparelli street, which has been a major limitation since the first installation.
Existing buildings significantly influenced the formal development and the orientation of the church. Many issues, related to its growth, are currently unsolved and must be understood before to face a full restoration project.
The historical and architectural significance of the building, its complex construction, the continuous overlaps and a poor documentation were the reasons for the realisation of a metric
survey for the formal knowledge of the church, in order to support historical investigations and future restoration projects. The requirements of a rich metric documentation for accurate analysis and for founding out possible construction anomalies in the walls and vaults, added to the previous documentation (published back to 1931 in Vacchetta G., 1931) were two other good reasons for the realisation of a complete 3D survey.
Figure 1. The church of San Giovanni: general map (original scale 1:500) and external view (top), interior overview (below).
2.2 Topographic and TLS Survey
For the documentation of the old church, several representations at a 1:100 nominal scale were planned. As a consequence, the metric survey had to fit the needs of a detailed design. Therefore a final tolerance of 4 cm was adopted .
The production of the main plan (fixed at 1.2 m above the floor) and of 7vertical sections were decided according to the restorer requirements and historical needs.
Following the traditional approach to the metric survey, first of all a control network was realised in order to define a 3D coordinate system and to limit the error propagation under the fixed 4 cm of tolerance (at 95% of probability) on the detail points.
In order to reach this goal, estimated accuracies of less than 4 cm had to be reached on the points of the control network. A combined network using classical angle and distance measurements acquired by a Total Station and GNSS observations was adopted.
After the measurements, a least square adjustment of the network using a topographic software (STARNET by Micro Survey) was performed.
In order to circumscribe the survey space, the first order network was made up of 18 control points permanently materialised on the floor with metallic nails and a suitable sketches were realised for each of them.
The detailed survey acquisition was realised by connecting the control network in the best possible ways. The availability of 3D acquisition systems is today a standard for architectural and archaeological surveys; in the case of San Giovanni a complete Laser scanner survey was performed.
In order to acquire the whole area of the church, several scans were realised:
- 23 for the internal part ; - 6 for the cloister; - 11 for the external part
For the internal part and for the cloister of the church the Faro Focus 3D laser scanner was employed; on the other hand for the external part the Riegl LMS Z-420 was used. The afore mentioned scanner was employed since one of the most important part of the church (the apse) was clearly visible only from a private terrace in the lower part of the town of Saluzzo at of about 130 m of distance from the apse surface, and the Faro Focus 3Ddoesn’t allow for data to be acquired at this distance range (www.faro.com).
After the acquisition phases the achieved point clouds were treated following the traditional step for TLS data post processing: filtering, outlier elimination, cloud coloring and registration.
As usual for the registration phase, some dedicated markers were employed, both for the Faro data and for the Riegl scans. All the markers were previously measured using a Total Station in order to calculate for each of them the coordinates defined by the control network.
Lastly, all the point clouds were used both for 3D modelling phase and 2D drawing generation (using the approach described in the following section).
3. 2D DRAWINGS
The traditional 2D representations extracted from laser scanner data has becoming standard practice.
For the church of San Giovanni the scale was set at 1:100 with the aim of meeting two specific objective:
to fill the lack of recent metric documentation to support process of analysis and restoration;
to highlight the construction anomalies (surface, pillars, capitals, vaults, rib vaults, etc.) that are differently located in the building.
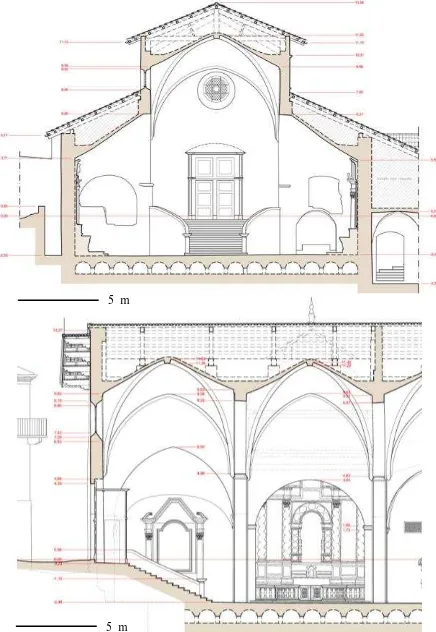
The laser data were very useful to support the reading of formal and surface anomalies and it allows to identify, for example, the proper smooth running of the vaults of the central nave, that testify the geometric and technical changes occurred during the different stages of the church expansion. To support the 2D representation, the Faro point clouds were managed using the software PointCab (from Laser scanning Europe GmbH), the Riegl one by using the PointClouds plugin application for Autocad. The useful and easy data management in PointCab allows the extraction of the traditional architectural projections (vertical and horizontal sections), in the term of digital images. These data are excellent footprints for the digital plotting operations. In Figure 2 an example of a section extracted using PointCab is reported.
Figure 2. Digital image of a vertical section extracted using PointCab .
Figure 3. The laser data of a pillar in the Marquis Chapel and its drawing (PointCab horizontal section(a), 2D horizontal drawing
(b), PointCab vertical section(c), 2D vertical drawing (d)) .
Moreover the rules of 2D representation (orthogonal projections) were profusely employed (Figure 3-4), since the final product needs to support the detailed requirements of restorers for the realisation of thematic maps concerning the materials, deterioration, etc.
Figure 4. Graphic develop of NW sacrestia for the representation of stone blocks distribution.
Finally, with the integration of the extracted 3D data (using PointCab and PointClouds) and the manual measurements, the final drawings were realised in order to achieve a complete documentation of the church of San Giovanni. All the drawings (plan and 7 sections) were carried out in two months by two operators. In Figure 6 a complete view and a portion of the 7 realised sections are showed.
4. 3D MODELLING
If on, one hand, for restoration project and historical studies the traditional 2D representations are still requested in order to following the classic approach to the knowledge of the historical buildings, on the other hand the actual methodology and instruments are completely oriented to the acquisition of 3D data. As a consequence, the realisation of 3D models as survey results or products is today a standard practice (Guidi, et al., 2009) and from them it is possible to extract the main part of the information needed to realise 2D drawings.
The software that enable the managing of point clouds are developed from several software houses but unfortunately they are generally very expensive.
During the last years the general decrease of available resources has driven the researchers involved in the Cultural Heritage to
consider the performance of open-source software for 3D modelling purposes.
As a result, several open-source software for 3D modelling are today able to manage point-clouds, realise meshes and textures, etc.
In this scenario first of all some tests were performed on the two most popular open-source 3D modeling programs (Blender and MeshLab); moreover a 3D model using a commercial software (3DReshaper) was achieved in order to compare the different strategies and the achieved final results.
4.1 Blender
Blender was first conceived in December 1993 and became a usable product in August 1994 as an integrated application that enables the creation of a diverse range of 2D and 3D content. Blender provides a broad spectrum of modelling, texturing, lighting, animation and video post-processing functionality in one package. Through its open architecture, Blender provides cross-platform interoperability, extensibility and a tightly integrated workflow. Blender is probably one of the most popular open-source 3D graphics applications in the world. Originally developed by the company Not a Number (NaN), Blender has continued on as free software, with the source code available under the GNU GPL license.
Between 2008 and 2010, key parts of Blender were re-written to improve its functions, workflow and interface. The result of this work produced the version of the software known as Blender 2.65. Today a large community of users have a strong activity developed on several blogs for sharing information, data and scripts concerning the different problems and strategy for 3D modelling.
According to the trends of working using low-cost methodology and software (Alby, Grussenmeyer, 2011), this program was tested in order to realise a complete 3D model of a portion of the San Giovanni Church.
Two 3D modelling tests were performed: the first was the realisation of a model starting from the achieved 2D standard drawings. In the second test a 3D model was achieved using the TLS data.
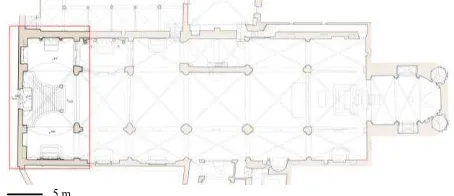
The analysed part of the church was the first portion of the central nave with the two lateral one (Figure 5).
As previously mentioned, the available data were the plan and two vertical sections (Figure 6). These data were employed for the realisation of the model based on the Constructive Solid Geometry (traditional architectural 3D modelling approach). During this first modelling phase according to the available material, the fundamental geometric rules were used in order to describe the church.
Figure 5. The analysed part of San Giovanni Church (in the red box)
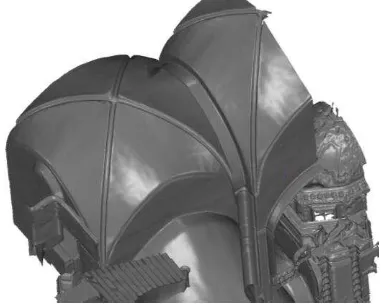
In particular the most demanding part was the realisation of the vaults surface since the geometry was complex and hard to find (at the end the surface was related to a cross vault with reduced
(a) (b)
(c) (d)
5 m
nails). In Figure 7 the final result of the achieved 3D model are reported.
Figure 6. Vertical sections employed for the 3D modelling phase
Figure 7 shows that the realised model is an ideal model: a smoothed surface achieved with elementary primitives without any imperfection. These products are very useful for the architectural planning or for low scale 3D modelling but when an architectural heritage building is represented, it is better to realise a 3D model with a more accurate modelling strategy such as mesh TIN or Nurbs.
These strategies could be productively followed when 3D native data are available; in the case of San Giovanni as mentioned before, the 3D TLS survey of the church was realised. As a consequence the 3D native data recorded from the Laser were employed in order to test a more accurate 3D modelling strategy.
As a standard option in Blender is not possible to realise a mesh starting from the point clouds. During the last years several scripts were realised and a script for point cloud processing was founded and employed for the test area (a Script to Skin a Point Cloud in http://blenderartists.org).
The achieved result using this script is shown in the Figure 8. Figure 8 shows that the scripts works very well, the shape of the object was described with an high accuracy (the check was realised on several Control Points measured with a Total Station showings discrepancies of less than 4 cm); unfortunately the step of the acquired point clouds doesn’t allow to define a continuous surface and as a consequence the achieved 3D model presents a lot of holes.
The tested script doesn’t enable the filling of the hole so with this strategy is not possible to improve the surface of the part of San Giovanni.
Figure 7. A general view of the achieved 3D model in Blender
In order to fill the achieved gaps, as no scripts were founded, first of all we are working to develop an ad hoc script for the founded problem; moreover, another modelling strategy using Blender was followed: the Particle System.
Figure 8. A general view of the achieved 3D model using the script
This methodology allows the assigning at each point of the clouds a solid object like a cube or a sphere with at dimension of about 5 cm; the result of the achieved model is reported in Figure 9.
If on the one hand this model seems to be interesting in terms of the representation of the complete shape of the surveyed object; is possible to state that this product is not suitable for Cultural Heritage documentation and knowledge because in these cases it is important to realise a continuous surface of the object in order to understand and extract the needed information.
Figure 9. 3D model obtained using the particle system strategy in Blender.
5 m
5 m
As for the realisation of this kind of model, since each point is carried out with a solid, a large amount of computational memory is needed and the data processing steps are very time consuming.
According to the realised tests, it is possible to state that the followed strategy using Blender shows some first interesting results for point cloud data processing. In particular, the tested script achieved very interesting results; naturally, some parts of the program need to be improved such as the management of a great amount of data (only few scans are easily handled from the software) and moreover the realisation of new tools for 3D mesh editing (filling holes, smoothing, filtering, etc) will be advantageous and desirable for TLS data management.
4.2 Meshlab
The MeshLab system was developed by Visual Computing Lab ISTI-CNR in the framework of the EPOCH Network of Excellence funded by the European Commission (Cignoni et al.,2008). MeshLab was designed as a general 3D mesh processing tool with three primary objectives:
• ease of use;
• Cultural Heritage/3D scanning oriented - the system should focus on mesh processing tasks instead of mesh editing and design where a number of fierce competitors already crowd the software arena; • efficiency.
MeshLab is an open source software heavily based on the VCG library1 developed at the aforementioned lab., for all the core mesh processing tasks and it is available for Windows, MacOSX, and Linux. MeshLab supports an ever-growing variety of 3D formats (all the most common ones are supported) to accommodate the broadest set of users. Once a mesh is loaded, the user can work on it by mean of a large set of direct parametric filters that perform smoothing, re-meshing and simplifying tasks either automatically or by means of interactive tools.
Multiple meshes can be loaded together or separately or jointly processed following an approach based on a layer’s metaphor. With the same aim of working with open source software as in the case of Blender, but only starting from TLS data a test of 3D modelling was performed in the same part of San Giovanni Church.
Several strategies for the realisation of a 3D model are available in MeshLab, the tested one, starting from the acquired point clouds, was the surface reconstruction: Ball-Pivoting (Bernardini, et al., 1999). The Ball-Pivoting Algorithm (BPA) computes a triangle mesh interpolating a given point cloud. Typically the points are surface samples acquired with multiple range scans of an object. The principle of the BPA is very simple: three points form a triangle if a ball of a user-specified radius, r, touches them without containing any other point. Starting with a seed triangle, the ball pivots around an edge (i.e. it revolves around the edge while keeping in contact with the edge’s endpoints) until it touches another point, forming another triangle. The process continues until all reachable edges have been tried, and then starts from another seed triangle, until all points have been considered. The relatively small amount of memory required by the BPA, its time efficiency, and the quality of the results obtained compare favourably with existing techniques (Bernardini et.al, 1999).
1The Visualization and Computer Graphics Library (VCG) is a open source portable C++
templated library for manipulation, processing and displaying with OpenGL of triangle and tetrahedral meshes.
Figure 10. Two views of the realised mesh by using MeshLab
As Figure 10 shown the obtained results are very interesting, the mesh is accurate (check on CPs less than 3 cm), and the surface is clearly modelled. However we found some problems in the management of the point clouds. If more than two scans are inserted in the software the program crashes (Callieri et al.,2011). The tests are still in progress in order to improve the modelling surface and the consequent final 3D model.
4.3 3DReshaper
In order to achieve a complete 3D model of the analysed portion of San Giovanni Church, a commercial software specifically designed for laser scanner data processing was used. The employed program was 3D Reshaper from Technodigit (an Hexagon metrology company). This software is able to realise 3D models starting from point clouds using the meshing approach. Using this software the management of all the editing phases concerning the mesh such as: noise reduction, hole filling, smoothing etc., is very simple.
Moreover, the textures tool enables the realisation of 3D photorealistic models by means of a rigorous multi-image photogrammetric approach based on the information concerning the internal parameters of the camera (lens distortions, focal length, PP coordinates) and the external orientation information (X,Y,Z, , , ) derived from a bundle block adjustment realised in a whichever photogrammetric software (Stathopoulou et.al., 2011).
Using 3D Reshaper the modelling phases were followed in order to realise the 3D model of the analysed part of the church. The final result is reported in Figure 11.
Figure 11. View of the achieved 3D model using Reshaper
As shown in the previous figure the achieved model realised in 3DReshaper accurately reproduces the real shape of the first
part of San Giovanni Church. The model was realised using the same scans employed in Blender and MeshLab, with some editing phases. As usual, with this commercial program, it is possible to realise with a high detail complete 3D model starting from TLS point clouds (the performed check on some CPs shown discrepancies less than 2 cm).
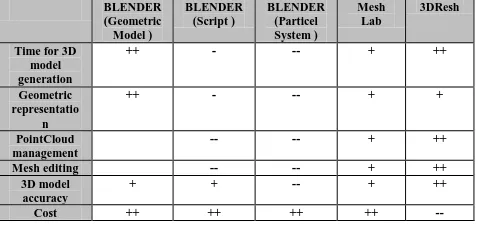
According to the achieved results using all the employed
Table 1. A comparison of the achieved 3D models using the different software packages
5. CONCLUSIONS
As in the last decade the papers and discussions were focused on the TLS data processing (registration, filtering, integration with RGB data etc.); today the main objectives are the data extraction for 2D representation and the 3D modeling techniques. The 2D representation is now oriented in the extraction of images from the point clouds (orthophoto or similar products) that enable the realisation of traditional drawing using CAD software. This methodology is more favourable than the extraction of point cloud section because it is able to combine the metric contents of the scans with the radiometric information derived from the acquired images. The approach followed during the 2D drawing realisation of the San Giovanni Church was the aforementioned one. According to the achieved results, is possible to state that with an accurate integration of direct measurements and geometric considerations the results are very satisfying . On the other hand the realisation of 2D drawing is very time consuming. In the reported research for the plan and the 7 vertical sections two operators were employed for two months in order to achieve the final drawing. The other post-processing phase allowed with TLS data is the 3D modelling. This step in the Cultural Heritage scenario, is an important and critical part of data processing since different approaches could be followed. The first one called Constructive Solid Geometry (CSG) is a technique used in solid modeling. Constructive solid geometry allows a modeller to create a complex surface or object by using Boolean operators to combine objects. Often CSG presents a model or surface that appears visually complex, but is actually little more than cleverly combined or decombined objects. With these techniques the modelled objects presents smoothed and regular surfaces achieved with elementary primitives that in most cases doesn’t represent the real shape of the Architectural Cultural Heritage that is characterised by irregular surfaces. In order to overcome these problems a second generation of 3D modelling software based on more accurate surfaces (Mesh,Tin, Nurbs, etc.) have been developed in the last years. The main problem of these software is the cost, for this reason in the present paper some tests were performed on two open-source software. The first results are promising. The tools achieved in these
open-source programs are able to realise accurate and suitable surfaces. The most important problems founded during the data processing were related to the management of large amounts of data and in the difficult of mesh editing when large gaps in the final 3D model were observed. On the contrary, using commercial software these problems are overcome and the final models are accurate and complete.
Finally, it is important to underline that the tests will be carry on since working with open-source software and improving the existing programs with tools, scripts and an active participation on the web community is an important incentive that all scientific communities need to support. One of the main goal is to help the development and the usability of the 3D data for 32. DOI - 10.1260/2047-4970.1.0.27
Guidi, G., Remondino, F., Russo, M., Menna, F., Rizzi, A., Ercoli, S., 2009. A multi resolution methodology for the 3D modeling of large and complex archaeological areas. Int. Journal of Architectural Computing, 7(1), pp. 40-55.
Manferdini A.M., Remondino F., A Review of Reality-Based 3D Model Generation, Segmentation and Web-Based Visualization Methods, IJHDE, Volume 1, pp. 103-124. DOI - 10.1260/2047-4970.1.1.103 model,modelling methods based on architectural knowledge applied to fortress of Châtel-sur-Moselle (France). ISPRS Archives Volume XXXIX-B5, pp.75-80.
Bernardini, F., Mittleman, J., Rushmeier, H., Silva, C., Taubin, G.,1999. The Ball-Pivoting Algorithm for Surface Reconstruction,IEEE Transactions on Visualization and Computer Graphics, V. 5, pp.349-359
Callieri, M., Cignoni, P., Dellepiane, M., Ranzuglia, G., Scopigno, R., 2011. Processing a Complex Architectural Sampling with MeshLab: the case of Piazza Della Signoria. ISPRS Archives, Volume XXXVIII-5/W16.
Cignoni, P., Callieri, M., Corsini, M., Dellepiane, M., Ganovelli, F., Ranzuglia ,G., 2008. MeshLab: an open-source mesh processing tool. Proceedings Eurographics Italian Chapter Conference , pp. 129 - 136.
Stathopoulou, E. K., Valanis, A., Lerma J. L., Georgopoulos, A., 2011.High and low resolution textured models of complex architectural surfaces.ISPRS Archives, Volume XXXVIII-5/W16, ISPRS Trento 2011 Workshop, 2-4 March 2011, Trento, Italy.
Acknowledgements
The authors wish to acknowledge Andrea Monteleone for his support in the 3D modeling phase.