SENSITIVITY ANALYSIS IN THE RETRIEVAL OF TURBID COASTAL WATER
BATHYMETRY USING WORLDVIEW-2 SATELLITE DATA
S. C. Liew*, C. W. Chang, L. K. Kwoh
Centre for Remote Imaging, Sensing and Processing (CRISP), National University of Singapore, Blk. S17 Level 2, Lower Kent Ridge Road, Singapore 119076
(crslsc, crsccw, crsklk,)@nus.edu.sg
Commission VII/1
KEY WORDS: Bathymetry, turbid waters, ocean color
ABSTRACT:
The recently launched Worldview-2 satellite provides high resolution (2-m multispectral) data in eight spectral bands in the visible to near-infrared region. The additional spectral bands provide an opportunity to test several algorithms for retrieving the water depth, bottom albedo and intrinsic optical properties of coastal sea water. In a previous work (Liew et al., 2011) we reported our attempts in retrieving water depth and bottom albedo using WorldView-2 data for the purpose of coastal habitat mapping. In this paper, we investigate the sensitivity and limitations in using WorldView-2 spectral bands for bathymetry retrieval in turbid coastal waters. For typical coastal waters with a dark seabed, the most sensitive band is the Green Band which is sensitive to water depth up to about 5.3 m. For coastal waters with a bright sandy seabed, the Red and Yellow Bands are the most sensitive, but the maximum sensitive depth is reduced to about 2.4 m.
* Corresponding author.
1. INTRODUCTION
High spatial resolution satellite sensors are usually designed for land applications. These sensors typically have a small number of broad spectral bands. Ideally, hyperspectral data are preferable for retrieving water optical properties and water depth (Lee et al., 2002) as the complete water reflectance spectra are available for fitting with specific models of water reflectance. Despite the limited number of spectral bands, attempts have been made in deriving the intrinsic optical properties, water depth and sea bottom albedo using data from high resolution satellites such as the SPOT-5 satellite (Liew and He, 2008) which has 4 spectral bands in the green, red, near infrared and short-wave infrared regions. The recently launched WorldVview-2 satellite sensor has 8 spectral bands and holds the potential to be used for deriving optical properties and bathymetric maps from littoral zone waters. In our previous work, bathymetric and coastal habitual maps were derived from WorldView-2 images (Liew et al., 2011).
For deriving the optical properties of water, most ocean colour satellite sensors have spectral bands with a narrow bandwidth of about 10 to 20 nm. The spectral bands are selected at different positions to pick up absorption signatures of phytoplankton and to overcome the non-linear relationships between ocean colour and optical properties of various constituents. It will be of interests to evaluate possible limitations due to the broad bandwidth in deriving optical properties and bathymetric maps using data from the WorldView-2 satellite sensor.
In this paper, we used well-known semi-analytical equations (Lee et al., 2002) to simulate the remote sensing reflectance of coastal waters at high spectral resolution. The water leaving radiance spectrum was computed and aggregated into the effective in-band radiance for each spectral band of the
WorldView-2 sensor using the sensor’s relative spectral response functions. The in-band radiance of each spectral band was converted to the effective reflectance. We then performed sensitivity analysis of the effective reflectance of each spectral band with respect to the change in water depth.
2. WORLDVIEW-2 SENSOR
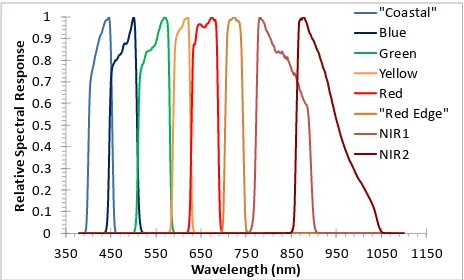
The WorldView-2 satellite sensor has 8 multispectral bands at 1.84 meter resolution. The average spectral bandwidth is about 50 nm for the first six bands and about 100 nm for the last two near-infrared bands. The relative spectral response curves of the 8 spectral bands are shown in Figure 1. The wavelengths and bandwidths are listed in Table 1.
3. SHALLOW WATER REMOTE SENSING
REFLECTANCE MODEL
The remote sensing reflectance just below the water surface is a sum of two components (Lee et al., 1998; Lee et al., 1999),
rrs( ) rw( )[1 exp( MKH)] b( )exp(MKH)
(1)
The first component is due to scattering from the bulk water characterized by the deep water reflectance rw() related to the water absorption and backscattering coefficients, a() and
) ( b
b and two constant parameters g0 and g1via the equations (Gordon et al. 1988),
rw()[g0g1u()]u(), (2)
) ( ) (
) ( )
(
b b
b a
b
u . (3)
International Archives of the Photogrammetry, Remote Sensing and Spatial Information Sciences, Volume XXXIX-B7, 2012 XXII ISPRS Congress, 25 August – 01 September 2012, Melbourne, Australia
The second component is related to the seabed reflectance
350 450 550 650 750 850 950 1050 1150
Re
Figure 1. The relative spectral response curves of the 8 multispecral bands of the WorldView-2 satellite sensor.
Band No.
Band Name Effective Wavelength
Table 1. Effective wavelengths and bandwidths of the WorldView-2 spectral bands.
The other parameters common to both components in the equation (1) are the water depth H, effective attenuation coefficient K
K()a()bb(), (5) and the geometric path length factor M,
M1/cosv1/coss, (6) where v.s are respective the in-water sensor view angle and solar zenith angle.
The absorption and backscattering coefficients of water is a linear combination of various optically active constituents. bb()bbw()bbp() (7) a()aw()ag()a() (8)
where the subscripts w, g, p and refer to water, coloured dissolved organic matter (CDOM) and phytoplankton respectively. The absorption and backscattering coefficients of each component are computed according to the commonly used bio-optical models (Lee et al., 1999), with the following water quality parameters: G (CDOM absorption coefficient at 440 nm), X (particulate matter backscattering coefficient at 550 nm), and P (phytoplankton absorption coefficient at 440 nm).
The above water reflectance can then be calculated according to (Lee et al., 2002),
The in-band effective reflectance of each WorldView-2 spectral band is computed by aggregating the above-water spectral reflectance Rrs() using the respective relative spectral
where the subscript i is the band number. The lower and upper wavelength limits of integration are, respectively, l380nm and u1100nm.
4. RESULTS
The in-band effective reflectance of coastal sea water was calculated for each of the first six WorldView-2 spectral bands using equations described in the previous section. The values of
the water quality parameters were set to G0.4m-1,
P . These are the typical values for coastal waters in the Singapore Strait southwest of the Singapore main island. The path length parameter was set at M2.1 and the reflectance was calculated for water depth varying from 0.1 m to 10 m. Two values of the seabed albedo, A0 and A0.2 were used, representing cases with a dark (muddy) and bright (sandy) sea bottom respectively.
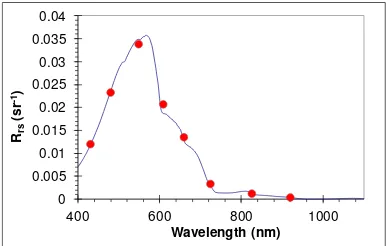
Figure 2 shows the typical reflectance spectrum of coastal sea water with a bright sandy sea bottom and water depth H = 2 m. The solid line is the computed reflectance spectrum (equation 9) while the red circles are the in-band effective reflectance of the eight WorldView-2 spectral bands (equation 10) plotted at their respective effective wavelength (Table 1).
The in-band reflectance values of coastal sea water with a dark seabed for the first 6 spectral bands of WorldView-2 are plotted as functions of the water depth in Figure 3. The reflectance generally increases monotonically with water depth for all the spectral bands plotted. The Green band (Band 3) has the highest reflectance and the reflectance values fall off at shorter and longer wavelengths. The reflectance seems to saturate (i.e. does not change with increasing water depth) after a certain threshold depth. This threshold depth is a function of the spectral band.
International Archives of the Photogrammetry, Remote Sensing and Spatial Information Sciences, Volume XXXIX-B7, 2012 XXII ISPRS Congress, 25 August – 01 September 2012, Melbourne, Australia
The derivative of the in-band reflectance Ri with respect to water depth (Figure 4) can be used as an indicator of the depth sensitivity of each spectral band. Figure 4 indicates that the Green band (Band 3) has the highest depth sensitivity for the typical turbid coastal water with a dark seabed. For this type of sea water, the peak reflectance is about 0.04 sr-1. Suppose that the noise level is one percent of the peak value, and that a depth resolution of 0.25 m is desired, then the depth derivative of reflectance must have a value greater than about 0.0016 sr-1 m-1 in order. Figure 4 shows that the Green Band meets this requirement for water depth up to 5.3 m. The Green Band is the most penetrative and the depth sensitivity (and hence the penetration depth) decreases towards the blue end of the spectrum as the absorption coefficient is high in this part of the spectrum due to absorption by CDOM. The depth sensitivity also decreases towards the red end of the spectrum due to the high absorption by water itself.
0
Figure 2. A typical reflectance spectrum of coastal sea water with a bright sandy bottom and 2 m water depth. The solid blue line is the computed spectrum while the red dots are the in-band effective reflectance of WorldView-2 plotted at their respective
effective wavelengths.
Figure 3. Variation of reflectance with water depth for the first 6 spectral bands of WorldView-2 for coastal sea water with a
dark seabed.
Figure 4. Derivative of reflectance with respect to water depth for the first 6 spectral bands of WorldView-2 for coastal sea
water with a dark seabed.
-0.01
Figure 5. Derivative of reflectance with respect to water depth for the first 6 spectral bands of WorldView-2 for coastal sea
water with a bright sandy seabed.
Figure 5 shows the depth derivative of reflectance for the typical sea water with a bright sandy seabed. The derivative mostly has negative values because now the reflectance generally decreases with increasing water depth. The depth sensitivity of each spectral band is indicated by the absolute value of the derivative. For coastal sea water with a bright sandy sea bed, the Red and Yellow bands have the best depth sensitivity. They are capable of probing water depth up to 2.4 m. All other bands are not sensitive to a change in water depth beyond about 1 m. Table 2 lists the maximum depth for each spectral band where the absolute value of the depth derivative of reflectance exceeds the threshold value of 0.0016 sr-1 m-1.
Band No.
Band Name Maximum depth (m),
Table 2. Maximum depth where the absolute value of depth derivative of reflectance exceeds 0.0016 sr-1 m-1 for the first six
spectral bands of WorldView-2, for typical coastal sea waters with dark and bright seabed.
International Archives of the Photogrammetry, Remote Sensing and Spatial Information Sciences, Volume XXXIX-B7, 2012 XXII ISPRS Congress, 25 August – 01 September 2012, Melbourne, Australia
5. CONCLUSIONS
The systematic analysis of the simulated reflectance of typical coastal sea water reveals the most effective bands of the WorldView-2 satellite sensor that can be used for retrieval of water depth and the limiting depth that can be derived from each spectral band. For water with a dark seabed, the Green band has the most depth sensitivity for depth up to about 5 m. For the case of a bright seabed, the Red and Yellow bands are the most sensitive, but the maximum depth is reduced to about 2.4 m. In both cases, the maximum depth is generally greater than 1 m for most bands. In cases where the depth sensitivity is low, the spectral bands are still useful for derivation of water optical parameters.
References from Journals:
Gordon, H. R. et al. (1988). "A Semianalytic Radiance Model of Ocean Color." Journal of Geophysical Research-Atmospheres 93(D9): 10909-10924.
Lee, Z. et al. (2002). "Deriving Inherent Optical Properties from Water Color: a Multiband Quasi-Analytical Algorithm for Optically Deep Waters." Appl. Opt. 41(27): 5755-5772.
Lee, Z. P. et al. (1998). "Hyperspectral remote sensing for shallow waters. I. A semianalytical model." Applied Optics 37(27): 6329-6338.
Lee, Z. P. et al. (1999). "Hyperspectral remote sensing for shallow waters: 2. Deriving bottom depths and water properties by optimization." Applied Optics 38(18): 3831-3843.
Liew, S. C. and J. He (2008), "Uplift of a coral island in the Andaman Sea due to the 2004 Sumatra earthquake measured using remote sensing reflectance of water," IEEE Geoscience and Remote Sensing Letters 5(4): 701-704.
Liew, S. C. et al. (2011). "Estimating Water Optical Properties, Water Depth and Bottom Albedo Using High Resolution Satellite Imagery for Coastal Habitat Mapping." 2011 Ieee International Geoscience and Remote Sensing Symposium (Igarss): 2338-2340.
International Archives of the Photogrammetry, Remote Sensing and Spatial Information Sciences, Volume XXXIX-B7, 2012 XXII ISPRS Congress, 25 August – 01 September 2012, Melbourne, Australia