THE CONTRIBUTION OF GIS IN FLOOD MAPPING:
TWO APPROACHES USING OPEN SOURCE GRASS GIS SOFTWARE
R. Marzocchi a, *, B. Federici b, M. Cannata c, T. Cosso a, A.Syriou a
a
Gter srl Innovazione in Geomatica, GNSS e GIS, Genova (Italy) - [email protected] b
DICCA, Department of Civil, Chemical and Environmental Engineering, University of Genova (Italy) c
IST-SUPSI, Institute of Earth Sciences – University of Applied Science of the Italian Switzerland (Switzerland)
KEY WORDS: Spatial Information Sciences, Hazards, DEM/DTM, Disaster, Open Systems
ABSTRACT:
The first step of a risk assessment analysis is the evaluation of flood-prone areas. Its importance is considered for both managing and planning emergency activities, such as hydraulic risk reduction management, and also town planning. Nowadays, using GIS technology for risk assessment analysis is very common. However, it is not widely used for defining inundated areas. LiDAR data, such as Digital Elevation Models (DEM), makes GIS numerical models attractive methods for obtaining a flooded area automatically. Using GIS tools, is beneficial for effective processing and accuracy assessment in comparison to the traditional methods which are based on topographic maps and field surveys.
A first approach (Federici & Sguerso, 2007; Marzocchi et al. 2009) is the use of a GIS module in order to create perifluvial flood maps, having as prerequisites (i) the conformation of the river floodplain by a high resolution DEM and (ii) a water surface profile along the river axis calculated for a given water discharge through a generic one-dimensional (1D) hydraulic model (HEC-RAS, Basement, MIKE 11, etc). On the other hand, a second approach is the use of a 2D model GIS embedded in order to create flooded areas due to a dam break (Cannata & Marzocchi, 2012). This module solves the conservative form of the 2D Shallow Water Equations (SWE) using a Finite Volume Method (FVM). The intercell flux is computed by a one-side upwind conservative scheme extended to a 2D problem (Ying et al., 2004). The new developed GIS module gives as an output maximum intensity maps which can be directly used during the risk assessment process. Both models implemented in GRASS GIS software (GRASS, 2013) and two new commands (r.inund.fluv and r.damflood) have been created. They are all available on the official GRASS website and they are distributed under the terms of the GNU General Public License (GPL).
In this work we present a comparison between the two models mentioned above. We analyse the possibility of integrating these two approaches. We intend to use the 1D model, GIS embedded if possible, to calculate the water surface profile along the river axis and the 2D numerical one to analyse inundation beside the river levees.
1. INTRODUCTION
Maps give a direct and strong impression of the spatial distribution of the flood risk. Thus, maps are valuable for presenting and assessing a flood situation, providing information for several applications related to disaster management. The use of GIS software is recommended for risk assessment analysis (Pirotti et al., 2011), due to the existence of a large amount of geographical data (Digital Elevation Models – DEM, population density maps, etc.).
Recently, we developed a group of new GIS modules for hazard flood mapping assessments. In particular, we implemented a GIS command which uses the results of a 1D hydrodynamic model to obtain river flood maps. We also developed a GIS embedded hydrodynamic numerical model to evaluate flood maps in case of a dam break.
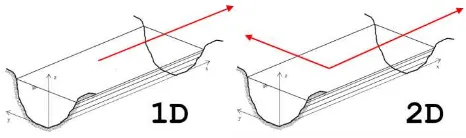
Figure 1. 1D and 2D models analyzing river flow
In both cases, we use the Geographic Resources Analysis Support System (GRASS, 2013) software. GRASS is a high-quality free open source geospatial software, which allows the adoption of innovative and interoperable solutions which is one of the main advantages of open systems (Pirotti et al., 2011). The two modules are not yet integrated, although our aim, in future research steps, is to combine them obtaining a quasi-2D GIS embedded command for river flooding maps.
2. USE OF GIS FOR FLOOD MAPPING
2.1 Combination of a 1D hydrodynamic model with a GIS module
We calculate the water surface profile along the axis of the river flow using an existing 1D numerical model (HEC-RAS, Basement, MIKE 11, etc). Therefore, we evaluate the flood map using a DEM as a GIS input. This innovative process indicates various hypotheses which are explained below, considering the flooding phenomenon as 2D.
We outline 4 different phases, all of which are automatically executed using bash shell scripting language and creating the new GRASS command r.inund.fluv (Marzocchi et al. 2009). This module is distributed under the terms of the GNU General Public License and it can be downloaded for free from GRASS official website (GRASS Addons).
The International Archives of the Photogrammetry, Remote Sensing and Spatial Information Sciences, Volume XL-5/W3, 2013 The Role of Geomatics in Hydrogeological Risk, 27 – 28 February 2013, Padua, Italy
This contribution has been peer-reviewed. doi:10.5194/isprsarchives-XL-5-W3-175-2013
Figure 2. The result of a 1D hydrodynamic model (a water surface profile along the river axis) is used as input of the
r.inund.fluv GIS module to obtain flooding maps.
In the first phase, having acquired the water level values (points) alongside the river axis as a previous result of the hydrodynamic model, we assign them to each cell of the surrounding region using the spatial interpolation method of Thiessen Polygons. As a result we have a flood map (Pirotti et al., 2013), displaying the comparison between elevation (DTM) and the water level of each cell. If the water level value is higher than the one of the terrain elevation, the cell is identified as a flooded or inundated area (hazard), otherwise it is considered as a dry area (not hazard).
In the second phase, the cells which are considered inundated as mentioned in the first phase, but are totally surrounded by dry cells, are considered as a dry area.
In the third phase, we examine the river levees or other obstructions preventing the water flow. Up to this step, we take for granted that water diffuses perpendicular to the river flow direction, towards the surrounding areas. At this point the inundated cells, mentioned in the previous phases, located behind an obstacle, are considered as a dry area.
In the fourth and last phase, we are based on the fact that water which not follows the main river channel, diffuses alongside the maximum terrain slope direction. Therefore, dry cells mentioned in the 3rd phase, are defined as inundated areas because water can reach them through those 2D maximum slope paths.
A first validation process is performed (Federici et al., 2007) for the Tanaro River (approximate length: 120 km, Italy). The tool is also applied to Roggia Scairolo, a stream in the Ticino Canton, for the evaluation of flood hazards (Pozzoni et al., 2009).
2.2 2D approach
A second approach is the use of a 2D GIS embedded model in order to create flooded areas. This model is implemented in order to calculate flood maps in case of a dam break solving the Shallow Water Equations (SWE). The SWE, in their general conservative form (Kinmark, 1985), are described as below:
S g = gravitational acceleration [9.81 m/s2],
Z = source vector,
n = source vector Manning’s roughness coefficient [s/m1/3].
The equations (1) are solved using a Finite Volume Method (FVM). The inter-cell flux is computed on a 2D (raster) grid by the one-side upwind method - Upwind Conservative Scheme (UCS) (Ying et al., 2004).
By integrating equations (1), we obtain the following discrete formulas as a function of time (t):
direction, respectively [m],Fi,j+½ - Fi,j-½ - Gi-½,j - Gi+½,j = the intercell fluxes along the East and North directions.
The International Archives of the Photogrammetry, Remote Sensing and Spatial Information Sciences, Volume XL-5/W3, 2013 The Role of Geomatics in Hydrogeological Risk, 27 – 28 February 2013, Padua, Italy
This contribution has been peer-reviewed. doi:10.5194/isprsarchives-XL-5-W3-175-2013
Figure 3. Intercell fluxes of a generic cell i,j (G=north direction fluxes, F=East direction fluxes)
Equations (3) are then solved on a raster regular grid (Cannata & Marzocchi, 2011).
A first validation process is performed (Cannata & Marzocchi 2012) for the Verzasca Dam (Switzerland). The module is also applied in the Canaria Valley (Swizerland) for the evaluation of flood hazards, comparing the results with an other commercial model (Baruffini et al., 2011).
3. MODELS
The 1D model is associated with the river analysis. We perform assessments of the river geometry, using existing numerical models (for example MIKE 11, HEC-RAS, etc.) and specific tools allowing the user to insert any type of external structures along the river flow axis (such as GPS cross sections, bridges, dams, etc.).
Considering river structures as a boundary condition of a hydrodynamic model is fundamental in order to obtain reliable data of the water depth within the river channel. The geometry of the river obstructions can be considered as an input, using the advanced functions of existing hydrodynamic software for river analysis such as HEC-RAS. On the other hand, importing geometric data from a GIS and export results to a GIS for further risk assessment analysis, are both complicated and error-prone procedures. Some GIS tools have been recently implemented (Buntz, R , 1998; Chiraz & Ricci, 2008) for inserting river cross sections data and managing results of a hydrodynamic model. Nevertheless in most cases, most of the information needed to perform river hydrodynamic computations has to be collected during specific topographical surveys.
Concerning dam break scenarios, where the influence of integrated river structures (such as bridges) is minor, we tend to use r.damflood module for two reasons: because it is 2D and because the analysis is simpler as it only requires DTM information including the bathymetry of the artificial lake. The 2D river model is not developed yet so it cannot be used for risk assessment.
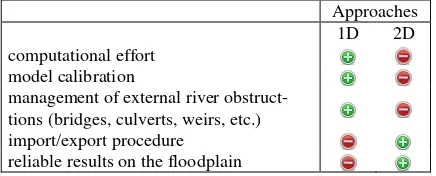
Approaches 1D 2D computational effort
model calibration
management of external river obstruct-tions (bridges, culverts, weirs, etc.) import/export procedure
reliable results on the floodplain
Table 1. Pros and cons of the GRASS modules.
Our assumption is that the quasi-2D approach (1D hydrodynamic model + GIS module) is more suitable, even if its application is more complex and not totally 2D.
4. CONCLUSION AND FUTURE WORK
This work focuses on two different models (r.inund.fluv and r.damflood) that we have implemented in GRASS platform. The next research step will be to combine these two modules creating a quasi-2D method (see also Bates & De Roo, 2000; Kazama et al., 2007).
Channel flow can be handled using the 1D model as it is more suitable for describing the propagation of a floodwave in the river and its interaction with any artificial structures (bridges, etc.). In case floodplain flow is present, it can be described with a 2D approach, solving the continuity and flow equations over a discrete square grid as in the case of the r.damflood command. This integration can also be conducted in GRASS platform using its highly advanced geographic libraries as well as the libraries for the shallow water equations which we have recently implemented (Cannata et al., 2012).
Figure 4. Possible integration between the 1D and the 2D models. The 1D approach can be used within the flow channel,
while the 2D numerical solution can be used to analyse inundation alongside the river levees on the floodplain.
REFERENCES
Baruffini, M., Pozzoni, M., Marzocchi, R., 2011. Analysis of potential effects of dam break flooding using a GIS-tool for risk assessment in mountain regions. An exploratory study on an hypothetical event: the Val Canaria flood. Proceedings of the VIII Forum Italiano di Scienze della Terra, Torino, 4 p. 49.
Bates, P.D., De Roo, A.P.J., 2000. A simple raster-based model for floodplain inundation. Journal of Hydrology, 236, 54-77 .
Buntz, R., 1998. Preparing for El Niño: Integrating the HEC RAS hydraulic model with ArcView GIS. Arc User Magazine 3, pp. 14–17.
Cannata, M., Marzocchi, R., 2012. Two-dimensional dam break flooding simulation: a GIS embedded approach. Natural Hazards, 61(3), pp.1143-1159
Cannata, M., Marzocchi, R., Molinari, M.E., 2012. Modeling of Landslide-Generated Tsunamis with GRASS. Transactions in GIS, 16(2), pp. 191-214
Chiraz, P., Ricci, A., 2008. Verifiche idrauliche: Processi di automazione ed interoperabilità a livello dati tra GRASS ed HEC-RAS, IX Meeting degli Utenti Italiani di GRASS GIS – GFOSS, Perugia.
Federici, B., Sguerso, D., 2007. Procedura automatica per la creazione di mappe di potenziale inondazione fluviale. Bollettino SIFET, 4, pp. 25-42.
The International Archives of the Photogrammetry, Remote Sensing and Spatial Information Sciences, Volume XL-5/W3, 2013 The Role of Geomatics in Hydrogeological Risk, 27 – 28 February 2013, Padua, Italy
This contribution has been peer-reviewed. doi:10.5194/isprsarchives-XL-5-W3-175-2013
GRASS Development Team, 2013. Geographic Resources Analysis Support System (GRASS) Software, Version 6.4.3. http://grass.osgeo.org
GRASS add-ons website:
http://grass.osgeo.org/wiki/GRASS_AddOns – GRASS version 6.4
Kazama, S., Hagiwara, T., Ranjan, P., Sawamoto, M., 2007. Evaluation of groundwater resources in wide inundation areas of the Mekong River basin. Journal of Hydrology 340 pp.233-243.
Kinnmark, I.P.E., 1985. The shallow water equations: formulation, analysis and application. In: Brebbia C A and Orszag S A (eds) Lecture Notes in Engineering, Volume 15. Berlin, Springer- Verlag: 1–187.
Marzocchi, R., Federici, B., Sguerso D., 2009. Procedura automatica per la creazione di mappe di potenziale inondazione fluviale in GRASS: il modulo r.inund.fluv. Atti del IX Meeting degli Utenti Italiani di GRASS-GFOSS 21-22 febbraio 2008, pp. 161-178
Pirotti, F., Guarnieri, A., Vettore, A., 2011. Collaborative Web-GIS design: a case study for road risk analysis and monitoring. Transactions in GIS 15(2), 213-226.
Pirotti, F., Guarnieri, A., Vettore, A. 2013. State of the art of ground and aerial laser scanning technologies for high-resolution topography of the earth surface. European Journal of Remote Sensing 46: pp. 66-78.
Pozzoni, M., Marzocchi, R., Graf, A., 2009. Roggia Scairolo – Zonazione della pericolosità per alluvionamento. Technical report of Institute of Earth Sciences.
Ying, X., Khan, A., Wang, S.S.Y., 2004. Upwind conservative scheme for the Saint Venant Equations. Journal of hydraulic engineering 10: 977-98.
The International Archives of the Photogrammetry, Remote Sensing and Spatial Information Sciences, Volume XL-5/W3, 2013 The Role of Geomatics in Hydrogeological Risk, 27 – 28 February 2013, Padua, Italy
This contribution has been peer-reviewed. doi:10.5194/isprsarchives-XL-5-W3-175-2013