APPLICATION OF SENSOR FUSION TO IMPROVE UAV IMAGE CLASSIFICATION
S. Jabari a, F. Fathollahi a, Y. Zhang a
a CRC Laboratory in Advanced Geomatics Image Processing, Department of Geodesy and Geomatics Engineering, University of
New Brunswick, 15 Dineen Dr, P.O. Box 4400, Fredericton, New Brunswick, CANADA E3B 5A3
KEY WORDS: Image Fusion, UNB Pansharp, Image Classification, UAV Imagery
ABSTRACT:
Image classification is one of the most important tasks of remote sensing projects including the ones that are based on using UAV images. Improving the quality of UAV images directly affects the classification results and can save a huge amount of time and effort in this area. In this study, we show that sensor fusion can improve image quality which results in increasing the accuracy of image classification. Here, we tested two sensor fusion configurations by using a Panchromatic (Pan) camera along with either a colour camera or a four-band multi-spectral (MS) camera. We use the Pan camera to benefit from its higher sensitivity and the colour or MS camera to benefit from its spectral properties. The resulting images are then compared to the ones acquired by a high resolution single Bayer-pattern colour camera (here referred to as HRC). We assessed the quality of the output images by performing image classification tests. The outputs prove that the proposed sensor fusion configurations can achieve higher accuracies compared to the images of the single Bayer-pattern colour camera. Therefore, incorporating a Pan camera on-board in the UAV missions and performing image fusion can help achieving higher quality images and accordingly higher accuracy classification results.
1. INTRODUCTION
Currently, one of the most common colour camera sensor types in the UAV camera industry is the Bayer-filtered colour sensor (Walker and Blaschke 2008). In contrast to remote sensing sensors that have separate sensor-chips for different spectral bands, the Bayer-filtered sensors are limited to only one sensor chip with pixels covered by either of RGB (Red-Green-Blue) spectral filters to achieve simultaneous exposure on the imaging sensor (Aasen et al. 2015; Verhoeven 2010). Using the de-Bayering methods the image of the one-chip sensor is converted to a 3-band RGB image (Menon, Andriani, and Calvagno 2007). Due to the spectral filtering and de-Bayering effects, the resulting RGB image has lower quality compared to that of a Pan (also referred to as monochrome) camera with the same pixel size. Pan cameras have full resolution with no colour filter on the pixels and cover the whole visible and even a portion of the Near-Infrared (NIR) spectrum. Thus, the image quality, including Signal to Noise Ratio (SNR), sharpness, and spatial resolution, of Pan images is higher than the similar colour images generated by an equivalent Bayer-pattern sensor (Jabari et al. 2017; Zhang et al. 2016). However, Pan images are limited to only one single band and therefore have a low spectral resolution.
To benefit from the high SNR, resolution, and sharpness of the Pan sensors as well as from the high spectral resolution of the colour sensors, in our previous publications (Jabari et al. 2017; Khiabani 2015; Zhang et al. 2016), we proposed the use of image fusion of one Pan and one Bayer-filtered colour or MS sensor. We have proved that this fusion can:
• Increase the SNR of colour (or MS) image to the level of the Pan image.
• Increase the spatial resolution and sharpness of colour (or MS) image to that of the Pan image.
• Collect multi-spectral image, i.e. B, G, R, and NIR, instead of traditional Bayer-pattern RGB.
In our previous publication (Jabari et al. 2017), we proposed two separate configurations for the UAV system: Configuration 1: a Pan camera plus a colour Bayer-filtered camera (Vpan-RGB configuration), Configuration 2: a Pan camera plus a NIR-RGB filtered camera (Pan-NNIR-RGB configuration). For image
fusion, the UNB-Pansharp method is used (Zhang 2004). The application of NRGB sensors have been previously studied in image processing (Chen, Wang, and Liang 2014). However, in our work we assessed fusing the images of such a sensor and a Pan sensor.
In our proposed configurations, we preferred using colour/NRGB cameras whose pixel size is larger (around two times) than the Pan camera. This is to compensate for the low SNR of the colour/NRGB sensors due to the existing spectral filters. To prove that the efficiency of the outputs of the proposed configurations are higher than an equivalent colour camera, we compared our results with the images generated by a High-Resolution Colour (HRC) camera which has the same pixel size, generation, and make as the Pan camera. In our previous publication (Jabari et al. 2017), the quality assessment was done using images taken in lab conditions. As an extra quality assessment parameter, the image classification accuracies were also tested using a small board containing live and artificial leaves in the imaging target (Jabari et al. 2017). In this study, we further expanded the use of proposed configurations, by testing the camera-sets in outdoor conditions. The higher amount of light in outdoor images, around 2000 lx, compared to in-lab images, around 300 lx, could result in better classification results in HRC images that would reduce the need of sensor fusion. To test whether the proposed configuration also works in highlight outdoor conditions, we generated the Vpan-RGB and Pan-NRGB combinations in outdoor scenes and compared the fused results to the images of the corresponding HRC camera captured in the same imaging conditions. The both configuration images along with the HRC images were classified using the same ROIs (Regions Of Interest) using the Support Vector Machine (SVM) classification method. For numerical accuracy assessment, Kappa coefficient, overall accuracy (OA), user’s accuracy (UA), and producer’s accuracy (PA) are calculated. The results proved that the fused images have around 5-40% higher accuracies (Kappa coefficient) compared to standard Bayer-filtered HRC images. This study proves that the previously proposed sensor fusion concept improves imaging quality in outdoor conditions as well. Besides, we can benefit from an extra high resolution NIR band in NRGB MS sensors, which is an essential element in image classification applications.
The International Archives of the Photogrammetry, Remote Sensing and Spatial Information Sciences, Volume XLII-2/W6, 2017 International Conference on Unmanned Aerial Vehicles in Geomatics, 4–7 September 2017, Bonn, Germany
This contribution has been peer-reviewed.
2. METHODOLOGY
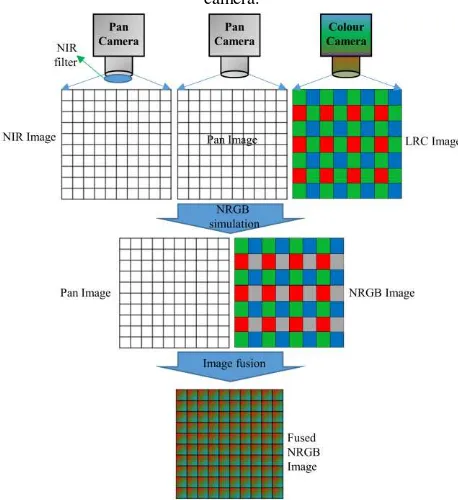
The flowchart of the two configurations of this work are presented in Figure 1 and 2. To produce the images of configuration 1, as shown in Figure 1, the NIR portion of the Pan camera is filtered. This is because the Bayer pattern colour cameras generally have the NIR filter to generate sharper RGB images. In this configuration, we remove the NIR portion of the Pan camera to eliminate the colour distortions caused by non-similar spectral coverage of the Pan and the colour camera in image fusion. The low-resolution colour camera used in this study is referred to as LRC. Then, we co-register the images and use UNB-Pansharp method to perform image fusion (Zhang 2004).
Figure 1: Configuration 1: A Pan image is fused with an LRC image to produce a fused RGB image in which the resolution is
as high as the Pan image with the colour information inherited from the LRC image. To remove the unwanted NIR portion of the Pan image, an NIR-cut filter is used in front of the Pan
camera.
Figure 2: Configuration 2: A Pan image is fused with a simulated NRGB image to produce a fused NRGB image in which the resolution is as high as the Pan image with the
spectral information inherited from the LRC and NIR images. In this configuration, the NRGB is simulated by replacing half of the green pixels in the Bayer-pattern image by corresponding NIR pixels.
In configuration 2, as explained in (Jabari et al. 2017) and shown in Figure 2, the NIR portion of the Pan camera is used to elevate the number of bands in the LRC camera from 3 to 4. This configuration is used when an NRGB sensor is available. However, since we did not have such a sensor, we simulated that. In this configuration, using an NIR filter, a high resolution NIR (HR-NIR) image is generated. Then, the HR-NIR image is resized to the size of LRC images. After that, from every two green pixels in a 2×2 neighbourhood of the Bayer pattern, one of them is replaced by an NIR pixel. This result is a simulated NRGB image. The simulated NRGB image is finally fused with the Pan image using the UNB-Pansharp method. The resulting image in this configuration has the same spatial resolution as the Pan image but in 4 multi-spectral bands (NIR, R, G, B).
3. EXPERIMENTS 3.1 Image Acquisition
3.1.1 Camera specification
To acquire images, one Pan, one LRC, and one HRC cameras have been used. The HRC camera images are used as a reference. Figure 3 shows the cameras used in this study and the technical specifications of the cameras are presented in Table 1.
Figure 3: LRC, Pan and reference colour camera (HRC) used in this study.
Table 1: Technical specifications of the cameras used in this study
Camera Sensor Pixel Size
(μm× μm)
Sensor Size (inches)
Pan
DMK-51BG02.H
Sony
ICX274AL 4.4×4.4 1/1.8
LRC IDS
UI-2210-M/C
Sony
ICX414 9.9×9.9 1/2
HRC
DFK-51BG02.H
Sony
ICX274AQ 4.4×4.4 1/1.8
3.1.2 Image Capturing
To test the two configurations in outdoor conditions, the three cameras are synchronised since the outdoor lighting conditions constantly change. However, for taking Pan, Vpan and NIR images, since the same Pan camera is used with different filters, the filters were quickly changed to minimize the illumination difference caused by the acquisition time difference of the images. Therefore, in each dataset 5 images are captured: Pan, Vpan, NIR, LRC, and HRC. Besides, for a proper comparison, all the images of each dataset were taken with the same imaging The International Archives of the Photogrammetry, Remote Sensing and Spatial Information Sciences, Volume XLII-2/W6, 2017
International Conference on Unmanned Aerial Vehicles in Geomatics, 4–7 September 2017, Bonn, Germany
This contribution has been peer-reviewed.
parameters which are exposure time, aperture size, and camera gain.
3.1.3 Study Areas
The images are captured from two different scenes. Scene 1, contains an oblique view of a building and the surrounding vegetation areas with a river view at the top of the image. This is a sample of a typical oblique image that can be acquired by a UAV. Figure 4 shows Scene 1 of the study area.
Figure 4: Scene 1 of the study areas
Scene 2 consist of an athletic field with turf coverage and vegetation. The difference between turf and vegetation in NIR band is highlighted and can demonstrate the value of NIR band in UAV image classifications. Figure 5 shows a screenshot of Scene 2.
Figure 5: Scene 2 of the study areas
3.2 Image fusion
To generate Configuration 1, LRC images are co-registered to Vpan images. In this process, using the Harris operator the matching corner points of the images are found and using a second-degree polynomial the images are co-registered. After co-registration, UNB-Pansharp is used to fuse the images. To generate Configuration 2, using the same image registration process, the LRC images are co-registered to the Pan images while in every 2×2 Bayer-pattern neighborhood, one green pixel of LRC is replaced by the corresponding NIR pixel. The output NRGB image is then de-Bayered to generate 4-band NRGB low resolution image. Finally, the NRGB image is fused with the Pan image.
3.3 Image classification
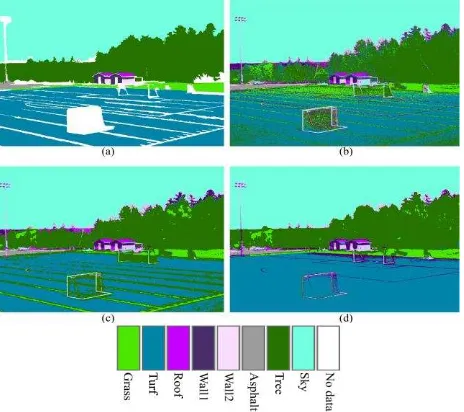
The Configuration 1 and Configuration 2 images are classified using the SVM classification method. Then, the classification results are checked against the ground truth data generated manually. Figure 6(a) and Figure 7(a) show the ground truth data used for accuracy assessment of the classification. Figure 6(b) and Figure 7(b) show the classified HRC reference images. As can be seen, the classification results of HRC images
are very noisy. Figure 6(c) and Figure 7(c) show the classification results of the Vpan-RGB configuration and Figure 6(d) and Figure 7(d) show the classification results of the Pan-NRGB configuration.
Figure 6: Classification results of Scene 1 images including (a) ground truth data generated manually and the classification results of (b) HRC image, (c) Vpan-RGB fused image, and (d) Pan-NRGB fused image.
Figure 7: Classification results of Scene 2 images including (a) ground truth data generated manually and the classification results of (b) HRC image, (c) Vpan-RGB fused image, and (d) Pan-NRGB fused image.
4. ACCURACY ASSESSMENT
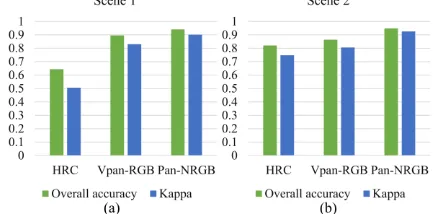
For accuracy assessment, the classified images are compared to the ground truth images that are generated manually. Then, the corresponding confusion matrices are generated. From there, accuracy assessment parameter including UA, PA, OA, and Kappa coefficient are calculated (Congalton 1991). Figure 8 shows the UA and PA for different classes in Scene 1 and 2 images accordingly. Figure 9 compares the OA and Kappa coefficient for Scene 1 and Scene 2 fused and HRC images. The International Archives of the Photogrammetry, Remote Sensing and Spatial Information Sciences, Volume XLII-2/W6, 2017
International Conference on Unmanned Aerial Vehicles in Geomatics, 4–7 September 2017, Bonn, Germany
This contribution has been peer-reviewed.
Figure 8: Accuracy assessment of image classification of HRC, Vpan-RGB, and Pan-NRGB images. (a) and (b) UA and PA of Scene 1 images, accordingly. (c) and (d) UA and PA of Scene 2 images, accordingly.
Figure 9: Overall accuracy and Kappa coeffect of (a) Scene 1 and (b) Scene 2 image classification for HRC, Vpan-RGB, and Pan-NRGB images.
5. DISCUSSION
As shown in Figures 8 and 9, in general, fused images have higher accuracies compared to HRC images in both scenes. Within the calculated accuracy assessment parameters, Kappa coefficient can be considered as a comprehensive accuracy assessment parameter as it counts for error of omission and error of commission as well.
In Scene 1 the kappa coefficient in HRC image is 0.51, while this parameter for Vpan-RGB and Pan-NRGB configurations equals 0.83 and 0.9, respectively. The kappa coefficient for Scene 2 images equals 0.75, 0.8, and 0.93 for HRC, Vpan-RGB and Pan-NRGB configurations, respectively. As shown by the kappa coefficient, the fused results have around 5-40% more accuracies compared to HRC images.
The higher accuracies of the fused images prove that after sensor fusion, higher quality images are achieved that lead to reaching higher accuracies in image classification. The high SNR in the Pan images, once fused with high SNR of LRC images, increases the SNR of the fused images (Jabari et al. 2017). However, HRC images have low SNR, due to the colour filtering and smaller pixel size compared to LRC images, which can be translated to the existence of more amount of noise in the images. This noise generates numerous spuriously classified pixels, which reduces classification accuracies. As can be seen from Figure 6(b) and 7(b) the HRC image classification results are the noisiest results. Thus, even the high amount of outdoor light could not compensate for the lower SNR of the HRC images compared to the fused images.
On the other hand, within the fused images, the Pan-NRGB configuration images have higher accuracy parameters
compared to the images of the Vpan-RGB configuration. This is due to the additional NIR band that plays a very important role in image classification especially in identifying vegetation from green objects. This effect is majorly seen in Scene 2 images which has artificial turf, tree and grass classes in the same image. Considering UA and PA together for these three classes, it is apparent that Pan-NRGB has higher capabilities in identifying the classes.
6. ACKNOWLEDGEMENT
This research has been funded by Atlantic Canada Opportunities Agency (ACOA) of Canada.
7. REFERENCES
Aasen, H., Burkart, A., Bolten, A., & Bareth, G. (2015). Generating 3D hyperspectral information with lightweight UAV snapshot cameras for vegetation monitoring: From camera calibration to quality assurance. ISPRS Journal of Photogrammetry and Remote Sensing, 108, 245–259.
Chen, Z., Wang, X., & Liang, R. (2014). RGB-NIR multispectral camera. Optics Express, 22(5), 4985–4994. Congalton, R. G. (1991). A review of assessing the accuracy of
classifications of remotely sensed data. Remote Sensing of Environment, 37(1), 35–46.
Jabari, S., Fathollahi, F., Roshan, A., & Zhang, Y. (2017). Improving UAV imaging quality by optical sensor fusion: an initial study. International Journal of Remote Sensing, 38(17), 4931–4953.
Khiabani, S. A. (2015). Terrestrial Implementation of UNB Super Camera And Improvements To UNB-Pansharp.
Retrieved from
https://unbscholar.lib.unb.ca/islandora/object/unbscholar %3A7107/datastream/PDF/view
Menon, D., Andriani, S., & Calvagno, G. (2007). Demosaicing with directional filtering and a posteriori decision. IEEE Transactions on Image Processing, 16(1), 132–141. Verhoeven, G. J. J. (2010). It’s all about the format–unleashing
the power of RAW aerial photography. International Journal of Remote Sensing, 31(8), 2009–2042.
Walker, J. S., & Blaschke, T. (2008). Object‐ based land‐ cover classification for the Phoenix metropolitan area: optimization vs. transportability. International Journal of Remote Sensing, 29(7), 2021–2040.
Zhang, Y. (2004). Understanding image fusion. Photogrammetric Engineering and Remote Sensing, 70(6), 657–661.
Zhang, Y., Roshan, A., Jabari, S., Khiabani, S. A., Fathollahi, F., & Mishra, R. K. (2016). Understanding the Quality of Pansharpening--Alab Study. Photogrammetric Engineering & Remote SenSing, 82(10), 747–755. The International Archives of the Photogrammetry, Remote Sensing and Spatial Information Sciences, Volume XLII-2/W6, 2017
International Conference on Unmanned Aerial Vehicles in Geomatics, 4–7 September 2017, Bonn, Germany
This contribution has been peer-reviewed.