A Modified H-
α
Plane for the Extraction of Scattering Mechanisms from Dual
Circular Polarization SAR Data
Sara Ghods1*, Vahhab Shojaeddini1,Yasser Maghsoudi2
1Electrical and Information Technology Department of Iranian Research Organization for Science and Technology (IROST), Iran- 1*[email protected]
2Geomatic and Geodesy Department of K.N.Toosi University of Technology, Iran
KEY WORDS: Compact polarimetry, Dual Circular Polarisation mode, classification, producer’s accuracy, entropy, alpha
ABSTRACT:
Cloude–Pottier entropy and α-angle are two important parameters for the interpretation of fully polarimetric data. They indicate the randomness of the polarisation of the back scattered waves and the scattering mechanisms of the targets respectively. For fully polarimetric data the H-α plane is presented which using the borders of it the full polarimetric data can be classified into 8 different physical scattering mechanisms. In recent years new approaches have proposed H-α classification spaces by mapping the points which are belong to each PSMs of FP data into the space of H/α for CP data and approximate borders were extracted for the classification purpose. In this paper a novel approach for defining H/α classification plane has been presented which maximizes the
producer’s accuracy. The optimum borders have been found and the results of classification using the new plane have been compared with the rival method and the superiority of the new proposed method has been revealed.
1. INTRODUCTION
Nowadays, SAR imaging is a well-developed remote sensing technique for providing high spatial resolution images of the
Earth’s surface which provides a vast amount of information for
environmental monitoring. Fully polarimetric (FP) SAR systems alternately transmit two orthogonal polarizations and receive the response of the scatters to each of them by two antennas with orthogonal polarizations. Transmitting two interleaved electromagnetic waves requires doubling the pulse repetition frequency which implies immediately that the image swath must be only half of the width of a single-polarized or dual-polarized SAR. In order to achieve a better swath width, and coincidentally reduce average power requirements and simplify transmitting hardware, compact polarimetric (CP) systems have been proposed with the promise of being able to maintain many capabilities of fully polarimetric systems (Souyris et al., 2005). One of the most important CP configurations is dual circular polarimetric (DCP) mode.
In order to extract the physical scattering mechanism (PSM) of targets using polarimetric data many classification methods have been presented. One of the most common such methods is H-α decomposition (Cloude and Pottier, 1998) that is proposed for FP data. Its principle relies on the analysis of eigenvalues and eigenvectors of the coherency matrix. The space of scattering entropy (H) and mean alpha angle (α) namely H-α plane is used to classify the image into 8 canonical PSMs.
In recent years two approaches have been proposed in order to find dual H-α classification zones for DCP data. (Guo et al., 2012) proposed an H-α classification space by mapping the points of eachPSM from the original FP data into the space of H-α for CP data and subsequently (Zhang et al., 2014) proposed an H-α space on the basis of the distribution centers and densities of different PSMs. Experimental results showed that the classification accuracy of each PSM is improved compared with the results of Guo’s H-α space, however
Zhang’s method is not well accurate and there are still overlaps
between different PSMs.
In this paper an optimum H-α plane is proposed which
maximizes the mean producer’s accuracy of the classification
results for the DCP data simulated from fully polarimetric RADARSAT2 data.
2. THEORITICAL BACKGROUND
2.1 H/a decomposition theory for FP mode
Remote sensing SARs in FP mode transmit two orthogonal polarizations alternately and record each backscattered wave in two orthogonal polarizations. The scattering matrix represents the FP dataset
where the superscript * represents conjugate transpose, and < > indicates spatial averaging. Cloude and Pottier have proposed a decomposition method that relies on the analysis of eigenvalue and eigenvector of the coherency matrix
The International Archives of the Photogrammetry, Remote Sensing and Spatial Information Sciences, Volume XL-1/W5, 2015 International Conference on Sensors & Models in Remote Sensing & Photogrammetry, 23–25 Nov 2015, Kish Island, Iran
This contribution has been peer-reviewed.
(5)
in which �� is an eigen vector. Then the polarimetric entropy H and scattering angle can be defined as follows:
(7)
Polarimetric angle relate to the underlying physical scattering mechanisms and is used to associate polarimetric measurements with physical properties of the remotely sensed targets. The concept of entropy in thermodynamic and information theory commonly understood as a measure of uncertainty, similarly in polarimetry the entropy is a measure of randomness in the polarisation of the backscattered wave.
2.2 H/α decomposition for DCP mode
The scattering vectors for DCP mode is given by:
� �=
[
�]
= [ ��− ��+ � �� � ��+ �� ]�/ (11)
where the superscript T denotes the transpose operation. Then, the coherency matrix is as follows:
T= < k.k*>. (12)
Eigen decomposition of the coherency matrix is as follows:
= � [� � ] ��, � = [� � ] , (13)
in which λ1and λ2 are eigen values and � � � are eigen vectors that can be represented as:
When the number of samples in different classes varies greatly, the total accuracy is not a suitable criterion to evaluate the
performance of a classifier. So the average producer’s accuracy
is chosen to find the optimum H-α zones. The producer’s accuracy refers to the probability that a certain land-cover of an area on the ground is classified as such. The mean producer accuracy is been calculated as follows:
Mean producer accuracy =N∑N TP i n i
i= (17)
In which N is number of classification zones, n(i) is number of reference pixels in zone(i) and TP(i) is the number of pixels which classified in zone(i) correctly. So the borders of H/a classification planein DCP mode is chosen in such a way that the mean producer accuracy reaches the highest value.
4. SPECIFICATIONS OF THE DATA SETS
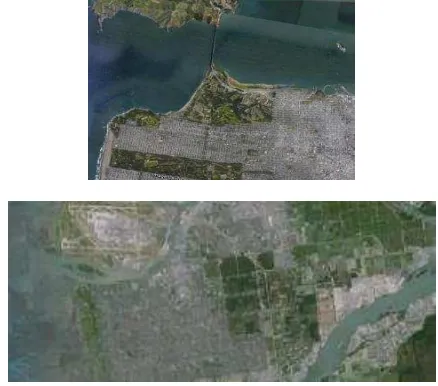
Two images over San Francisco and Vancouver acquired by Radarsat-2 at C-band in quad polarization mode, with the image size being 1151×1776 and 1766×1558 respectively have been used for this study. Google earth images of these areas have been shown in Figure 1.
Fig.1. Google earth images of the study areas, San Francisco
(Left), Vancouver (Right).
5. INVESTIGATION OF THE ZHANG’S H-Α SPACE
Figure 2(a) shows the boundaries of different PSMs for the original FP mode. Figure 2(b) shows the distribution of each
scattering zones in FP mode which maps to Zhang’s H-α space for DCP mode for San Francisco Image.
The International Archives of the Photogrammetry, Remote Sensing and Spatial Information Sciences, Volume XL-1/W5, 2015 International Conference on Sensors & Models in Remote Sensing & Photogrammetry, 23–25 Nov 2015, Kish Island, Iran
This contribution has been peer-reviewed.
(a)
(b)
Fig.2. Boundaries of different PSMs (a) original FP zones, (b)
PSMs of FP that are mapped to Zhang’s plain.
As it can be seen from Fig.2, Zhang’s H-α space for DCP data
did not classify PSMs accurately and different PSM’s have
overlaps with each other in this space. Therefore we tend to find the optimum boundaries for the zones in the H-α space of the DCP data.
6. OPTIMUM CLASSIFICATION ZONES
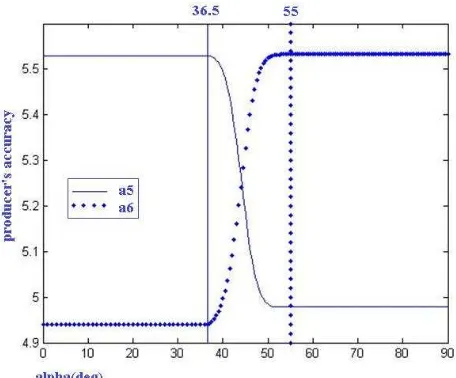
When the number of samples in different classes varies greatly, the total accuracy is not a suitable criterion to evaluate the performance of a classifier. So the average producer’s accuracy is chosen to find the optimum H-α zones. The producer’s accuracy refers to the probability that a certain land-cover of an area on the ground is classified as such. In figure 3 the boundaries in the H-α plain for DCP data have been named. In figures 4-7 the values of mean producer’s accuracy with respect to different values for these boundaries has been plotted.
Fig.3. Names of H-α boundaries for classification of different PSMs.
Fig.4. mean producer’s accuracy versus different values of the
H1 and H2 boundaries.
Fig.5. mean producer’s accuracy versus different values of the a1 and a2 boundaries.
Fig.6. mean producer’s accuracy versus different values of the a3 and a4 boundaries.
The International Archives of the Photogrammetry, Remote Sensing and Spatial Information Sciences, Volume XL-1/W5, 2015 International Conference on Sensors & Models in Remote Sensing & Photogrammetry, 23–25 Nov 2015, Kish Island, Iran
This contribution has been peer-reviewed.
Fig.7. mean producer’s accuracy versus different values of the a5 and a6 boundaries.
The resultant optimal values for the parameters which maximize
the mean producer’s accuracy have been listed in table1.
Table1. Optimal values for H-α classification boundaries.
H1 H2 a1 a2 a3 a4 a5 a6 0.71 0.96 42 53 41 50 36.5 55
7. RESULTS
In order to evaluate the ability of the proposed H-α zones in
comparison with Zhang’s zones, Each experimental image is
classified into eight PSMs that have been depicted in Figures 5 and 6. Confusion matrices have been achieved and the resultant
producer’s accuracies have been obtained. Mean producer’s
accuracies have been calculated which have been presented in table2.
(a) (b) (c) Fig. 5. classification results for san Francisco data using (a) FP
method, (b) Zhang’s zones, (c) proposed zones.
(a) (b) (c) Fig. 6. classification results for san Francisco data using (a) FP
method, (b) Zhang’s zones, (c) proposed zones.
Table2. mean producer’s accuracies of the classifications based
on the proposed and Zhang’s H-α zones.
Zhang’s zones Proposed zones San Francisco 65.7637% 69.1598% Vancouver 65.7578% 68.0063%
8. DISCUSSION AND CONCLUSION
From table 2 the mean producer’s accuracy using our proposed
method for San Francisco and Vancouver data is 3.4% and
2.25% higher than Zhang’s method. For the image which for example contained 2044176 pixels, 3% means that 61325 additional pixels are classified in the original corresponding classes and for the resolution of 5.2*7.6 (m) for RADARSAT2 SLC fine quad mode, it means that additional 2423575 m2 of the scene is classified correctly.
REFERENCES
Cloude, S. R., Pottier, E., 1997. An entropy based classification scheme for land applications of polarimetric SAR. IEEE Trans. Geosci. RemoteSens., 35(1), pp. 68–78.
Guo, R., Liu, Y. B., Wu, Y. H., Zhang, S. X., Xing, M. D., He,
W., 2012. Applying H/α decomposition to compact polarimetric
SAR. IET Radar Sonar Navig., 6(2), pp. 61–70.
Souyris, J. C., Imbo, P., Fjortoft, R., Mingot, S., Lee, J. S., 2005. Compact polarimetry based on symmetry properties of
geophysical media: The π/4 mode. IEEE Trans. Geosci. Remote Sens., 43(3), pp. 634–646.
Zhang, H., Xie, L., Wang, C., Wu, F., Zhang, B., 2014. Investigation of the Capability of H-α Decomposition of Compact Polarimetric SAR. IEEE Geoscience and Remote Sensing Letters, 11(4).
The International Archives of the Photogrammetry, Remote Sensing and Spatial Information Sciences, Volume XL-1/W5, 2015 International Conference on Sensors & Models in Remote Sensing & Photogrammetry, 23–25 Nov 2015, Kish Island, Iran
This contribution has been peer-reviewed.