GEOGRAPHIC MEDICAL HISTORY: ADVANCES IN GEOSPATIAL TECHNOLOGY
PRESENT NEW POTENTIALS IN MEDICAL PRACTICE
F. S. Faruque a*, R. W. Finley b
a Professor of Preventive Medicine and Director of GIS & Remote Sensing Program, University of Mississippi Medical Centre,
2500 North State Street, Jackson, MS 39216-4505 - [email protected]
b Professor of Emergency Medicine and Medical Director of Centre for Telehealth, University of Mississippi Medical Centre,
2500 North State Street, Jackson, MS 39216-4505 - [email protected]
Commission VIII, WG VIII/2
KEY WORDS: Air pollutants, Disease risk factors, Environmental epigenetics, Environmental exposure, Geographic Medical History, Hippocrates, Mold spore, Particulate Matter (PM)
ABSTRACT:
Genes, behaviour, and the environment are known to be the major risk factors for common diseases. When the patient visits a physician, typical questions include family history (genes) and lifestyle of the patient (behaviour), but questions concerning environmental risk factors often remain unasked. It is ironic that 25 centuries ago Hippocrates, known as the father of medicine, noted the importance of environmental exposure in medical investigation as documented in his classic work, “Airs, Waters, Places”, yet the practice of routinely incorporating environmental risk factors is still not in place. Modern epigenetic studies have found that unhealthy lifestyle and environmental factors can cause changes to our genes that can increase disease risk factors. Therefore, attempting to solve the puzzle of diseases using heredity and lifestyle alone will be incomplete without accounting for the environmental exposures. The primary reason why environmental exposure has not yet been a routine part of the patient’s medical history is mostly due to our inability to provide clinicians useful measures of environmental exposures suitable for their clinical practices. This presentation will discuss advances in geospatial technology that show the potential to catalyse a paradigm shift in medical practice and health research by
allowing environmental risk factors to be documented as the patient’s “Geographic Medical History”. In order to accomplish this we need information on: a) relevant spatiotemporal environmental variables, and b) location of the individual in that person’s dynamic environment. Common environmental agents that are known to interact with genetic make-up include air pollutants, mold spores, pesticides, etc. Until recently, the other component, location of an individual was limited to a static representation such as residential
or workplace location. Now, with the development of mobile technology, changes in an individual’s location can be tracked in real time if necessary. Technological advancements in the areas of estimating environmental agents and identifying locations of individuals at flexible spatio-temporal scales now present the potential of a paradigm shift in clinical practices by incorporating “Geographic Medical History” into determining disease risk factors.
1. INTRODUCTION
1.1 Needs for Environmental Exposure Information Although 25 centuries ago Hippocrates suggested to account for the local environmental conditions into practicing medicine, it is not yet in routine practice (Miller, 1962). Among the three major risk factors for common diseases, which include genes, behaviour, and the environment, information regarding genes and behaviour are collected by doctor’s office. However, environmental exposure information is often not discussed. Virtually all-human diseases result from the interaction of genetic susceptibility factors and modifiable environmental factors, which include infectious, chemical, physical, nutritional, and behavioural factors (CDC, 2000). Part of the environmental factors are pollutants which can be measured or estimated to assess the risk factors for population or for individuals. Recent research on environmental epigenetic studies suggest a stronger
impact of pollutants on individual’s health (Baccarelli and Ghosh, 2012; Hou, et al., 2011; Bollati and Baccarelli, 2010; Tarantini et al., 2009).
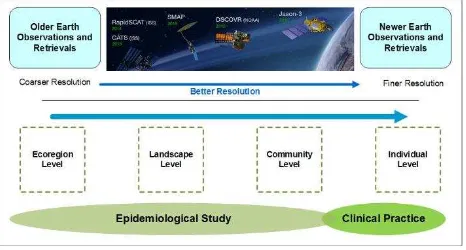
1.2 Earth Observations and Geospatial Technology In early days of Earth observations, resolution of satellite images restricted the analysis mostly to regional ecosystem and
landscape levels, which were suitable only for epidemiological health studies. Recent satellite images provide a finer resolution suitable to be considered for community and even individual level analysis (Figure 1). At the same time, the quality of image-derived products, even from the older satellites, is improving by applying advanced retrieval algorithms. On the other hand, geospatial technology is also improving to generate new information by incorporating multivariate and non-linear spatial data. Such information includes environmental exposure that can be suitable for clinical practices as a health risk factor.
Figure 1. Generalized scenario of the advancement of Earth observations and geospatial technology generating environmental data suitable for clinical practice
1.2 Scale
There have been continuous efforts to better understand the integrated Earth system globally to benefit human health and health of the ecosystem by space agencies like NASA (Space Studies Board, 2015). Scale is the factor to determine the usefulness of the measurements whether for individual human health or for the ecosystem. While human health is influenced even at the ecosystem level, incorporating environmental exposure for clinical practice for individual health requires measurements at a much finer scale. With advancements in Earth observations and geospatial technology, variables from the ecoregion level to personal exposure level can now account for health outcome analysis. A unique strength of geospatial technology is due to its ability to handle multiple scales at the same time when the data quality is supported. As the interactions and changes that affect human well-being take place at more than one scale and also across various scales, the ability to handle different scales is important. A multiscale approach that simultaneously uses larger- and smaller-scale assessments can help identify important dynamics of the system that might otherwise be overlooked (WHO, 2005).
1.3 Earth Observations in Tracking Air Pollutants Earth observing satellite systems have played a major role in tracking a variety of air pollutants, whether generated from planetary processes or from anthropogenic sources that are harmful to human health (Griffin et al., 2012). Particulate matters are among the worst air pollutants to cause multiple health hazards and these pollutants have been estimated at various scales.
1.3.1 Particulate Matter (PM)
Two to four million annual deaths are associated with PM2.5 globally (Apte et al., 2015; Silva et al., 2013; Anenberg et al., 2010). The magnitude of ambient PM2.5 related disease burden is humongous- more than malaria and HIV-AIDS combined (Lim et al., 2012; Lozano et al., 2012).
While success in capturing total column atmospheric particulate matter is phenomenal, estimating ground level particles (GLP) from satellite data is not as reliable. Techniques that can account for multivariate and nonlinear relationships, such as machine learning, show potential in generating ground level PM2.5 from satellite derived aerosols. In a recent study, Lary et al., (2014) generated daily global PM2.5 estimates at 10 km resolution using a suite of remote sensing and meteorological data products validated using ground-based PM2.5 data. Such studies demonstrate potential for estimating more reliable PM2.5 at even better resolution utilizing newer satellite data.
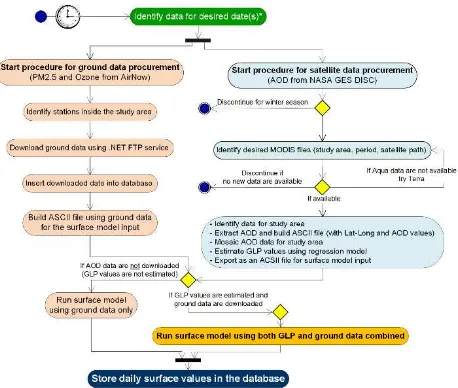
In recent years there have been initiatives for real-time surveillance system to track pollutants utilizing Earth observations. One such system is GeoMedStat, developed by the University of Mississippi Medical Center (UMMC), that generates daily Ozone and PM2.5 estimates for the state of Mississippi utilizing NASA satellite and EPA ground monitored data to study the association of daily hospital admissions due to asthma (Faruque, et al, 2014a; Morain and Budge, 2008). Figure 2 schematically shows the process flow for daily geospatial surface modelling for ground level PM2.5 (GPL) and ozone for GeoMedStat.
1.3.2 Harmful Airborne Fungal Spores (HAFS)
Another significant health risk factor is exposure to mold spores. Exposure to harmful airborne fungal spores (HAFS) is known to cause a wide range of adverse health effects, mild to severe. While the impact of outdoor mold spores on health has been documented in a host of literature (Dales, et al., 2000; Burney et al., 2008; Simon-Nobbe et al, 2007; Bousquet et al., 2009), information on the abundance of these spores is not available on a local scale because of sparsity monitoring facilities. The National Allergy Bureau (NAB) of the US maintains a number of mold spore monitoring stations to provide information to the public about outdoor mold levels. However, due to the cost of running these stations, they are very sparsely located, only 46 in the entire US. Therefore, sources that provide nationwide fungal spore abundance rely on extrapolated data over large areas often with no data for an entire state (Figure 3). Also, current information only includes the range of total count, even though specific fungi types contribute to specific health impacts. In a pilot study, spatiotemporal surface models was utilized to generate six clinically significant spore types for the Central Mississippi region in the US at 10 km resolution utilizing Earth observation data (Figure 4) (Faruque, et al., 2014b).
However, current technology and data can support generating such daily estimates at 500-Meter spatial resolution, which can be a useful resource for the practicing allergists to have an idea about the exposure of their patients to mold spore allergens.
Figure 3. Example of currently available relative mold spore frequency map
(http://www.weather.com/maps/ health)
Figure 4. Example of geospatial surface model of estimated mold spore abundance at 10-Km resolution for central Mississippi, USA.
Figure 2. Process diagram for daily geospatial surface modelling for ground level PM2.5 (GPL) and ozone for GeoMedStat
2. TECHNOLOGICAL ADVANCEMENTS 2.1 Satellite Data
There have been continuous efforts to better understand the integrated Earth system globally to benefit human health and health of the ecosystem by space agencies like NASA (Space Studies Board, 2015). Over the years, space agencies across the globe have achieved significant improvements in data quality including spatial and spectral resolutions. In addition, there have been efforts for special instrumentation necessary for health applications. For example, NASA has recently selected a proposal to put new instruments in low-Earth orbit to track the abundance and types of particulate matter at 1 km resolution (NASA, 2016). If successful, this will be a major breakthrough in determining particulate types using satellite data. This type of initiative is bringing the potential of using environmental exposures closer to medical practice.
2.2 Next-Generation Air Quality Measurement Technologies
The conventional stationary air quality monitoring facilities provide the best quality data and are the standard sources of data validation for estimates generated using Earth observation data. However, these monitoring facilities require expensive instruments, specialized trained personnel and costly maintenance. Therefore, such facilities are sparsely located, for example, for daily PM2.5 data there are only 320 monitoring facilities in the entire US (Faruque, et al., 2014a). There has been a trend in recent years to increase the spatio-temporal coverage of the air pollution information by combining the low-cost portable ambient sensors and the Wireless Sensor Network (WSN) into one system which often referred to as he Next Generation Air Pollution Monitoring System (TNGAPMS) (Gayle, 2016; Yw, et al., 2015).
2.3 Personal Pollution Exposure
With increasing awareness of the impact of air pollutants on health, people are considering carrying personal air monitoring devices. In recent years, there have been efforts to market monitors to measure personal exposures to pollutants that can be carried inside pockets or can be worn on the clothes or wrist. Universities are also getting involved in developing such devices through academic research (Bales et al., 2014; Devarakonda et al., 2013). Combining these monitor measurements with smartphone is also becoming popular.
2.4 Patient Location
Environmental exposure information can be generated only when
environmental data and person’s contemporaneous location data
both are available. Traditionally home location, work place location or even approximate locality, such as zip code, are considered as a patient’s location to assess the environmental exposure. Numerous successful epidemiological studies have been conducted using such locational data to examine the association between health outcomes and environmental exposures. However, such gross location may not be convincing enough for healthcare providers to incorporate environmental exposure data into clinical practices. Like pollutant data with higher resolution, whether through Earth observation or newer mobile monitors, location of individuals can be tracked at a very high resolution. The space-time cube became a new approach to
show a person’s movement at very high resolution (Kraak, 2003;
Bach et al., 2014). A similar approach has been adopted to examine personal exposure measures (Lu and Fang, 2014; Kwan, 2009).
2.5 Tracking Personal Movements
While not everybody is expected to carry a personal pollutant monitoring device, more and more people are carrying mobile phones. Whether we know it or not, our movements can be tracked and stored by the service providers. Based on this reality, there are initiatives to make this information useful for health providers. If the environmental pollution data can be generated
at a useful resolution, tracking individual’s movement can
generate cumulative environmental exposure information over space and time. One start-up company, PastLife, based in Mississippi, USA, approached UMMC with ideas of providing
physicians with their patients’ precise location history, including
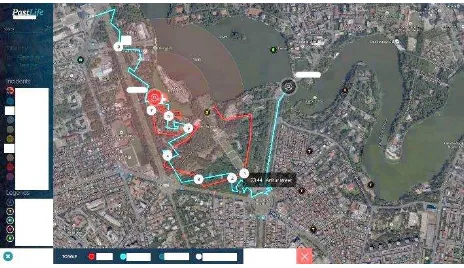
environmental exposures and space sharing information with other individuals. They claim that their platform can incorporate most data regardless of mobile carrier or country with a level of data resolution previously unavailable. This screenshot reveals a hypothetical patient’s location history of sharing space and time with another individual with communicable disease (Figure 5).
Figure 5. Representation of a patient’s crossing paths. A patient with a communicable disease visits a clinician. After uploading
the patient’s location history to the PastLife platform, the
Crossing Engine determines that the patient shares common location history with another individual with same disease. This information can help the clinician for deciding necessary tests and treatment plan
2.6 Privacy and Confidentiality
Privacy of the individuals and confidentially of data are the main challenges that need to be dealt with appropriately to use personal data for health risk factor examination. People certainly do not feel comfortable that their movements are being tracked by anyone. Governments need to step in to ensure the privacy of individuals and security of this data. If the government can convince the public that this data will only be used for the individual’s healthcare purpose and only by their healthcare providers, people may agree to have such a system in place. In the US, the Health Insurance Portability and Accountability Act of 1996 (HIPAA) has explicitly established national standards for electronic health care transactions and national identifiers for providers, health insurance plans, and employers through its Privacy Rule and Security Rule (US HHS, 2006; CDC, 2003; Ness, 2007). HIPAA can help in developing such a system from legal perspective assuring patients not to violet their privacy and maintaining the confidentiality of their data. Similar to HIPAA The International Archives of the Photogrammetry, Remote Sensing and Spatial Information Sciences, Volume XLI-B8, 2016
in the US, other countries have established their standards for protecting personal information for electronic records, such as the Personal Information Protection and Electronic Documents Act (PIPEDA) in Canada (Department of Justice Canada, 2000), the Data Protection Directive (Directive 95/46/EC) of the European Union (EU) (FRA, 2014), which could serve as another legal framework to generate personal exposure data as a health risk factor.
3. CONCLUSIONS
In order to incorporate environmental exposure data into clinical
practice, reliable environmental data and patient’s location
during the time of exposure are necessary. Technological advances are making it possible to collect personal level pollution exposure with very detail locations using personal pollution monitoring devices. However, it is very unlikely that the entire population will carry a personal pollution monitoring device. On the other hand, the Earth observation-based environmental data improving in quality as well as spatial resolution. The Next-Generation Air Quality Measurement Technologies can provide additional data for validating Earth observation-based estimates and hence can assist to further improve the quality of environmental data for broader spatial coverage. The other required data component, the patient location, can be precisely collected by utilizing wireless tracking technology. However, utilization of such data for mass people must be approved by the
government while ensuring individuals’ privacy and
confidentiality of their data. Given the technological advancements in environmental and individual location data collection, it can be assumed that using environmental exposures to identify patient’s disease risk factor may not be far. However, it is up to the geospatial scientist community who are engaged in health application research to make this happen sooner than later. .
REFERENCES
Anenberg, S.C., Horowitz, L.W., Tong, D.Q. & West, J.J., 2010. An estimate of the global burden of anthropogenic ozone and fine particulate matter on premature human mortality using atmospheric modeling. Environmental health perspectives, 118 (9), 1189.
Apte, J.S., Marshall, J.D., Cohen, A.J. & Brauer, M., 2015. Addressing global mortality from ambient pm2. 5. Environmental science & technology, 49 (13), 8057-8066.
Baccarelli, A. and Ghosh, S., 2012. Environmental exposures, epigenetics and cardiovascular disease. Current opinion in clinical nutrition and metabolic care, 15(4), p.323.
Bach, B., Dragicevic, P., Archambault, D., Hurter, C. & Carpendale, S., 2014. A review of temporal data visualizations based on space-time cube operations. In Eurographics conference on visualization. The Eurographics Association 2014.
Bach, B., Dragicevic, P., Archambault, D., Hurter, C. and Carpendale, S., 2014, June. A review of temporal data visualizations based on space-time cube operations. In Eurographics conference on visualization. The Eurographics Association 2014.
Bales, E., Nikzad, N., Ziftci, C., Quick, N., Griswold, W. & Patrick, K., 2014. Personal pollution monitoring: Mobile
real-time air-quality in daily life.
http://cseweb.ucsd.edu/~earrowsm/TR.pdf.
Bollati, V. and Baccarelli, A., 2010. Environmental epigenetics. Heredity, 105(1), pp.105-112.
Bousquet, J., Burney, P.G., Zuberbier, T., Cauwenberge, P.V., Akdis, C.A., Bindslev‐Jensen, C., Bonini, S., Fokkens, W.J., Kauffmann, F., Kowalski, M.L. and Lodrup‐Carlsen, K., 2009. GA2LEN (Global Allergy and Asthma European Network)
addresses the allergy and asthma ‘epidemic’. Allergy, 64(7),
pp.969-977.
Burney, P.G.J., Newson, R.B., Burrows, M.S. and Wheeler, D.M., 2008. The effects of allergens in outdoor air on both atopic and nonatopic subjects with airway disease. Allergy, 63(5), pp.542-546.
CDC, 2000. Gene-Environment Interaction Fact Sheet, Office of Genetics and Disease Prevention, August 2000.
http://www.ashg.org/pdf/cdc%20gene-environment%20interaction%20fact%20sheet.pdf
CDC, 2003. HIPAA privacy rule and public health. Guidance from CDC and the US Department of Health and Human Services. MMWR: Morbidity and mortality weekly report, 52(Suppl. 1), 1-17.
Dales, R.E., Cakmak, S., Burnett, R.T., Judek, S., Coates, F. and Brook, J.R., 2000. Influence of ambient fungal spores on emergency visits for asthma to a regional children's hospital. American journal of respiratory and critical care medicine, 162(6), pp.2087-2090.
Department of Justice Canada, 2000. The Personal Information Protection and Electronic Documents Act (PIPEDA), Bill C-6.
Amended on June 23, 2015.
https://www.priv.gc.ca/leg_c/r_o_p_e.asp.
Devarakonda, S., Sevusu, P., Liu, H., Liu, R., Iftode, L. & Nath, B., 2013. Real-time air quality monitoring through mobile sensing in metropolitan areas. Proceedings of the 2nd ACM SIGKDD International Workshop on Urban Computing, ACM 15. http://www.cs.rutgers.edu/~iftode/UrbComp_2013.pdf.
Faruque F.S., Brackin M.N., Brackin B.T., Marshall G.D. 2014b. Geographic distribution of mold spores associated with health effects. 313153. American Public Health Association (APHA) 142nd Annual Meeting and Exposition, New Orleans, Louisiana, USA, November 15-19, 2014.
Faruque, F.S., Li, H., Williams, W.B., Waller, L.A., Brackin, B.T., Zhang, L., Grimes, K.A. & Finley, R.W., 2014a. GeoMedStat: An integrated spatial surveillance system to track air pollution and associated healthcare events. Geospatial health, 8 (3), 631-646.
FRA (European Union Agency for Fundamental Rights), 2014. Handbook on European data protection law, Luxembourg: Publications Office of the European Union, ISBN 978-92-871-9934-8.
Gayle, H., 2016. Next-generation air measurement technologies. EPA Office of Research and Development. https://cfpub.epa.gov/si/si_public_file_download.cfm?p_downl oad_id=527435.
Griffin, D.W., Naumova, E.N., McEntee, J.C., Castronovo, D., Durant, J.L., Lyles, M.L., Faruque, F. and Lary D., 2012, Chapter 4: Air quality and human health, (Chapter 4), pages 129-185, in Morain, S. and Budge, A. (Eds.) Environmental Tracking for Public Health Surveillance, International Society for Photogrammetry and Remote Sensing (ISPRS) Commission VIII/WG-2, CRC Press Taylor & Francis. ISBN 9780415584715.
Hou, L., Zhang, X., Wang, D. and Baccarelli, A., 2011. Environmental chemical exposures and human epigenetics. International journal of epidemiology, p.dyr154.
Kraak, M.J., 2003, August. The space-time cube revisited from a geovisualization perspective. In Proc. 21st International Cartographic Conference (pp. 1988-1996).
Kwan, M.P., 2009. From place-based to people-based exposure measures. Social science & medicine, 69(9), pp.1311-1313.
Lary, D.J., Faruque, F.S., Malakar, N., Moore, A., Roscoe, B., Adams, Z.L. & Eggelston, Y., 2014. Estimating the global abundance of ground level presence of particulate matter (pm2. 5). Geospatial health, 8 (3), 611-630.
Lim, S.S., Vos, T., Flaxman, A.D., Danaei, G., Shibuya, K., Adair-Rohani, H., Almazroa, M.A., Amann, M., Anderson, H.R. & Andrews, K.G., 2013. A comparative risk assessment of burden of disease and injury attributable to 67 risk factors and risk factor clusters in 21 regions, 1990–2010: A systematic analysis for the global burden of disease study 2010. The Lancet, 380 (9859), 2224-2260.
Lozano, R., Naghavi, M., Foreman, K., Lim, S., Shibuya, K., Aboyans, V., Abraham, J., Adair, T., Aggarwal, R. & Ahn, S.Y., 2013. Global and regional mortality from 235 causes of death for 20 age groups in 1990 and 2010: A systematic analysis for the global burden of disease study 2010. The Lancet, 380 (9859), 2095-2128
Lu, Y. & Fang, T., 2015. Examining personal air pollution exposure, intake, and health danger zone using time geography and 3d geovisualization. ISPRS International Journal of Geo-Information, 4 (1), 32.
Lu, Y. and Fang, T.B., 2014. Examining personal air pollution exposure, intake, and health danger zone using time geography and 3D geovisualization. ISPRS International Journal of Geo-Information, 4(1), pp.32-46.
Miller, G., 1962. “Airs, Waters, and Places” in History. Journal
of the history of medicine and allied sciences, 17(1), pp.129-140.
Morain, S.A. & Budge, A.M., 2008. Environmental sensing and human health. Advances in Photogrammetry, Remote Sensing and Spatial Information Sciences: 2008 ISPRS Congress Book, CRC Press, 397 pp.
NASA, 2016. NASA Selects Instruments to Study Air Pollution, Tropical Cyclones. RELEASE 16-025, March 10, 2016. http://www.nasa.gov/press-release/nasa-selects-instruments-to-study-air-pollution-tropical-cyclones.
Ness, R. B., 2007. Influence of the HIPAA privacy rule on health research. Jama, 298(18), 2164-2170.
Simon-Nobbe, B., Denk, U., Pöll, V., Rid, R. and Breitenbach, M., 2007. The spectrum of fungal allergy. International archives of allergy and immunology, 145(1), pp.58-86.
Space Studies Board, 2015. Continuity of NASA earth observations from space: A value framework: National Academies Press. ISBN 978-0-309-37743-0, DOI: 10.17226/21789
Tarantini, L., Bonzini, M., Apostoli, P., Pegoraro, V., Bollati, V., Marinelli, B., Cantone, L., Rizzo, G., Hou, L., Schwartz, J. and Bertazzi, P.A., 2009. Effects of particulate matter on genomic DNA methylation content and iNOS promoter methylation. Environmental health perspectives, 117(2), p.217.
US HHS, 2006. HIPAA administrative simplification: enforcement; final rule Federal Register/Rules and Regulations, 71 (32) (2006)
WHO, 2005. Ecosystems and human well-being: Health Synthesis, A Report of the Millennium Ecosystem Assessment, WHO Press, ISBN 9241563095.
Yi, W., Lo, K., Mak, T., Leung, K., Leung, Y. & Meng, M., 2015. A survey of wireless sensor network based air pollution monitoring systems. Sensors, 15 (12), 29859 Available from: http://www.mdpi.com/1424-8220/15/12/29859.