QUASI-EPIPOLAR RESAMPLING OF HIGH RESOLUTION SATELLITE STEREO
IMAGERY FOR SEMI GLOBAL MATCHING
Nurollah Tatar a*, Mohammad Saadatsereshta, Hossein Arefia, Ahmad Hadavanda
a School of Surveying and Geospatial Information Engineering, College of Engineering, University of Tehran
Commission III, WG III/1
KEY WORDS: Epipolar resampling, SGM, High resolution satellite stereo images, Small image tiles.
ABSTRACT:
Semi-global matching is a well-known stereo matching algorithm in photogrammetric and computer vision society. Epipolar images are supposed as input of this algorithm. Epipolar geometry of linear array scanners is not a straight line as in case of frame camera. Traditional epipolar resampling algorithms demands for rational polynomial coefficients (RPCs), physical sensor model or ground control points. In this paper we propose a new solution for epipolar resampling method which works without the need for these information. In proposed method, automatic feature extraction algorithms are employed to generate corresponding features for registering stereo pairs. Also original images are divided into small tiles. In this way by omitting the need for extra information, the speed of matching algorithm increased and the need for high temporal memory decreased. Our experiments on GeoEye-1 stereo pair captured over Qom city in Iran demonstrates that the epipolar images are generated with sub-pixel accuracy.
1. INTRODUCTION
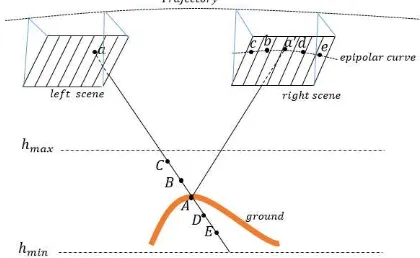
Rectified images, resampled along the epipolar line to omit y-parallax, which are called epipolar images are considered as input to SGM algorithm (Hirschmüller, 2008). Using epipolar images increase the speed of stereo matching by reducing the search space from 2 dimensional to 1 dimensional. Knowing the properties of epipolar line is critical to build epipolar image. Epipolar line in images taken by traditional frame cameras appear as lines. In linear array scanners, image is formed during the sensor movement along its orbit. So as presented in Figure 1 there is multiple projection centres for one image scene. As we consider on image point in left scene, its conjugate location in right scene is determined as c, b, d and e, which are obtained by changing the correspondence object point on the ray of “a”. These points creates the epipolar curve of point “a' ” in right scene.
Figure 1. Epipolar geometry in linear array scanners
Epipolar curve as showed in Figure 1 is depends to motion equation of sensor. Studies on orbital parameters of sensors demonstrates that the epipolar line appears as quasi-hyperbola (Kim, 2000). To determine this curve one needs to access accurate orbital parameters of sensor. Image providers usually doesn’t provide these information as public. Using ground control points (GCPs) is an alternative to determine epipolar curve (Lee and Park, 2002). Also terrain-independent rational polynomial coefficients (RPCs) are proposed to overcome the
problem of field work in measuring GCPs (Grodecki and Dial, 2003).
In high resolution satellite imagery, an image scene are taken just a few seconds. In this way we can assume constant altitude and constant velocity condition for each image scene. It is proved that under this condition and after parallel projection a simple 2D-affine transformation model suffices to determine epipolar images (Habib et al., 2005; Morgan et al., 2006; Morgan et al., 2004a, b; Ono, 1999). Determining the parallel projection transformation is based on RPCs and digital terrain model. RPCs also helps to create virtual control points and use 2D affine transformation to epipolar resampling (Oh et al., 2006).
Epipolar images could be generated in object space on a reference plan with constant height value equals to mean height of area. In this method the relation between the original image and generated epipolar image is established by RPCs (Wang et al., 2011). RPCs also could be used to find conjugate points between images and build epipolar image in image space (Oh, 2011; Wang et al., 2010; Zhao et al., 2008). The weak point of using RPCs is their need to correction for bias and drift (Fraser and Hanley, 2003).
In this paper a new solution is proposed to handle the epipolar resampling as the input of SGM algorithm. Our proposed algorithm with reliable performance in photogrammetric applications. SGM comprised of four main steps including: matching cost computation, cost aggregation, disparity map generation and disparity refinement. Here we briefly discuss matching cost computation and cost aggregation.
Respect to disparity range, every pixel in left epipolar image could be matched by a pixel in right epipolar image. Correspondence degree of points is measured by a cost
function. Cross correlation, sum of absolute differences, census and mutual information are some examples. The success of SGM depends on the cost function. After selection of cost function and minimum and maximum of disparity range, for each pixel in left epipolar image, a vector of matching costs are calculated. This process as shown in Figure 2 for whole image, results a matching costs cube which its dimension equals to left epipolar image size and its height equals to disparity range.
Figure 2. Matching cost computation and costs cube formation in SGM algorithm
Capability of matching based on cost computation, is reduced due to equal cost value for neighbour pixels, lack of texture in objects and deficiency of cost function. So the aggregation of matching cost from several paths have been proposed. In this step, based on matching cost and disparity in 8 or 16 paths matching costs aggregated. Figure 3 shows the aggregating matching costs in 8 paths.
Figure 3. Matching cost aggregation in 8 paths
Equation 1 is used to aggregate the matching costs in each path. Then using equation 2 the costs in all paths are aggregated.
(1)
p: image location of interest pixel d: disparity value
Lr (p,d): cost path toward the actual pixel of path C (p,d): pixel-wise matching cost
P1: a small value penalizing disparity changes between neighbouring pixels of one pixel
P2: a large value penalizing disparity changes between neighbouring pixels of one pixel
r: actual path
These equations provides aggregated cost values for each element in matching costs cube which is called aggregated cost cube. Now the disparity for each pixel could be calculated by minimizing aggregated cost values, using the following equation:
(3)
mind ( , )
D S p d
To estimate the disparity in sub-pixel level, a quadratic curve is fitted to the neighbouring costs and the position of minimum is calculated.
SGM algorithm needs large amount of temporary memory for saving matching costs cube and aggregated costs cube. The size of temporary memory depends on the image size and the disparity range. The solution which has been proposed by SGM is to divide the epipolar images into small image tiles. This idea also followed in our proposed method.
3. PROPOSED METHOD
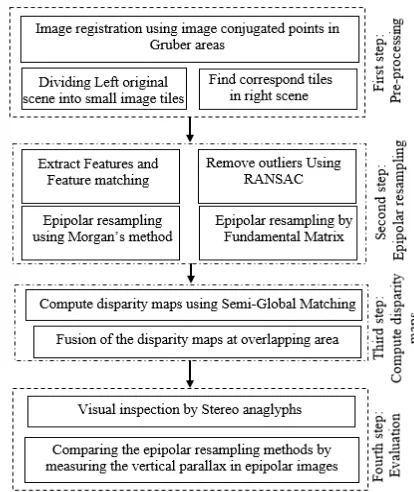
Based on flowchart of our proposed method have 4 main steps. In first step, due to the need of SGM algorithm to small tiles, a new method is proposed.
Figure 4. Flowchart of proposed method to create epipolar image as input of SGM algorithm
In the pre-processing step the left and right images are registered. Affine transformation is employed to model the geometrical relationship between images. An automated procedure is used to estimate affine transformation parameters. SURF operator (Bay et al., 2008) is used to extract reliable corresponding key features in both images. Then the RANSAC
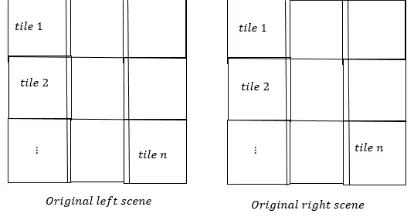
algorithm (Fischler and Bolles, 1981) is used to detect and remove outliers through the features. While the registration is solved, the left image is divided to small overlapping image tiles as presented in Figure 5.
Figure 5. Dividing original images into small image tiles
For the image tiles in left image, correspond tile should be found in right image, using affine transformation.
In the second step the epipolar image is generated for each corresponding image tile. Epipolar geometry in small image tiles could be assumed as straight line. Fundamental matrix (Loop and Zhang, 1999) and epipolar line equation (Morgan et al., 2004b) is could be used to create epipolar image. To estimate the fundamental matrix or epipolar line parameters we need correspond points in each pair of image tiles. SURF feature extractor followed by RANSAC algorithm such as previous step is employed here.
Epipolar resampling method, used here is originally proposed by Morgan (Morgan et al., 2004b). He proved that for images with parallel projection, epipolar lines could be defined using an affine transformation. 2D affine equation as below is parameters. After computing the parameters, following equations are used to transform the original images into corresponding points in stereo images. Fundamental matrix
solves this relationship without the need for interior and relative orientation parameters. Using this matrix, the relationship between image coordinates in stereo images is expressed by:
(11)
After calculating homography matrices, the relationship between original and epipolar image are expressed by:
(14) images. SGM algorithm is employed in this step. Tuning of P1, P2 and disparity range is critical in SGM algorithm. P1 and P2 are necessary in calculating aggregated costs and disparity range is essential in matching cost cube generation. Higher disparity range results in high computation cost and also increase the chance of outliers caused by repetitive textures in the image scene. Finally the results are evaluated by comparing y-parallax values for epipolar images.
4. EXPERIMENTS
4.1 Dataset
Panchromatic stereo images acquired by GeoEye-1 high resolution sensor is used in the experiments. The spatial resolution of data is 0.5 meter. The image is captured over an urban area in Qom city in Iran.
4.2 Pre-processing
In pre-processing step, to avoid the high computational load of SURF algorithm, the image pyramid is built for original images. In lower levels of pyramid SURF algorithms is employed to detect correspond key features which are used to estimate an approximate affine transformation between images. Then on original left image, 9 Gruber areas are considered and their correspond areas on right image is delineated by affine transformation. SURF algorithm is used on correspond Gruber areas as showed in Figure 6 and the accurate affine transformation between images is determined.
Figure 6. Key features extracted in 9 Gruber areas for corresponding original images
After co-registration of images, left image is divided into 3000*3000 tiles and their corresponding areas are found using
the 2D affine transformation obtained in previous step. There would be 30 image tiles in each image used in the experiments.
4.3 Epipolar resampling and computing disparity map
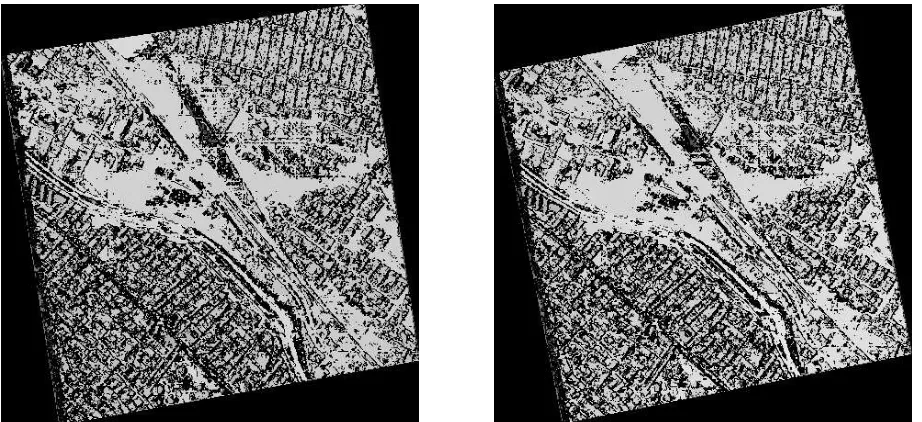
Now in each correspond image tile key features are detected such as previous step and using epipolar line equation obtained by Morgan method and fundamental matrix the epipolarly resampled images are generated. Figure 7 shows the epipolar images obtained by both methods.
After creation of epipolar images for each corresponding tile, SGM algorithm is used to compute disparity map. As mentioned earlier, disparity range is a critical input for SGM algorithm. Its value depends on the height variation in the image scene. By tiling the original image, height variation in each image tile is decreased compared with the original one. So using optimum values for disparity range will produce good results, with lower computation cost and also prevents mismatches due to repetitive texture. Best disparity range value for each image tile obtained manually by visual inspection are listed in Table 1.
Table 1. Selected disparity range for each image tile Tile number* Disparity range 19, 25, 29, 30 [0, 64] 5, 12, 18, 24, 28 [0, 198]
Other tiles [0, 128]
*The numbering strategy is presented in Figure 5
Figure 7. Stereo anaglyph of the generated epipolar images by fundamental matrix (left) and Morgan’s method (right)
Figure 8 contains the computed disparity map for both epipolar resampling methods.
Figure 8. Disparity map computed by SGM algorithm for epipolar images produced by fundamental matrix (left) and Morgan’s method (right)
4.4 Evaluation of results
Y-parallax values for correspond points in epipolar images are used to evaluate the results. Correspond points are generated through the SURF and RANSAC algorithm as proposed in previous steps. Generated correspond points and their y-parallax value are presented in Figure 9. Statistical analysis on y-parallax values are shown in Table 2.
Figure 9. Y-parallax of conjugate image points on the generated epipolar images by fundamental matrix (top) and Morgan’s method (bottom)
Table 2. Statistical analysis of y-parallax values
Epipolar resampling
method
Maximum y-parallax (pix)
Mean y-parallax (pix)
Standard deviation of y-parallaxes (pix)
Morgan’s method 0.78 0.25 0.34
Fundamental
matrix 0.80 -0.33 0.33
To evaluate the performance of SGM algorithm in disparity computation, the disparity value for 80 correspond points are measured manually. Then these values are compared to the
values computed by SGM algorithm. Evaluation results for both epipolar resampling methods are presented in Table 3.
Table 3. Statistical analysis of SGM algorithm
Epipolar resampling
method *Mean (Px-d)
Standard deviation (Px-d)
Morgan’s method 0.02 0.44
Fundamental matrix 0.09 0.54
*Px: x-parallax; d: disparity value
5. CONCLUDING REMARKS
In this paper we propose and analyse new epipolar resampling methods for high resolution stereo images. By dividing original images into small image tiles, the epipolar geometry in pushbroom images is simplified to straight line. Also using small tiles in SGM algorithm omits the need for high disparity change values. Consequently it increases the speed of algorithm and decrease wrongly matched points due to repetitive texture. Result of experiments in Table 2 demonstrates that epipolar images are produced with sub-pixel accuracy.
SURF and RANSAC algorithms with computer vision basis are used in the proposed method to automate the process of finding corresponding points. These algorithms omit the need for RPCs in this process.
The effect of epipolar resampling method on the result of image matching is presented in Table 3. It also demonstrates that the proposed methods have acceptable performance in SGM image matching.
REFERENCES
Bay, H., Ess, A., Tuytelaars, T., Van Gool, L., 2008. Speeded-up robust features (SURF). Computer vision and image understanding 110, 346-359.
Fischler, M.A., Bolles, R.C., 1981. Random sample consensus: a paradigm for model fitting with applications to image analysis and automated cartography. Communications of the ACM 24, 381-395.
Fraser, C.S., Hanley, H.B., 2003. Bias compensation in rational functions for IKONOS satellite imagery. Photogrammetric Engineering & Remote Sensing 69, 53-57.
Grodecki, J., Dial, G., 2003. Block adjustment of high-resolution satellite images described by rational polynomials. Photogrammetric Engineering & Remote Sensing 69, 59-68. Habib, A.F., Morgan, M.F., Jeong, S., Kim, K.-O., 2005. Epipolar geometry of line cameras moving with constant velocity and attitude. Electronics and Telecommunications Research Institute Journal 27, 172-180.
Hirschmüller, H., 2008. Stereo processing by semiglobal matching and mutual information. Pattern Analysis and Machine Intelligence, IEEE Transactions on 30, 328-341. Kim, T., 2000. A study on the epipolarity of linear pushbroom images. Photogrammetric engineering and remote sensing 66, 961-966.
Lee, H.-Y., Park, W., 2002. A New Epipolarity Model Based on the Simplified Push-Broom Sensor Model, International Archives of the Photogrammetry, Remote Sensing and Spatial Information Sciences, Ottawa. Canada, pp. 631-636.
Loop, C., Zhang, Z., 1999. Computing rectifying homographies for stereo vision, Computer Vision and Pattern Recognition, IEEE Computer Society Conference on. IEEE, Fort Collins, CO, USA.
Morgan, M., Kim, K.-O., Jeong, S., Habib, A., 2006. Epipolar resampling of space-borne linear array scanner scenes using parallel projection. Photogrammetric Engineering & Remote Sensing 72, 1255-1263.
Morgan, M., Kim, K., Jeong, S., Habib, A., 2004a. Epipolar geometry of linear array scanners moving with constant velocity and constant attitude, International Archives of the Photogrammetry, Remote Sensing and Spatial Information Sciences, Istanbul, Turkey, pp. 52-57.
Morgan, M., Kim, K., Jeong, S., Habib, A., 2004b. Indirect epipolar resampling of scenes using parallel projection modeling of linear array scanners, International Archives of the Photogrammetry, Remote Sensing and Spatial Information Sciences, pp. 52-57.
Oh, J.-H., Shin, S.-W., Kim, K.-O., 2006. Direct epipolar image generation from IKONOS stereo imagery based on RPC and parallel projection model. Korean Journal of Remote Sensing 22, 451-456.
Oh, J., 2011. Novel Approach to Epipolar Resampling of HRSI and Satellite Stereo Imagery-based Georeferencing of Aerial Images. The Ohio State University, The Ohio State, USA. Ono, T., 1999. Epipolar resampling of high resolution satellite imagery, Sensors and Mapping from Space, Hannover, Germany.
Wang, M., Hu, F., Li, J., 2010. Epipolar arrangement of satellite imagery by projection trajectory simplification. The Photogrammetric Record 25, 422-436.
Wang, M., Hu, F., Li, J., 2011. Epipolar resampling of linear pushbroom satellite imagery by a new epipolarity model. ISPRS Journal of Photogrammetry and Remote Sensing 66, 347-355. Zhao, D., Yuan, X., Liu, X., 2008. Epipolar line generation from IKONOS imagery based on rational function model, International Archives of the Photogrammetry, Remote Sensing and Spatial Information Sciences, pp. 1293-1297.