Ž .
Aquaculture 183 2000 105–124
www.elsevier.nlrlocateraqua-online
Estimating optimal population density for
intermediate culture of scallops in spat collector
bags
1Marcel Frechette
´
a,), Maurice Gaudet
b, Sylvain Vigneau
c aInstitut Maurice-Lamontagne, Ministere des Peches et des Oceans, 850 route de la Mer, C.P. 1000,` ˆ ´
Mont Joli, Quebec, Canada G5H 3Z4
b
Ministere de l’Agriculture, des Pecheries et de l’Alimentation, C.P. 338, Cap-aux-Meules,` ˆ ˆ
Iles de la Madeleine, Quebec, Canada G0B 1B0´
c ´
Association des Pecheurs de Petoncle des Iles-de-la-Madeleine, C.P. 516, Etang-du-Nord,ˆ ´ ˆ
Iles de la Madeleine, Quebec, Canada G0B 1E0´
Accepted 8 August 1999
Abstract
ˆ
In a scallop restocking project in Iles-de-la-Madeleine, Quebec, we investigated the spat´
growing within the collector bags, instead of using the usual pearl net method. To estimate optimal population density in the collector bags, we studied yield as a function of spat population
Ž . Ž .
density B–N curves at three depths in the water column 10, 20, 30 m and in a nearby lagoon. The B–N curves suggest that for 1-year-old spat, biomass at 10 m depth was maximum at ca. 1900 individual spat per bag. At higher population density, self-thinning occurred and yield decreased. The B–N curve for 20 m did not reach a maximum at the population densities encountered in the experiment. At population density ca. 2000 indrbag, yield of individualsG2 cm shell height was greater at 20 m than at 10 m, apparently because of higher food availability at 20 m and presence of interspecific competitors at 10 m depth. Yields in the lagoon and at 30 m depth were not satisfactory. Intermediate culture should be done at 20 m depth, with at least 2000 indrbag. The upper limit to this estimate could not be determined experimentally. q2000
Elsevier Science B.V. All rights reserved.
Keywords: Competition; Placopecten magellanicus; Scallop; Spat; Stocking density
)Corresponding author. Tel.:q1-418-775-0625; fax:q1-418-775-0740; e-mail: [email protected]
1 Ž ´
Contribution to the REPERE program REcherche sur le Petoncle a des fins d’Elevage et de REpeuple-´ `
.
ment .
0044-8486r00r$ - see front matterq2000 Elsevier Science B.V. All rights reserved.
Ž .
1. Introduction
Wild spat collection is a key step in most, if not all, scallop culture undertakings. The realization that many natural communities appear to be regulated by low settlement rate
ŽRoughgarden et al., 1987; Connolly and Roughgarden, 1998 , coupled with the need for.
obtaining abundant spat in commercial ventures, has oriented research toward maximiz-ing spatfall of scallops. This research has considered choice of depth, site and date of
Ž
collector deployment Brand et al., 1980; Giguere et al., 1994, 1995; Harvey et al.,
`
.
1995a; Chauvaud et al., 1996; Gallager et al., 1996; Pearce et al., 1996 ; use of natural
Ž .
and chemical attractants Harvey et al., 1993, 1997; Pearce and Bourget, 1996 ; effects
Ž
of modifying structural components of the collectors Pouliot et al., 1995; Miron et al.,
.
1996; Pearce and Bourget, 1996; Cashmore et al., 1998 ; and minimizing the presence of
Ž
competing or predatory species e.g., Thouzeau, 1991; Claereboudt et al., 1994;
Chau-.
vaud et al., 1996; Cashmore et al., 1998 . Although in many instances scallop spat
Ž 4
settlement has been found to be low, in other cases very high numbers )10
. Ž .
individuals per bag have been reported Thouzeau, 1991; Felix-Pico et al., 1997 .
´
Heavy spat settlement may eventually lead to intraspecific competition as individual growth proceeds, especially in species where early spat survival is high in collector bags
ŽGiguere et al., 1995; Harvey et al., 1995a .
`
.ˆ
Ž .The scallop fishers’ association of Iles-de-la-Madeleine APPIM , Quebec, has been
´
Ž .
involved in a giant scallop Placopecten magellanicus Gmelin restocking project since
Ž .
the early 1990s Cliche et al., 1997 . The production scheme envisaged at the beginning
Ž . Ž .
of the program involved three steps: 1 wild spat collection in the Fall, 2 intermediate culture in pearl nets for about 1 year, starting the Summer following spat collection
Žindividual size increases from 1 to 3 cm shell height , and 3 sowing on the bottom for. Ž .
final grow-out. Intermediate culture in pearl nets is costly. Consequently, APPIM has been considering keeping the spat within the collector bags for nearly 1 year before sowing, in order to avoid transferring the spat into pearl nets for intermediate culture.
Ž .
This technique has been used extensively in New Zealand Bull, 1994 . It is not known, however, whether intermediate culture can be done efficiently within the spat collector bags. Spat numbers could be too low to provide satisfactory yield, or conversely, so high that competition would result in growth reduction and mortality within the bags, with corresponding loss in yield and decreased post-sowing survivorship owing to the smaller
Ž .
scallop size Thouzeau and Lehay, 1988; Barbeau and Scheibling, 1994a .
Here we report an experiment designed to assess the effect of scallop population density on the yield of spat kept in the collector bags for the whole duration of intermediate culture.
2. Methods
2.1. Valid competition experiments without controlled population density treatments
Ž
Estimating optimal stocking density OSD; here defined as the population density
.
yielding maximum biomass is an obligate requirement for efficient culture operations.
Ž .
( )
M. Frechette et al.´ rAquaculture 183 2000 105–124 107
was estimated for groups of known and experimentally controlled population density
ŽN at the beginning of the experiments and B is reported as a function of initial N..
Expressing yield as a function of population density at harvest, however, allows the
Ž .
generation of B–N curves Fig. 1A , which lead to a more heuristic analysis of results
ŽWestoby, 1984 . In addition to estimating OSD, B–N curves may allow estimation of. Ž
self-thinning functions, which may be quite useful in aquaculture management see
.
Frechette et al., 1996 . The point here is that knowledge and control of initial population
´
density is no longer required with B–N curves because yield is expressed as a function of final density. Since initial population density in collector bags is neither known nor controlled, at best, it can be known in a statistical sense only, B–N curves are appropriate for estimating OSD in collector bags. To illustrate this, let us consider the hypothetical experiments depicted in Fig. 1. The B–N curve in Fig. 1A is obtained in a stocking experiment where initial population density of the experimental groups, ranging from N 1 to N 8, is known and controlled by the experimenter. Yield increases linearly from density N 1 to N 3 because of absence of competition at low density. At higher
Ž .
population density N4 and N5 , however, yield increase is curvilinear because of competition-induced reduction of individual growth. In Fig. 1A, yield is maximum for group N5, which is OSD. As initial population density is increased further, however, yield decreases. This is because competition is so intense that it results not only in
Ž
growth reduction, but also in mortality. This is the self-thinning region Yoda et al.,
.
1963; Westoby, 1984 .
Fig. 1B depicts a stocking experiment similar to that in Fig. 1A, with the same growth dynamics and environmental conditions. Here the initial population density of groups is unknown, but it spans an array similar to Fig. 1A. We mimic this situation by adding a random term to the treatment groups of N 1, N 2, . . . , N 8 individuals shown in Fig. 1A. As individual growth proceeds in each group, biomass increases according to the same constraints as in Fig. 1A. Therefore, the resulting B–N curve in Fig. 1B matches closely that in Fig. 1A, except that the actual position of data points along the curve is different. At population densities -N 3, the match is perfect since individual growth is not biomassrdensity-dependent. Maximum yield in Fig. 1B is observed
Ž . Ž .
Fig. 1. A B – N curve solid line for stocking experiment with controlled population density treatments.
Ž . Ž .
Ž .
between N4 and N5, which is sufficiently close to the true OSD N5 in Fig. 1A to be a reasonable estimate. For this approach to be useful, however, the unknown initial population density of the groups must span a large range. It is also assumed that competition-independent mortality is negligible, which appears to be a reasonable
Ž
assumption, at least in some scallop species Giguere et al., 1995; Harvey et al., 1995a;
`
see Westoby, 1984; Frechette et al., 1996, for discussions of B–N curves in cases where
´
.
competition-independent mortality is significant .
Alternative approaches may be preferred to the B–N curve methodology presented in Fig. 1B. For instance, the spat could be induced to detach from the collectors using an
Ž .
appropriate treatment e.g., Taylor et al., 1997 . Subsequently, spat could be induced to resettle at an appropriate density using, for example, various larval densities or
attrac-Ž .
tants of varying efficiency e.g., Harvey et al., 1995b . A classic stocking experiment
Ž .
could then be performed e.g., Fig. 1A . This approach assumes, however, that routine operations would involve a similar detachment–reattachment step and that growth conditions within the experimental collectors remain similar to those in unmanipulated bags. We decided to use the simple, non-disruptive methodology depicted in Fig. 1B instead of attempting to manipulate population density.
2.2. Spat collection
Spat collection was made in the Fall of 1995, at a site known as La Perle reef
Ž X X .
47819.51 N, 61832.00 W . Water depth was 32 m. Spat were collected using onion bags
Ž38 cm=80 cm; 0.3 cm mesh size stuffed with three pieces of Netron. e. Groups of collectors, six pairs for each line, were attached along lines held vertically above the bottom using an individual buoy for each line. The vertical distance between each pair was 0.8 m. Bottom weights were attached to each vertical line, which themselves were attached to an anchored main line to hold them in place and facilitate retrieval. The collector bags were kept on site until the beginning of the stocking experiment itself, early in the summer following spat collection.
2.3. Initial conditions
Ž .
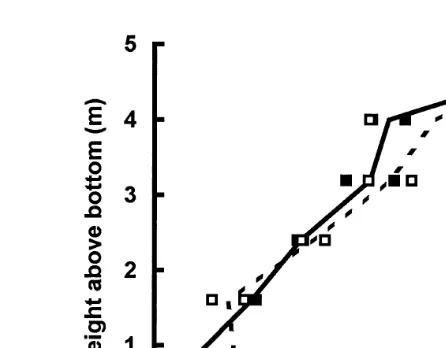
In the Fall of 1995 25r11r95 , APPIM found that spat density in collectors held in vertical arrays near the bottom ranged from about 300 individualsrcollector to about 4000 individualsrcollector. Spat population density increased with height above the
Ž .
bottom Fig. 2 . This provided a large range of initial population densities to study B–N curves according to the methods depicted in Fig. 1B. A preliminary experiment had suggested that within this range of population densities, competition was likely to occur
Ž .
if intermediate culture was attempted within the collector bags Frechette, 1996 .
´
2.4. Experimental protocol
For the experiment proper, collectors were deployed in two sites, on La Perle reef
X X
ˆ
Ž47819.51 N, 61832.20 W and in the lagoon of Havre-aux-Maisons, Iles-de-la-Madeleine,.
Quebec. On La Perle reef, vertical stratification in temperature and a deep maximum in
´
Ž .
( )
M. Frechette et al.´ rAquaculture 183 2000 105–124 109
Fig. 2. Relationship between number of individual scallop spat and height above the bottom. Empty and solid squares represent bags from two different collector lines. Solid and broken lines connect the means of each group.
temperature and food affect bivalve growth, the B–N curves were expected to vary with
Ž . Ž .
depth. Therefore, we installed collector bags at three depths, above 10 m , at 20 m ,
Ž . Ž .
and below 30 m the expected depth of the thermocline. Four lines 48 bags were installed at each depth. To ensure that conditions would be homogenous among bags, the vertical lines were attached horizontally at each depth. The arrangement of lines was
Ž
essentially the same in Havre-aux-Maisons lagoon, except that only one depth 1 m
.
below surface was studied because of shallow water depth. The lines were installed on 18 June 1996. Two lines were retrieved from each depth of each site on 29 August 1996. The remaining lines were retrieved on 8 October 1996.
2.5. Processing of spat samples
At the end of the experiment, collector bags were processed in a field laboratory located near Havre-aux-Maisons. Total spat of all bivalves was weighted. A subsample of known mass was preserved in 95% ethanol and sent to IML, where all individuals of each bivalve species were counted and weighted together. These numbers were then multiplied by the ratio of the mass of the total sample to the weight of the subsample to yield estimates of population density and biomass of each bivalve species. Empty scallop shells and other macrofaunal species such as starfish were counted according to
Ž .
the same method. Size structure of scallops 0.5 cm size classes was estimated for all of the October samples except those from 30 m depth, La Perle reef.
2.6. Fluorescence and temperature
We estimated fluorescence as a proxy for chlorophyll a concentration. Fluorescence
Ž .
samples from each depth were pumped onboard a small ship at 30-min intervals, except on 1 August, where owing to rough weather, sampling was interrupted after taking two samples. These data were not included in the analysis because the pump could not reach
Ž
the desired depth. Fluorescence was estimated using whole-water samples 1.2 ml
.
seawater extracted in 6.8 ml acetone; see Phinney and Yentsch, 1985 . Fluorescence
Ž .
patterns were analyzed in a two-way factorial ANOVA with date random factor and
Ž .
depth fixed factor as main effects. Half-hourly samples were pooled within days and replicates were pooled within depths and dates. Differences between depths were tested using a priori contrasts. Temperature was monitored hourly at each depth at La Perle
Ž .
reef VEMCO Minilogs; Armdale, Nova Scotia . Hourly data were averaged on a daily basis. Temperature and chlorophyll a in the lagoon were not measured.
2.7. Estimating OSD
The B–N curves and OSD were studied in three steps. First, we identified the independent variables to be included in the analysis of yield by stepwise regression
Žln–ln data , since both intraspecific and interspecific interactions were to be expected in.
the bags. The dependent variable was scallop biomass, and the independent variables were scallop population density, mussel biomass and other bivalves’ biomass. Scallop population density was forced in the statistical model as the first variable. Second, we tested the B–N curves for any evidence of curvilinearity as a criterion for inferring the presence of intraspecific competition. Since the absence of competition is reflected by
Ž .
straight B–N curves e.g., densities N 1 to N 3 in Fig. 1A , the value of the regression coefficient for N was tested against the hypothesis of a slope smaller than 1 following
Ž . Ž .
Clarke 1980 Model II regressions; ln–ln data . The analysis of B–N curves lacking evidence of competition was not pursued further. In step three, we analyzed yield in the remaining groups in terms of number of individuals larger than 2.0 cm shell length
ŽN2q., as a function of N. Each group was fitted to a quadratic statistical model
Ž 2 .
N2qsbNqcN ; c-0 . Solving forEN2qrENs0 yields Nmax, an estimate of OSD in terms of yield of spat G2 cm shell length. The equation for the 95% confidence limits of Nma x is given in Appendix A.
3. Results and discussion
3.1. EnÕironmental conditions
Ž .
( )
M. Frechette et al.´ rAquaculture 183 2000 105–124 111
Ž .
Fig. 3. La Perle reef. Temperature 8C at 10, 20 and 30 m depth during the experiment, June to October, 1996.
68C from June to the end of August. During September and early October, the trend was inverted at 30 m as compared to 10 and 20 m, as the thermocline progressively eroded. In early October, temperature was about 108C at 30 m.
Ž .
Vertical stratification was obvious in food concentration also Fig. 4 . On all occasions, fluorescence concentration was maximum at 20 m depth. Fluorescence was
Ž .
lower in July than in August. The interaction term Fw6,36xs44.3, P-0.001 was significant. Therefore, contrasts between fluorescence at 20 m on one hand, and at 10 and 30 m on the other hand, were made for each date separately. The contrasts were significant on all dates, with PF0.0003 in all cases. This suggests that vertical stratification in food concentration occurred on all dates, but that its intensity varied through time.
Ž .
3.2. Composition of communities within the collectors
In addition to scallops, other bivalves, Mytilus edulis, Hiatella arctica and Anomia
Ž .
sp., were found in the collectors Table 1 . Occasionally, unidentified gastropods were also present in low numbers, but they were not included in data analysis. Starfish occurred in significant numbers only on La Perle reef, 10 m depth on both sampling dates, and at 20 m depth in October. On La Perle reef, scallops dominated the assemblages in the bags, both in terms of biomass and population density, but this was not the case in the lagoon. This was possibly due to heavy spatfall of mussels after the
Ž .
bags had been installed in the lagoon. Giguere et al. 1995 provided an extensive list of
`
species normally encountered in collector bags throughout the year. In contrast to our situation, they found that P. magellanicus did not dominate the assemblages. Although the reasons for this are unclear, they may have to do with the fact that the study of
Ž .
Giguere et al. 1995 included samples taken shortly after spat collection, whereas our
`
experiment lasted nearly a year after spat collection. Emigration of species other than scallops out of the collectors may result in significant changes in collector communities
ŽHortle and Cropp, 1987; Cashmore et al., 1998 ..
3.3. B–N curÕes
Ž .
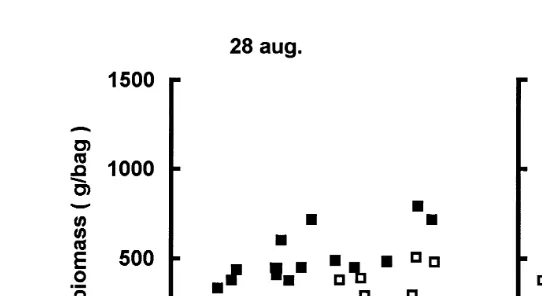
The B–N curves for scallops are shown in Fig. 5 La Perle reef and Fig. 6
ŽHavre-aux-Maisons lagoon . For all sites and depths, the elevation of the curves.
increased with time. There was also temporal and spatial variability in the shape of the curves. B–N curves of all groups, except for those from La Perle reef at 30 m, appeared to be curvi-linear with decreasing slope as density increased. Such patterns are consis-tent with competition as they imply that body size decreased with increasing population density. Biomass increased monotonously with population density in all cases, except at La Perle reef in October, 10 m, where scallop biomass peaked at f1200 grcollector
ŽNf1800 individualsrcollector and decreased at higher population density..
Ž .
Statistical regression models of the B–N curves ln–ln data are shown in Table 2. Collinearity was negligible, the highest condition number being 10.6. In addition to N,
Ž .
which was forced as the first variable in the regression models, mussel biomass BM
Ž . Ž .
and other mollusc’s biomass BA significantly affected scallop biomass B in some
Ž .
cases, but not in others Table 2 . Since all groups had presumably collected similar spat assemblages in the Fall of 1995, variability in the list of independent variables suggests that larval settlement and community processes occurring after the beginning of the experiment were quite dynamic. For instance, mussels were abundant in bags from the
Ž .
lagoon, but not from elsewhere Table 1 . In addition, starfish were abundant only at La
Ž .
Perle reef, 10 m depth August and October and 20 m depth in October. Suspension feeders have been found to negatively affect scallop growth in a number of instances
Že.g., Claereboudt et al., 1994; Lodeiros and Himmelman, 1996 . Our results support.
()
M.
Frechette
et
al.
r
Aquaculture
183
2000
105
–
124
´
113
Table 1
Ž . Ž .
Mean population density N per bag and biomass B, g per bag of macrobenthic species in the collectors. Standard errors are given in parentheses. S is the proportion of surviving scallops, as computed from the ratio of live scallops to the sum of live plus empty shells
Site Date Depth Scallops Mussels Other bivalves Starfish
N B S N B N B N
Ž . Ž . Ž . Ž . Ž . Ž . Ž . Ž .
La Perle August 10 1658 254 421 42 0.97 0.006 303 50 65 12 641 169 48 14 336.4 62.2
Ž . Ž . Ž . Ž . Ž . Ž . Ž . Ž .
20 1912 337 241 36 0.99 0.004 345 45 23 4 803 228 61 15 2.6 2.1
Ž . Ž . Ž . Ž . Ž . Ž . Ž . Ž .
30 1623 259 51 8 0.90 0.02 366 35 5 0.8 906 241 59 17 0.5 0.5
Ž . Ž . Ž . Ž . Ž . Ž . Ž . Ž .
October 10 1911 172 698 47 0.78 0.04 1054 105 238 27 1580 276 160 27 257.5 44.5
Ž . Ž . Ž . Ž . Ž . Ž . Ž . Ž .
20 876 171 562 83 0.92 0.02 475 53 210 28 213 49 16 5 233.0 19.0
Ž . Ž . Ž . Ž . Ž . Ž . Ž . Ž .
30 1531 152 221 22 0.98 0.005 500 37 28 3 878 197 94 22 1.5 0.8
Ž . Ž . Ž . Ž . Ž . Ž . Ž . Ž .
Lagoon August 1 705 107 187 23 0.99 0.02 12,571 1786 312 24 617 123 30 7 1.6 0.8
Ž . Ž . Ž . Ž . Ž . Ž . Ž . Ž .
Ž . Ž .
Fig. 5. La Perle reef. B – N curves for scallops at 10 m solid squares , 20 m empty squares and 30 m
Žcrosses depth in August and October 1996..
The general shape of the B–N curve for the 10 m samples from La Perle, October, was non-monotonous, unlike the other curves. A third-order polynomial with BA as a
Ž .
fourth term yielded an excellent fit Table 2 . All three terms for N were significantly
Ž 2 3
different from 0 N: Fs66.97, Ps0.0001; N : Fs20.02, Ps0.0003; N s11.55,
.
Ps0.0032 . Therefore, there was strong evidence of intraspecific and interspecific competition in this group of samples, and self-thinning occurred at high density, as implied by the positive N3 term in Table 2.
The other groups were tested for intraspecific competition following the procedures
Ž .
outlined in Section 2 see Section 2.7 . The regression coefficients and the test statistics are shown in Table 3. Model II slopes were not smaller than 1 in all August samples and in October samples from La Perle, 30 m depth. This suggests that there was no
Ž . Ž
Fig. 6. Havre-aux-Maisons lagoon. B – N curves for scallops in August empty squares and October solid
.
( )
M. Frechette et al.´ rAquaculture 183 2000 105–124 115 Table 2
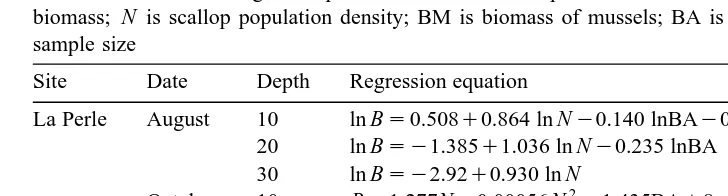
Ž .
Statistical model relating scallop biomass and the independent variables see Section 2.7 . B is scallop biomass; N is scallop population density; BM is biomass of mussels; BA is biomass of other bivalves; n is sample size
2
Site Date Depth Regression equation R n
La Perle August 10 ln Bs0.508q0.864 ln Ny0.140 lnBAy0.084 lnBM 0.93 20
20 ln Bsy1.385q1.036 ln Ny0.235 lnBA 0.95 16
30 ln Bsy2.92q0.930 ln N 0.98 24
2 y8 3
October 10 Bs1.277Ny0.00056 N y1.435BAq8P10 N 0.96 22
20 ln Bs1.790q0.675 ln N 0.93 12
30 ln Bsy2.159q0.978 ln Nq0.238 lnBMy0.96 lnBA 0.97 20
Lagoon August 1 ln Bsy0.369q0.859 ln N 0.92 24
October 1 ln Bs2.144q0.710 ln Ny0.269 lnBA 0.93 23
intraspecific competition in these four groups, although interspecific competition oc-curred in the groups from 10 and 20 m, as inferred from the significant BA and BM terms in Table 2. It is unclear what competition mechanisms were acting, but it is likely that food regulation early in the experiment would have resulted in intraspecific competition as well as in interspecific competition. Since the hypothesis of intraspecific competition was not supported by results in Table 3, we suspect that the curvi-linear
Ž .
patterns in the B–N curves for 10 and 20 m, August Fig. 5 , were attributable to interference competition of Mytilus, Hiatella and Anomia with scallops.
At 30 m depth, individuals were small. Presumably, growth was slow because of low
Ž . Ž .
temperature Fig. 3 and low food availability Fig. 4 , and probably also because
Ž .
resuspended particles retarded growth Emerson et al., 1994 . As a result, body size-density combinations typical of competition were not reached and the B–N curves
Ž .
were straight Fig. 5 . The concept of optimal population density requires that
intraspe-Table 3
Ž .
Analysis of the regression coefficient for scallops in multispecific B – N curves ln–ln data
Ž . Ž .
Model II regression coefficients mII were tested against the null hypothesis H : m0 IIs1 H : m1 II-1 ,
Ž . wŽ . Ž 2.x
following Clarke 1980 . Degrees of freedom were calculated as dfs2q nyir1q0.5r , where n is
Ž .
sample size, i is the number of independent variables of the statistical model see Table 2 and r is the correlation coefficient between B and N. Where applicable, r was partialized for all independent variables other than N.
Site Date Depth r mII T df P
U
La Perle August 10 0.92 0.942 0.600 13.3 n.s.
U
20 0.91 1.155 1.180 11.3 n.s.
U w x
30 0.99 0.939 2.100 16.8 0.05, 0.10
October 10 †
U
20 0.97 0.699 4.313 8.8 -0.01
U
30 0.96 1.015 0.224 12.9 n.s.
U
Lagoon August 1 0.96 0.897 1.787 17.1 n.s.
U
October 1 0.91 0.737 5.083 15.7 -0.001
U Ž .
cific competition be present. Since the results in Table 3 do not support the hypothesis of intraspecific competition for any of the August samples and for La Perle, 30 m depth in October, the analysis of these groups was not pursued further.
Ž .
In the remaining groups October; except La Perle, 30 m depth , there was evidence of intraspecific competition since the regression coefficients for the scallop terms of the
Ž .
B–N curves were smaller than 1 Table 3 . On La Perle reef, 20 m depth, only intraspecific competition occurred, while there was evidence of intraspecific competition
Ž .
and interspecific competition BA term at 10 m depth, La Perle, and in the lagoon
ŽTable 2 . In the case of the 10 m samples, La Perle, solving for. EBrENs0 indicates that scallop biomass reached a maximum at Ns1979 individuals per bag. Heavier spatfall resulted in self-thinning and loss of yield. Clearly, this provides an upper limit to OSD at 10 m, October.
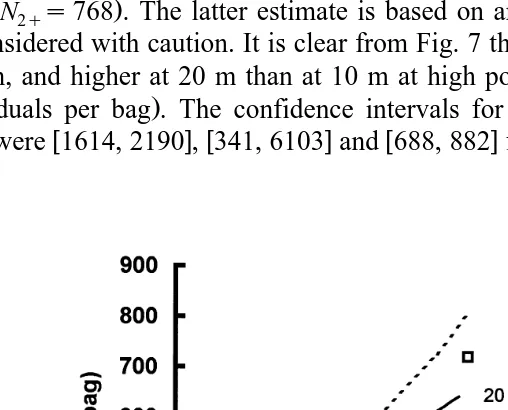
Ž
The relationship between N2q and total population density was dome-shaped Fig.
. Ž .
7 . These results suggest that N2q was maximum i.e., EN2qrENs0 for Nmaxs785
Ž .
indrbag in the lagoon with yield N2qs151 , Nmaxs1902 indrbag at La Perle, 10 m
Ž . Ž
depth with yield N2qs376 , and NmaxG2000 indrbag at La Perle, 20 m depth with
. Ž
yield N2qG640 . If we extrapolate the relationship, we get Nmaxs3222 indrbag with
.
yield N2qs768 . The latter estimate is based on an extrapolation and therefore should be considered with caution. It is clear from Fig. 7 that maximum yield was lowest in the
Ž
lagoon, and higher at 20 m than at 10 m at high population density i.e., at about 2000
.
individuals per bag . The confidence intervals for Nma x, which is equivalent to OSD
w x w x w x
here, were 1614, 2190 , 341, 6103 and 688, 882 for 10 and 20 m depth, La Perle, and
Ž .
Fig. 7. Number of individual scallop spat equal to or larger than 2.0 cm shell length N , as a function of2
( )
M. Frechette et al.´ rAquaculture 183 2000 105–124 117
the lagoon, respectively. Clearly, OSD is larger at La Perle than in the lagoon. The large confidence interval for Nmax at 20 m do not allow discrimination between 10 and 20 m depths on the basis of OSD. There were differences in yield, however, indicating that growth conditions were better at 20 m than at 10 m. Depth-related differences in growth of giant scallops have been attributed to the combined effect of food availability,
Ž .
temperature and fouling organisms Cote et al., 1993; Claereboudt et al., 1994 . In the
ˆ ´
Ž .
Gryllefjord, northern Norway, Wallace and Reinsnes 1985 found that vertical patterns in growth of cultured Iceland scallops were driven by depth-related differences in seston concentration. In the present experiment, temperature was higher at 10 m than at 20 m early in the experiment, and basically the same at both depths from the end of August to
Ž .
the end of the experiment Fig. 3 . However, growth, as measured by N2q at high
Ž .
population density Fig. 7 , was higher at 20 m. Differences between 10 and 20 m
Ž .
reflected higher food availability at 20 m depth Fig. 4 and the effect of interspecific
Ž .
competition with other molluscs Table 2 . It is likely also that acclimation of feeding dynamics to lower temperature led to growth being relatively more dependent on food availability than on temperature, as suggested by simulation of mussel bioenergetics in
Ž .
cold water situations Grant, 1996 .
Ž .
It is clear that OSD, as based on N2q Fig. 7 , is quite the same as the value obtained
Ž .
from the B–N curve Table 2, Fig. 5 . The B–N curve, however, is based on the crudest possible measurements, bulk biomass and population density, and thus appears to be quicker and handier than other approaches.
3.4. Competition mechanisms
Size distributions for selected samples are shown in Fig. 8. These samples had lowest, medium and highest population density of their respective groups. Mean size decreased as population density increased. This general pattern was exacerbated by increasing skewness to the right, which is consistent with asymmetric competition
ŽBegon et al., 1986 . Asymmetric competition has generally been ascribed to physical.
Ž .
interference between individuals, both in mussels Okamura, 1986 and in plants
ŽThomas and Weiner, 1989; Weiner, 1990 . In contrast to interference, competition for. Ž
resources such as water and nutrients is less asymmetric in plants Thomas and Weiner,
.
1989; Weiner, 1990 , or has shown no evidence of asymmetry in food-regulated feeding
Ž .
of benthic suspension feeders Peterson, 1982; Frechette and Bourget, 1985a,b . Asym-
´
metry in competition, however, should not be seen as implying that the competition mechanism was interference by physical contact, since small-scale depletion in food resources around mussels grown in the laboratory, free of interference, may lead to
Ž .
asymmetric competition Frechette and Despland, 1999 . There is no a priori reason to
´
reject the idea that the same mechanism might have been acting in the spat bags.
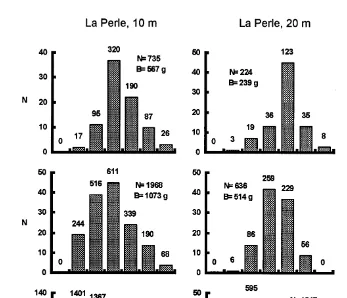
3.5. Mortality
Fig. 8. Size frequencies of scallops in October. Column at the left is from La Perle reef, 10 m depth. Central column is from La Perle reef, 20 m depth. Right hand side column is from the lagoon. Upper, middle and lower rows are for low, medium, and high population density. Vertical axis represents actual scallop numbers in the subsamples. Numbers above the bars are estimated abundance of each size class for the whole bag. N is estimated abundance of scallops for the whole bag. B is the biomass of the whole bag. Note changes in vertical scale. Width of size classes is 0.5 cm.
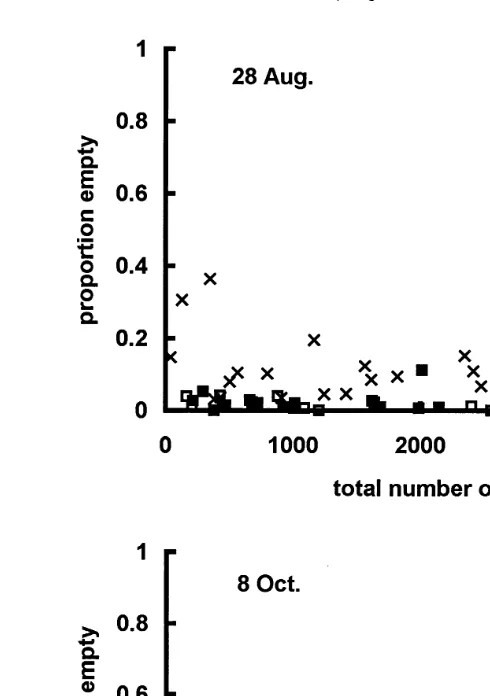
Ž .
any empty shells in these samples Table 1 . There was little pattern in the occurrence of empty shells in August, although they appeared to be more frequent at 30 m depth,
Ž .
especially at low total shell population density Fig. 9 . In October, the proportion of empty shells increased with total number of shells and was highest for La Perle, 10 m depth, where it reached a maximum at about 2000 total shells per bag. At high shell
Ž .
numbers )2000rbag , however, the proportion of empty shells was quite variable, and
Ž .
( )
M. Frechette et al.´ rAquaculture 183 2000 105–124 119
Ž .
Fig. 9. La Perle reef. Relationship between empty shells and total number of shells emptyqalive . Solid squares: 10 m depth. Empty squares: 20 m depth. Crosses: 30 m depth.
October, where biomass decreased with population density above ca. 2000 indrbag
ŽFig. 5 . The magnitude of competition-driven mortality could not be estimated from the.
self-thinning curve because initial population density was unknown and perhaps there were losses of empty shells through the mesh of the bags.
Communities in collector bags typically include potential scallop predators, especially
Ž .
starfish Naidu and Scaplen, 1976; Thouzeau, 1991; Claereboudt et al., 1994 . Starfish occurred in significant numbers on La Perle reef at 10 m on both dates, and at 20 m in October. This raises the possibility that the decreasing part of the B–N curve from 10 m depth, which we interpreted as resulting from competition, was partly shaped by
Ž .
predation. Detailed studies of predation by starfish AsteriasÕulgaris on juvenile sea
and that the scallops’ escape response was effective in decreasing predation by starfish
ŽBarbeau and Scheibling, 1994a,b . Starfish were unable to kill scallops larger than.
Ž .
about one-third their own size Fig. 6 in Barbeau and Scheibling, 1994a . We measured the size of the starfish found in the bags with low, medium and high population density
Ž . Ž .
from La Perle, 10 m see Fig. 8 , following Barbeau and Scheibling 1994a . Starfish
Ž . Ž .
size was 1.59"0.20 cm mean"SD; ns16 , 1.61"0.30 cm ns49 and 1.67"0.45
Ž .
cm ns3 in the low, medium and high density bags, respectively. Considering the size
Ž .
of scallops typically )1 cm; Fig. 8 relative to that of seastars, it seems unlikely, based
Ž .
on Barbeau and Scheibling 1994a; b , that seastars would have been a major source of mortality. Predation, however, is generally highest against slow-growing, weak prey, and it is likely that scallops in high density bags were indeed in low condition. Furthermore, the escape response of scallops in collector bags was probably hampered by their being in bags crowded with collector material and other organisms, as suggested
Ž
by the positive effect of tethering on predation rate by starfish Barbeau and Scheibling,
.
1994c . Therefore, actual predation rate could have been higher than predicted from laboratory studies. To our knowledge, predation dynamics in collector bags have yet to be studied.
3.6. Management issues
Our results clearly indicate that yield was largely determined by scallop population
Ž .
density, as found in many controlled stocking experiments e.g., Cote et al., 1993 . In
ˆ ´
addition, yield was strongly influenced by environmental conditions and larval settle-ment of other species during intermediate culture. To maximize yield from intermediate
ˆ
culture within spat collector bags in the vicinity of Iles-de-la-Madeleine, scallop population density should be at least 2000 individual spat per bag and intermediate culture be made at 20 m depth. Extrapolation suggests that OSD may actually be as high as 3200 individuals per bag.
ˆ
Investigations of appropriate sites for spat collection in the vicinity of Iles-de-la-Madeleine have shown that spat population density in the bags exceeded 3000 indrbag
Ž .
in a number of sites Cliche and Giguere, 1997 . In addition, increases in scallop
`
spawning stocks have resulted in positive long-term trends in spatfall intensity in Japan,
Ž .
for instance Aoyama, 1989 . Furthermore, the 2.0 cm target size used in step 3 is somewhat arbitrary. It is a compromise between the need to maximize the number of individual spat obtained and the need to obtain as large as possible animals to minimize
Ž .
the probability of death after sowing Barbeau and Scheibling, 1994a . Future work may emphasize the need for increasing target size, which can only be attained through lower population densities. Therefore, it is a real possibility that spatfall intensity eventually leads to spat population exceeding OSD.
Spatfall intensity is generally seen as uncontrollable because of annual and spatial
Ž .
variability Aoyama, 1989; Giguere et al., 1995 . On the other hand, field studies have
`
shown that larval distribution may be structured spatially when vertical stratification is
Ž .
strong Tremblay and Sinclair, 1988, 1990, 1992 . Laboratory work has shown that spatfall intensity closely correlates with vertical structure in larval abundance which
Ž
( )
M. Frechette et al.´ rAquaculture 183 2000 105–124 121 .
al., 1996 . In other situations, however, sea scallop larvae may exhibit stock-related
Ž .
differences in migratory behavior and vertical distribution Manuel et al., 1996a,b , or
Ž
the larvae may be dispersed vertically by turbulence Tremblay and Sinclair, 1988,
.
1990; Pearce et al., 1998 . Therefore, knowledge of larval abundance in a given year and settlement preferences of larvae in relation to the depth of the thermocline, or,
Ž . Ž
alternatively, height above the bottom Brand et al., 1980 or collection site Giguere et
`
.
al., 1995; Cliche and Giguere, 1997 , may be combined to provide forecasts of
`
settlement intensity in a given site, depth and year. Spat collecting techniques, such as choice of site and depth of collectors, may be adjusted accordingly in a goal-seeking
Ž .
strategy e.g., f3200 individual spat per bag, 20 m depth . Alternatively, any form of control of spatfall abundance may be out of reach. In this case, knowledge of spat abundance shortly after spatfall may provide early information for deciding whether the spat should be thinned out. In practice, this is achieved by removing one or more of the
Ž
Netron pieces, with its associated spat Dr. Hideyoshi Sasaki, Osyamanbe,
Yamakoshi-.
gun Prefecture, Hokkaido, Japan, pers. comm. .
Acknowledgements
We thank Jules Arseneau, Francine Aucoin, Yvon Chevarie, Carole Cyr, Delphine Dransart, Franc
¸
ois Gallien, Denise Hebert, Jacques Richard, Manon Theriault, Jean-Guy´
´
Turbide and especially Linda Girard for assistance with field and laboratory work. SCUBA diving to adjust and inspect the lines was done by Sylvain Boudreau, Mario Deraspe, Guy Dumas, Donald Poirier and Mario Poirier. Gaetan Daigle provided
´
´
invaluable assistance in statistical analyses.
Appendix A
Ž .
Confidence limits for Nma x where EN2qrENs0 . Since Nmaxs ybr2 c, where b and c are adjusted parameters, we estimated the 95% confidence limits for Nma x with
Ž . Ž Ž .. Ž . Ž .
var Nma x s var brc r4, var brc being estimated following Agresti 1990 . The
Ž . Ž Ž ..0.5
confidence limits are given by ybr2 c "1.96Ø var Nmax .
References
Agresti, A., 1990. Categorical Data Analysis. Wiley.
Aoyama, S., 1989. The Mutsu Bay scallop fisheries: Scallop culture, stock enhancement, and resource
Ž .
management. In: Caddy, J.F. Ed. , Marine Invertebrate Fisheries: Their Assessment and Management. Wiley, New York, pp. 525–539.
Ž
Barbeau, M.A., Scheibling, R.E., 1994a. Behavioral mechanisms of prey size selection by sea stars Asterias
. Ž . Ž
Õulgaris Verrill and crabs Cancer irroratus Say preying on juvenile sea scallops Placopecten
Ž ..
w
Barbeau, M.A., Scheibling, R.E., 1994b. Temperature effects on predation of juvenile sea scallops
Placopec-Ž .x Ž . Ž .
ten magellanicus Gmelin by sea stars AsteriasÕulgaris Verrill and crabs Cancer irroratus Say . J. Exp. Mar. Biol. Ecol. 182, 27–47.
Barbeau, M.A., Scheibling, R.E., 1994c. Procedural effects of prey tethering experiments: predation of juvenile scallops by crabs and sea stars. Mar. Ecol. Prog. Ser. 111, 305–310.
Begon, M., Harper, J.L., Townsend, C.R., 1986. Ecology. Individuals, Populations and Communities. Sinauer Associates, Sunderland, MA, p. 876.
Ž .
Brand, A.R., Paul, J.D., Hoogesteger, J.N., 1980. Spat settlement of the scallops Chlamys opercularis L. and
Ž .
Pecten maximus L. on artificial collectors. J. Mar. Biol. Assoc. U.K. 60, 379–390.
Bull, M.F., 1994. Enhancement and management of New Zealand’s Southern Scallop fishery. In: Bourne,
Ž .
N.F., Bunting, B.L., Townsend, L.D. Eds. , 9th International Pectinid Workshop, Vol. 2. Nanaimo, B.C., Canada, April 22–27, 1993, pp. 131–136.
Cashmore, D., Learmouth, M.M., MacMillan, J.T., 1998. Improving the efficiency of wild Pecten maximus spat collection: potential effects of spat bag design and of species temporarily settling in spat bags. Aquaculture 160, 273–282.
Chauvaud, L., Thouzeau, G., Grall, J., 1996. Experimental collection of great scallop postlarvae and other benthic species in the Bay of Brest: settlement patterns in relation to spatio-temporal variability of environmental factors. Aquacult. Int. 4, 263–288.
Claereboudt, M.R., Bureau, D., Cote, J., Himmelman, J.H., 1994. Fouling development and its effect on theˆ ´
Ž .
growth of juvenile giant scallops Placopecten magellanicus in suspended culture. Aquaculture 121,
327–342.
Clarke, M.R.B., 1980. The reduced major axis of a bivariate sample. Biometrika 67, 441–446.
Cliche, G., Giguere, M., 1997. Captage du naissain de petoncle geant en milieu naturel aux Iles-de-la-Madeleine,` ´ ´
ie`me
Compte-Rendu de la 5 Reunion annuelle de transfert de technologie. Programme REPERE, Ministere´ ` de l’Agriculture, des Pecheries et de l’Alimentation, pp. 37–50.ˆ
Cliche, G., Vigneau, S., Giguere, M., 1997. Status of a commercial sea scallop enhancement project in` ˆIles-de-la-Madeleine, Quebec, Canada. Aquacult. Int. 5, 259–266.´
Connolly, S.R., Roughgarden, J., 1998. A latitudinal gradient in Northeast Pacific intertidal community structure: evidence for an oceanographically based synthesis of marine community theory. Am. Nat. 151, 311–326.
Cote, J., Himmelman, J.H., Claereboudt, M., Bonardelli, J.C., 1993. Influence of density and depth on theˆ ´
Ž .
growth of juvenile sea scallops Placopecten magellanicus in suspended culture. Can. J. Fish. Aquat. Sci. 50, 1857–1869.
Emerson, C.W., Grant, J., Mallet, A., Carver, C., 1994. Growth and survival of sea scallops Placopecten
magellanicus: effects of culture depth. Mar. Ecol. Prog. Ser. 108, 119–132.
Felix-Pico, E.F., Tripp-Quezada, A., Castro-Ortiz, J.L., Serrano-Casillas, G., Gonzalez-Ramırez, P.G., Vil-´ ´ ´ lalejo-Fuerte, M., Palomares-Garcıa, R., Garcıa-Domınguez, F.A., Mazon-Suastegui, M., Bojorquez-´ ´ ´ ´ ´ ´ Verastica, G., Lopez-Garcıa, G., 1997. Repopulation and the culture of the Pacific Calico scallops in Bahıa´ ´ ´ ´ Concepcion, Baja California Sur, Mexico. Aquacult. Int. 5, 551–563.´ ´
Frechette, M., 1996. Preelevage du petoncle dans les sacs de collecte de naissain: presentation d’une approche´ ´´ ´ ´ permettant d’eviter la surpopulation. Compte rendu de la 4eReunion annuelle de transfert de technologie.
´ ´
Programme REPERE, Ministere de l’Agriculture, des Pecheries et de l’Alimentation, Gaspe, pp. 87–93.` ˆ ´ Frechette, M., Bourget, E., 1985a. Energy flow between the pelagic and benthic zones: factors controlling´ particulate organic matter available to an intertidal mussel bed. Can. J. Fish. Aquat. Sci. 42, 1158–1165. Frechette, M., Bourget, E., 1985b. Food-limited growth of Mytilus edulis in relation to the benthic boundary´
layer. Can. J. Fish. Aquat. Sci. 42, 1166–1170.
Frechette, M., Despland, E., 1999. Impaired shell gaping and food depletion as mechanisms of asymmetric´ ´
competition in mussels. Ecoscience 6, 1–11.
Frechette, M., Bergeron, P., Gagnon, P., 1996. On the use of self-thinning relationships in stocking´ experiments. Aquaculture 145, 91–112.
Gallager, S.M., Manuel, J.L., Manning, D.A., O’Dor, R.K., 1996. Ontogenetic changes in the vertical distribution of giant scallop larvae, Placopecten magellanicus, in 9-m deep mesocosms as a function of light, food, and temperature stratification. Mar. Biol. 124, 679–692.
( )
M. Frechette et al.´ rAquaculture 183 2000 105–124 123 ˆ
ŽGmelin , and the Iceland scallop, Chlamys islandica O.F. Muller in Iles-de-la-Madeleine, Canada. J.. Ž ¨ .
Shellfish Res. 13, 31–36.
Giguere, M., Cliche, G., Brulotte, S., 1995. Synthese des travaux realises entre 1986 et 1994 sur le captage du` ` ´ ´ naissain de petoncles aux Iles-de-la-Madeleine. Can. Tech. Rep. Fish. Aquat. Sci., 2061, xiiq71.´ Grant, J., 1996. The relationship of bioenergetics and the environment to the field growth of cultured bivalves.
J. Exp. Mar. Biol. Ecol. 200, 239–256.
Harvey, M., Bourget, E., Miron, G., 1993. Settlement of Iceland scallop spat Chlamys islandica in response to hydroids and filamentous red algae: field observations and laboratory experiments. Mar. Ecol. Prog. Ser. 99, 283–292.
Harvey, M., Bourget, E., Legault, C., Ingram, R.G., 1995a. Short-term variations in settlement and early spat
Ž .
mortality of the Iceland scallop, Chlamys islandica O.F. Muller . J. Exp. Mar. Biol. Ecol. 194, 167–187.¨
Ž .
Harvey, M., Miron, G., Bourget, E., 1995b. Resettlement of Iceland scallop Chlamys islandica spat on dead hydroids: response to chemical cues from the protein-chitinous perisarcs and associated microbial film. J. Shellfish Res. 14, 383–388.
Harvey, M., Bourget, E., Gagne, N., 1997. Spat settlement of the giant scallop, Placopecten magellanicus´
ŽGmelin, 1791 , and other bivalve species on artificial filamentous collectors coated with chitinous.
material. Aquaculture 148, 277–298.
Ž .
Hortle, M.E., Cropp, D.A., 1987. Settlement of the commercial scallop, Pecten fumatus Reeve 1855, on artificial collectors in eastern Tasmania. Aquaculture 66, 79–95.
Lodeiros, C.J.M., Himmelman, J.H., 1996. Influence of fouling on the growth and survival of the tropical
( ) Ž .
scallop, EuÕola Pecten ziczac L. 1758 in suspended culture. Aquacult. Res. 27, 749–756.
Manuel, J.L., Burbridge, S., Kenchington, E.L., Ball, M., O’Dor, R.K., 1996a. Veligers from two populations of scallop Placopecten magellanicus exhibit different vertical distributions in the same mecocosm. J. Shellfish Res. 15, 251–257.
Manuel, J.L., Gallager, S.M., Pearce, C.M., Manning, D.A., O’Dor, R.K., 1996b. Veligers from different populations of sea scallop Placopecten magellanicus have different vertical migration patterns. Mar. Ecol. Prog. Ser. 142, 147–163.
Miron, G., Ward, J.E., MacDonald, B.A., Bourget, E., 1996. Direct observations of particle kinematics within
Ž .
a scallop Placopecten magellanicus spat collector by means of video endoscopy. Aquaculture 147,
71–92.
Naidu, K.S., Scaplen, R., 1976. Settlement and survival of the giant scallop, Placopecten magellanicus, larvae on enclosed polyethylene film collectors. FAO Technical Conference on Aquaculture. FAO, Kyoto, Japan, pp. iq5.
Okamura, B., 1986. Group living and the effect of spatial position in aggregations of Mytilus edulis.
Ž .
Oecologia Berlin 69, 341–347.
Pearce, C.M., Bourget, E., 1996. Settlement of larvae of the giant scallop, Placopecten magellanicus
ŽGmelin , on various artificial and natural substrata under hatchery-type conditions. Aquaculture 141,.
201–221.
Pearce, C.M., Gallager, S.M., Manuel, J.L., Manning, D.A., O’Dor, R.K., Bourget, E., 1996. Settlement of larvae of the giant scallop, Placopecten magellanicus, in 9-m deep mesocosms as a function of temperature stratification, depth, food, and substratum. Mar. Biol. 124, 693–706.
Pearce, C.M., Gallager, S.M., Manuel, J.L., Manning, D.A., O’Dor, R.K., Bourget, E., 1998. Effect of thermoclines and turbulence on depth of larval settlement and spat recruitment of the giant scallop
Placopecten magellanicus in 9.5 m deep laboratory mesocosms. Mar. Ecol. Prog. Ser. 165, 195–215.
Peterson, C.H., 1982. The importance of predation and intra- and interspecific competition in the population biology of two infaunal suspension-feeding bivalves, Protothaca staminea and Chione undatella. Ecol. Monogr. 52, 437–475.
Phinney, D.A., Yentsch, C.S., 1985. A novel phytoplankton chlorophyll technique: toward automated analysis. J. Plankton Res. 7, 633–642.
Ž
Pouliot, F., Bourget, E., Frechette, M., 1995. Otimizing the design of giant scallops Placopecten magellani-´
.
cus spat collectors: field experiments. Mar. Biol. 123, 277–284.
Roughgarden, J., Gaines, S.D., Pacala, S.W., 1987. Supply side ecology: the role of physical transport
Ž .
Ž
Taylor, J.J., Rose, R.A., Southgate, P.C., 1997. Inducing detachment of silver-lip pearl oyster Pinctada
.
maxima, Jameson spat from collectors. Aquaculture 159, 11–17.
Thomas, S.C., Weiner, J., 1989. Including competitive asymmetry in measures of local interference in plant
Ž .
populations. Oecologia Berlin 80, 349–355.
Ž .
Thouzeau, G., 1991. Experimental collection of postlarvae of Pecten maximus L. and other benthic macrofaunal species in the Bay of Saint-Brieuc, France: I. Settlement patterns and biotic interactions among the species collected. J. Exp. Mar. Biol. Ecol. 148, 159–179.
Thouzeau, G., Lehay, D., 1988. Variabilite spatio-temporelle de la distribution, de la croissance et de la survie´
Ž .
des juveniles de Pecten maximus L. issus des pontes de 1985, en baie de Saint-Brieuc. Oceanologica´ Acta 11, 267–283.
Ž
Tremblay, M.J., Sinclair, M., 1988. The vertical and horizontal distribution of sea scallop Placopecten
.
magellanicus larvae in the Bay of Fundy in 1984 and 1985. J. Northwest Atl. Fish. Sci. 8, 43–53.
Tremblay, M.J., Sinclair, M., 1990. Sea scallop larvae Placopecten magellanicus on Georges Bank: vertical distribution in relation to water column stratification and food. Mar. Ecol. Prog. Ser. 61, 1–15.
Ž .
Tremblay, M.J., Sinclair, M., 1992. Planktonic sea scallop larvae Placopecten magellanicus in the Georges Bank region: broadscale distribution in relation to physical oceanography. Can. J. Fish. Aquat. Sci. 49, 1597–1615.
Vandevelde, T., Legendre, L., Therriault, J.-C., Demers, S., Bah, A., 1987. Subsurface chlorophyll maximum and hydrodynamics of the water column. J. Mar. Res. 45, 377–396.
Wallace, J.C., Reinsnes, T.G., 1985. The significance of various environmental parameters for the growth of
Ž .
the Iceland scallop, Chlamys islandica Pectinidae , in hanging culture. Aquaculture 44, 229–242. Weiner, J., 1990. Asymmetric competition in plant populations. TREE 5, 360–364.
Westoby, M., 1984. The self-thinning rule. Adv. Ecol. Res. 14, 167–225.
Yoda, K., Kira, T., Ogawa, H., Hozumi, K., 1963. Self-thinning in overcrowded pure stands under cultivated
Ž .