www.elsevier.com/locate/physa
Population dynamics coded in DNA: genetic
traces of the expansion of modern humans
Marek Kimmel
∗Department of Statistics, Rice University, P.O. Box 1892, Houston, TX 77251, USA
Received 7 August 1999
Abstract
It has been proposed that modern humans evolved from a small ancestral population, which ap-peared several hundred thousand years ago in Africa. Descendants of the founder group migrated to Europe and then to Asia, not mixing with the pre-existing local populations but replacing them. Two demographic elements are present in this “out of Africa” hypothesis: numerical growth of the modern humans and their migration into Eurasia. Did these processes leave an imprint in our DNA? To address this question, we use the classical Fisher–Wright–Moran model of popu-lation genetics, assuming variable popupopu-lation size and two models of mutation: the innite-sites model and the stepwise-mutation model. We use the coalescence theory, which amounts to trac-ing the common ancestors of contemporary genes. We obtain mathematical formulae expresstrac-ing the distribution of alleles given the time changes of population size . In the framework of the innite-sites model, simulations indicate that the pattern of past population size change leaves its signature on the pattern of DNA polymorphism. Application of the theory to the published mitochondrial DNA sequences indicates that the current mitochondrial DNA sequence variation is not inconsistent with the logistic growth of the modern human population. In the framework of the stepwise-mutation model, we demonstrate that population bottleneck followed by growth in size causes an imbalance between allele-size variance and heterozygosity. We analyze a set of data on tetranucleotide repeats which reveals the existence of this imbalance. The pattern of imbalance is consistent with the bottleneck being most ancient in Africans, most recent in Asians and intermediate in Europeans. These ndings are consistent with the “out of Africa” hypothesis, although by no means do they constitute its proof. c 1999 Elsevier Science B.V. All rights reserved.
PACS: 05.10.Gg; 87.23.-n
Keywords:Coalescence; Population expansion of modern humans; Mitochondrial DNA; Microsatellite DNA; Out of Africa; Multiregional theory
∗Corresponding author. Fax: +1-713-285-5476.
E-mail address: [email protected] (M. Kimmel)
1. Introduction
Origin and demography of human populations are of interest for disciplines rang-ing from paleontology and archeology, through anthropology, to medical sciences. The dynamics of growth of these populations can be studied using written records, hu-man burials and relics of material culture, and fossil record. As we go back in time, the evidence becomes scarce and dicult to interpret. For example, much is known about migrations and bottlenecks experienced by Ashkenazi Jews from the early Mid-dle Ages until modern times. In comparison, much less is known about the progression through Europe, in the general Northwest direction, starting around year 8000 bp (be-fore present), of the pre-Indoeuropean populations, which spread agriculture and were likely to be matrilinear in social structure. Even less is known about peopling of the Americas starting at about year 30 000 –15 000 bp and of Australia starting about year 40 000 bp, although these populations developed rich material cultures. Finally, the emergence and demographic history of modern humans at about year 200 000 bp is a puzzle with most pieces missing.
The two principal theories of the origin of modern humans are the multiregional theory and the replacement, or “out of Africa”, theory. The multiregional theory of Weidenreich [1] postulates a gradual evolution from ancient human populations of homo erectus, themselves spread over Africa and Eurasia during last 1 000 000 years, to modern types, simultaneously on all continents. Uniformity of the modern type, ac-cording to the multiregional theory, was maintained through a continuous gene ow between continental populations. The multiregional theory is based primarily on the fossil evidence. One argument used in support of the multiregional theory is the ap-parent continuity of the “Mongoloid” skull type in China, extending from the homo erectus populations until modernity (Ref. [2], p. 298). A counter-argument, also based on fossil and anthropological evidence, is the simultaneous presence, during the period from about 30 000 through 100 000 years bp, at various sites in Europe and the Middle East, of erectus (specically, Neanderthal) and early-modern populations, apparently not interacting with each other (for a discussion, c.f. [3]).
replacement theory [6]. A major tool in such studies is the analysis of phylogenetic structure using various genetic markers. Most of these studies consist of construction of phylogenetic trees of representative human populations or individuals representing these populations. These studies, among others, demonstrated that the pattern of variability mentioned above is present not only in mitochondrial DNA (inherited from females), but also in Y chromosome DNA (inherited by sons from fathers, absent in females), and in autosomal DNA (segregated to ospring independently of gender). In addition to these conrmations, and inferences specic to subgroups of world populations, at-tempts were made to interpret the relative lengths of branches of inferred phylogenetic tress in the terms of demographic histories of populations. This latter may contain a circular logic, as the underlying assumption of the usual tree-making algorithms (dis-tance matrix, parsimony, maximum likelihood) is the constancy of substitution rates. However, demographic changes aect the apparent substitution rates by altering the genetic-drift component of evolutionary change of DNA.
A fresh view of estimation of the past dynamics of human populations (and pop-ulations in general) is provided by mathematical models of genetic change involving variable population size. Using inversion of such models, it seems possible to infer the past population dynamics from the present genetic makeup of the populations [7,8].
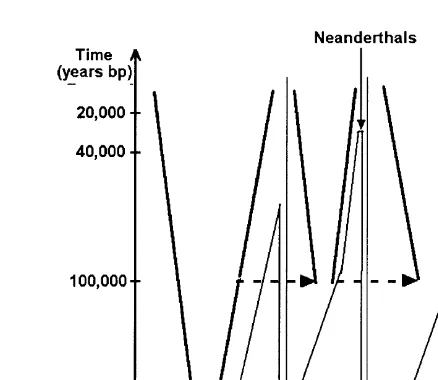
Let us suppose that the replacement theory is correct. What are the demographic eects we might detect in genetic data? Consider the demographic history of mod-ern humans, treated as one population, subdivided into major continental subpopu-lations (Fig. 1). A signature of past population growth will exist in each of the human subpopulations as well as in the total population. Also, the small founding group of each continental population will be derived from a larger ancestral popula-tion: modern Africans from archaic Africans, modern Europeans and=or Asians from modern Africans, etc. Accordingly, each new settling event will be preceded by an apparent bottleneck (reduction of genetic diversity). In addition, the bottleneck will be most remote in time for the Africans and progressively less remote for subpopulations established later. Summarizing, we expect:
(1) Memory of numerical expansions of the populations. (2) Memory of bottlenecks preceding the expansions.
(3) Dierent ages of expansions, depending on the order in which the continents were colonized by modern humans.
The aim of this paper is to present mathematical models of demography and genetics, for analysis of data, to detect the eects listed above.
2. Mathematical models
2.1. Data structures in population genetics
Fig. 1. Schematic of the demographic history of modern humans, according to the replacement (“Out of Africa”) theory. Inverted cones (thick line) represent population growth of modern humans, dashed lines represent migrations. Areas delimited with thinner lines represent the shrinking populations of archaic humans. Scales on both axes are arbitrary. The order of migrations into Europe and Asia is hypothetical.
N= 105. At a given locus (dened site of the chromosome), the existing allele (gene
variant) is recorded in each chromosome. For the purpose of evolutionary studies, very often, the so-called “neutral” loci are used. These are loci, which are not under selective pressure. In this way the largely unknown selective forces do not have to be considered in the analysis.
2.2. Genetic drift and mutations
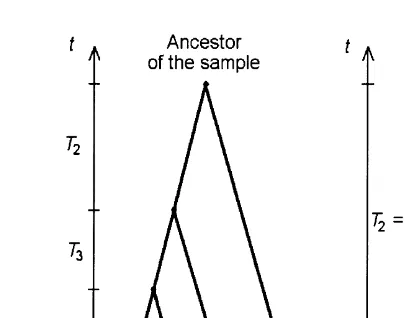
In absence of selection, the two forces acting on a locus are genetic driftand muta-tion. Genetic drift is the loss of chromosomes due to the fact that some chromosomes are not passed from one generation to another. Looking backward in time, this means that for each two chromosomes in the sample, there existed a common ancestor, some time T ago. So, following the n chromosomes in the sample existing at present, we observe lines of descent converging to intermediate ancestors and eventually to a com-mon ancestor of the sample (Fig. 2a). This phenomenon, occurring in backward time, is calledcoalescence and the corresponding mathematical process, thecoalescent [10,11]. The remaining part of this section follows [12]. For a sample of size n= 2,T ≡T2
(Fig. 2b) the time to coalescence is a random variable with hazard rate
1 2N(t0−t)
; t¿0; t0= present; t= backward time; (1)
where N(t) is the population size as a function of time. If the population is constant,
Fig. 2. Schematic depiction of the coalescence process;t, backward time. (a) Sample size n. (b) Sample size n= 2; a1; a2, allelic states of the locus in sampled chromosomes; aanc, allelic state of the ancestor; asterisks, mutation events.
it is intuitively clear that in a large population, the time to an ancestor is longer, i.e. the genetic drift is weaker.
Mutations are random changes of the allele status of the locus from one generation to the other. We can assume with enough generality that the allele status of a locus at a chromosome between coalescence events is a state of a time-continuous Markov chain [13] with a possibly innite transition matrix
P(t) = [Pij(t)]; (2)
Pij(t) = Pr[X(t) =j|X(0) =i]; (3)
and the generator (intensity) matrix Q. The following relations hold exactly for nite-dimensional chains and in some sense for the general chains:
Q“ = ” lim
t↓0(1=t)[P(t)−I]; P(t) “ = ” exp(Qt): (4)
Therefore, under drift and Markov mutation, the joint distribution of allelic status of two chromosomes from the sample:
Rjk(t) = Pr[chrom:1 =j; chrom: 2 =k]
= Z ∞
0
X
i Pij()
| {z }
Pr[i→j]
i(t−) | {z }
Pr[ancestor=i]
Pik()
| {z }
Pr[i→k]
(
exp[−Rt−t du=2N(u)] 2N(t−)
)
| {z }
coalescence intensity
d (5)
or, in matrix notation,
R(t) = Z ∞
0
PT()(t−)P()exp[− Rt
t− du=2N(u)]
where (t) =diag[(t)];(t) =(0)P(t). By dierentiating the latter side-by-side, we nd it is equivalent to the well-known Lyapunov dierential equation [14]:
˙
R(t) = [QTR(t) +R(t)Q]− 1
2N(t)R(t) + 1
2N(t)(t): (7) This last equation can be used to investigate qualitative properties ofR(t) under various specic models.
2.3. Mitochondrial DNA and the innite sites model
Many loci have the form of long sequences of DNA nucleotides, e.g.· · ·ACGTG· · ·, with any single residue mutating independently and very infrequently (10−5–10−9 per
generation) by base substitution, e.g. A→G. Since it is highly unlikely that a mutation “hit” occurs more than once at some residue, it can be eectively assumed that the locus has an innite number of sites and that mutations occurring at times dened by a Poisson process “select” a new site each time. This is the innite sites models (ISM; [9]). It is considered that sequences of the hypervariable (HV) region of the human mitochondrial genome conform to the ISM. Let us consider two chromosomes (n= 2) and an ISM locus. We compute the theoretical distribution of the number of mismatches between two sequences (loci). Assume mutation rate per generation per locus:
“Innitely” long DNA sequences
⇒Each mutation occurs at a new site in sequence ⇒X = #{mismatches between 2 sequences}
=#{mutations in both branches of coalescent} ∼ Poisson(2··T), conditional on T
⇒Probability generating function (pgf) of X; (s) =E(sX) [13]
(s) = Z ∞
0
e2(s−1)p() d ; (8)
where
p() =exp[− R
0 du=2N(u)]
2N() ; ¿0 (time backwards) (9) is the distribution density ofT.(s) is the probability generating function of the number of segregating sites. Introducing the mutational time t= 2, and coalescence intensity function in the mutational time scale, (t) = (1=2)p(t=2), we obtain
(s) = Z ∞
0
et(s−1)(t) dt : (10)
With z=−(s−1) the probability generating function(1−z) is the Laplace transform
(1) Given d(s) from data, estimate the coalescence intensity (t) or p() using inverse Laplace transform.
(2) Use inverse relation for coalescence intensity to calculate the history N(t) of the population size change,
2N() = R∞
p(u) du
p() : (11)
The nonparametric estimation algorithm based on discretization of time was published by Polanski and co-authors in Ref. [15]. The only regularizing assumption used is that N(t) is non-decreasing. Using simulations, it was demonstrated that the algorithm makes possible to reconstruct general characteristics of N(t).
2.4. Microsatellite DNA and the stepwise mutation model
Microsatellite repeat loci are stretches of repeated DNA motifs of length 2– 6 nucleotides [16]. An example is a triplet repeat (motif of length 3) with allele size
X = 4 (motif repeated 4 times)
· · · |ACG|ACG|ACG|ACG| · · · : (12)
Mutations in such loci usually have the form of expansions or contractions occurring at a high rate, ∼10−3−10−4 per generation. Mathematically,
X →X +U ; (13)
where U is an integer-valued random variable with pgf ’(s). This stepwise mutation model (SMM; [17,18]) mathematically is an unrestricted random walk. Microsatel-lites are highly abundant in the genome (GDB database lists ca 5000 dinucleotides). They are highly polymorphic (variable). Applications of microsatellites include foren-sics (identication), mapping (locating genes), and evolutionary studies.
A microsatellite locus can be considered to have a denumerable set of alleles indexed by integers. Two statistics can summarize the variability at a microsatellite locus in a sample of n chromosomes [19]: The estimator of the genetic variance
ˆ
V =2 =
n
X
i=1
(Xi−X)2=(n−1); (14)
where Xi=Xi(t) is the size of the allele in the ith chromosome present and X is the
mean of the Xi
V(t) =E( ˆV) =E[(Xi−Xj)2]; (15)
and Xi and Xj are the sizes of two alleles from the population [20]. The estimator of
homozygosity
ˆ
P0= n
n
X
k=1
p2k−1 !,
where pk denotes the relative frequency of allele k in the sample
P0(t) =E( ˆP0) = Pr[Xi(t) =Xj(t)]: (17)
Random variables Xi are exchangeable but not independent.
The coalescence theory for microsatellite loci, based on solutions of the Lyapunov dierential equation, provides theoretical expressions for V(t) andP0(t),
V(t) =V(0)e−
This latter expression suggests two intuitive estimators of the composite parameter : (1) the (allele-size) variance estimator of ; ˆV = ˆV, and
which leads to a denition of an imbalance index (t) [20] given by
(t) = V(t) [1=P0(t)2−1]=2
: (22)
Departures from value (t) = 1 expected at the mutation-drift equilibrium, represent imbalance, due, e.g. to population size changes, at a microsatellite locus. Modeling of the imbalance index (t) under dierent population growth patterns demonstrated that stepwise population growth [N(t) =N0; t= 0, andN(t) =N; t ¿0, forward time]
and exponential population growth [N(t) =N0exp(t); t¿0, forward time, where the
growth rate = [ln(N=N0)]=T has been selected so that N(T) =N] lead to transient
(t)¡1. Another set of simulations was carried out for the case of exponential growth preceded by a bottleneck event, i.e. the population initially of large size N00, dropping
instantly to a smaller size N0, and then regrowing exponentially to a nal sizeN, i.e.,
N(t) =
3. Analysis of data
3.1. Mitochondrial DNA
We used data on worldwide pairwise mismatches of mitochondrial sequences from [5] (see Introduction). Application of our nonparametric algorithm (see Mathematical models) provides an estimate of the population growth curve with a rapid expansion of population size at mutational time t=7 [15]. Assuming the mutation rate=0:0005 per locus per generation, this corresponds to =t== 140 000 years. Scaling of time diers by a factor of 2 from that in the Mathematical models section, since the mitochondrial genome is haploid. Similar computations were previously carried out by Rogers and Harpending in Ref. [7], assuming a parametric model of stepwise growth, in which the initial and nal values of = 2N are parameters denotedb andn, respectively,
and the time at which =b switches to =n is a parameter denoted ts. They tted
their model to the data from Ref. [5] obtaining n= 410:69; b= 2:44, and ts= 7:18.
Our estimation (for details, see [15]) is quite consistent with their result. Our estimate also suggests a gradual increase in population size starting from t= 7. In order to determine the sensitivity of our estimates, we conducted a resampling study in which 200 sequences were simulated under the innite site model with a stepwise growth of a population, corresponding to parameter values obtained by Rogers and Harpending in Ref. [7]. In 50 replications of simulations, all of the estimates of (t) were stepwise functions (with several exceptions in which the step was divided between two or three successive time points). The estimates of ts had a mean of 6.29 (as compared to the
assumed value of 7.2) with SD of 1.73.
3.2. Microsatellite DNA
The behavior of lnd obtained from the data is consistent with the growth scenario assuming a reduced diversity of the population at the time when population expansion begins, representing the consequences of a pre-expansion bottleneck.
The gradation of sample values of lnd is consistent with the bottleneck being most ancient in Africans, most recent in Asians, and of intermediate age in Europeans. Of course, from indices alone, the pattern of population growth (stepwise vs. logistic or exponential) or the time of initiation of the expansion cannot be predicted reliably.
4. Discussion
Nonparametric estimation of N(t), orp(t) from the mismatch distribution requires a reverse Laplace transformation known to be unstable. Nevertheless, simulation studies demonstrate that the nonparametric algorithm can predict general classes of population size changes. An application to mtDNA data sequences suggests that the human mtDNA sequence variation is not inconsistent with a stepwise or logistic growth of the modern human population, starting around 150 000 years bp [15].
Genetic memory of a population bottleneck can be detected using the imbalance index calculated using microsatellite data from several major human populations. Departures from the equilibrium value of dln are strongest in Asians, weakest in Africans and intermediate in Europeans. In these two latter populations, the departures are statistically signicant. These ndings are consistent with the bottleneck being most ancient in Africans, least ancient in Asians and intermediate in Europeans [20].
As stated in the Introduction, our results are consistent with a small subpopulation emerging from Africa and moving via Europe to Asia, some of its descendants settling en route and expanding, possibly replacing the pre-existing populations. Expansion preceded by bottleneck events which have occurred at dierent times for the three major human populations, is consistent with the replacement model [4] of the origin of modern humans, while it tends to argue against the multiregional model [1] which maintains that humans probably have not experienced a major bottleneck.
One other conclusion supported by simulations of the imbalance index is that, if modern humans indeed emerged several hundred thousand years ago from a small founding population, then their microsatellite loci are not at mutation-drift equilibrium. Therefore, modeling of microsatellite loci based on mutation-drift equilibrium, as car-ried out by a number of authors (for examples, see [16]), may lead to mistakes.
Acknowledgements
References
[1] F. Weidenreich, Six lectures on Sinanthropus pekinensisand related problems, Bull. Geol. Soc. China 19 (1939) 1–110.
[2] M. Wolpo, R. Caspari, Race and Human Evolution, Simon and Schuster, New York, 1996. [3] P. Mellars, The fate of the Neanderthals, Nature 395 (1998) 539–540.
[4] C.B. Stringer, Neanderthals, their contemporaries and modern human origin, in: G. Giacobini (Ed.), Hominidae, Jaca Book, Milan, 1989, pp. 351–355.
[5] R.L. Cann, M. Stoneking, A.C. Wilson, Mitochondrial DNA and human evolution, Nature 325 (1987) 31–36.
[6] D.B. Goldstein, P.H. Harvey, Evolutionary inference from genomic data, BioEssays 21 (1999) 148–156.
[7] A.R. Rogers, H.C. Harpending, Population growth makes waves in the distribution of pairwise genetic dierences, Mol. Biol. Evol. 9 (1992) 552–569.
[8] R.C. Griths, S. Tavare, Sampling theory for neutral alleles in a varying environment, Philos. Trans. R. Soc. Lond. B 344 (1994) 403– 410.
[9] W.J. Ewens, Mathematical Population Genetics, New York, Springer, 1979.
[10] S. Tavare, Line-of-descent and genealogical processes, and their applications in population genetics models, Theoret. Popul. Biol. 26 (1984) 119–164.
[11] S. Tavare, Calibrating the clock: Using stochastic processes to measure the rate of evolution, in: E.S. Lander, M.S. Waterman (Eds.), Calculating the Secrets of Life, Washington, National Academy Press, 1995, pp. 114 –152.
[12] A. Bobrowski, M. Kimmel, R. Chakraborty, O. Arino, A semigroup representation and asymptotic behavior of the Fisher–Wright–Moran coalescent, in: C.R. Rao, D.N. Shanbhag (Eds.), Stochastic Processes: Theory and Applications (Handbook of Statistics Series), Elsevier, Amsterdam, in press, 1999.
[13] W. Feller, Introduction to Probability and Its Applications, Vol. II, Wiley, New York, 1966. [14] Z. Gajic, M.T.J. Qureshi, Lyapunov Matrix Equation in System Stability and Control, Academic Press,
New York, 1995.
[15] A. Polanski, M. Kimmel, R. Chakraborty, Application of a time-dependent coalescence process for inferring the history of population size changes from DNA sequence data, Proc. Natl. Acad. Sci. USA 95 (1998) 5456–5461.
[16] D.B. Goldstein, C. Schlotterer (Eds.), Microsatellites: Evolution and Applications, Oxford University Press, Oxford, 1999.
[17] T. Ohta, M. Kimura, A model of mutation appropriate to estimate the number of electrophoretically detectable alleles in a nite population, Genet. Res. 22 (1973) 201–204.
[18] P.A.P. Moran, Wandering distributions and the electrophoretic prole, Theoret. Popul. Biol. 8 (1975) 318–330.
[19] R. Chakraborty, M. Kimmel, Statistics of microsatellite loci: estimation of mutation rate and pattern of population expansion, in: D.B. Goldstein, C. Schlotterer (Eds.), Microsatellites: Evolution and Applications, Oxford University Press, Oxford, 1999, pp. 139 –150.
[20] M. Kimmel, R. Chakraborty, J.P. King, M. Bamshad, W.S. Watkins, L.B. Jorde, Signatures of population expansion in microsatellite repeat data, Genetics 148 (1998) 1921–1930.
[21] L.B. Jorde, M.J. Bamshad, W.S. Watkins, R. Zenger, A.E. Fraley et al., Origins and anities of modern humans: a comparison of mitochondrial and nuclear genetic data, Amer. J. Hum. Genet. 57 (1995) 523–538.