Robust Fine-Tuned PID Controller using Taguchi
Method for Regulating DC Motor Speed
Gunawan Dewantoro
Faculty of Electronics and Computer Engineering Satya Wacana Christian University
Salatiga, Indonesia
Abstract—The finest design of the proportional-integral derivative (PID) controller plays an important role in achieving a satisfactory response of any rotational electro-mechanical system. This paper presents an optimal design of the PID controller in the DC motor by using the Taguchi method. The proportional gain, the integral gain, the derivative gain constitute the search space for the optimization problem. The objective of PID optimization is to minimize the integral squared error of the step response. The predicted optimum values of the control variables are determined by the Taguchi method using analysis of means. Analysis of variance (ANOVA) is used to select the most significant control parameters. Computer simulation shows that the performance of fine-tuned PID controller using Taguchi method is better than that of traditional open loop Ziegler-Nichols technique.
Keywords—PID controller; fine-tuning; Taguchi method; optimization
I. INTRODUCTION
The rotational speed of DC motor can be accustomed to a great extent to provide robustness against disturbances and high performance [1]-[3]. The controllers of the rotational speed for achieving such goals include both conventional and advanced controller types, i.e. PID controller [4], adaptive control [5], Fuzzy Logic Controller (FLC) [6], Genetic Algorithm (GA) technique, Particle Swarm Optimization (PSO) technique or the combination between them: Adaptive PID, Fuzzy-PID, Fuzzy-Neural Networks, Fuzzy-Genetic Algorithm, Fuzzy-Swarm. The traditional proportional-integral-derivative (PID) controller is the most well known and widely-used among them. The PID controllers have been employed in many control applications due to the robustness of these controllers and they provide a large stability margin [7]. Therefore, the PID controller is still an appropriate choice for the DC motor system. The tuning of the PID controller parameters has been cumbersome, particularly in system processes that of higher order, and exhibit nonlinearities as well as delay time. Therefore, many methods have been used for fine tuning the PID controller parameters.
The PID controller parameters are traditionally determined by using the Ziegler–Nichols method based on time response and experiences [7]-[8]. In general, it is complicated to achieve the best performance of the system by using this
obtaining the best performance. Besides, it lacks selection of parameters and still has an excessive overshoot in time response. However, there are rooms for improvement to fine-tune the PID parameters. Modified Ziegler-Nichols tuning based on Chien-Hrones-Reswick (CRR) PID tuning formula [9] for set-point regulation accommodate the response speed and overshoot. In addition, many artificial intelligence (AI) based techniques, such as neural network, fuzzy logic, and neuro-fuzzy system, have been proposed to fine tune the PID controller parameters [10]–[11]. However, the artificial neural networks suffer from the convergence time and somewhat lengthy training and testing process. Also, the fuzzy logic systems mostly depend on the experience of the designer in tuning the membership functions and the inference rules. Furthermore, evaluation and tuning of robust PID controllers have been proposed by using a lambda tuning approach [12]. It is only specific for second-order non-minimum phase systems. Also, the interval polynomial stability criterion and the Lyapunov theorem have been proposed for designing the PID controller [13]. This method exhibits more and complex analysis.
and reproducibility of the experiment was verified by confirming a confidence interval (CI) of 95% using MATLAB toolboxes. This paper is organized as follows: Section 1 explains the background of the research. The DC motor mathematical model is given in Section 2, and The Taguchi method is discussed in Section 3. The designs and results of the Design of Experiments are discussed in Sections 4. Finally, Section 5 concludes the paper.
II. DCMOTOR MATHEMATICAL MODEL
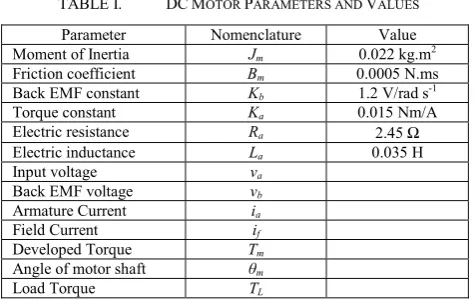
This paper focuses on the study of DC motor rotational speed control, therefore, the separately excited DC motor is adopted [20]. The armature voltage controls the DC motor velocity while the field current is fixed. The purpose of modeling DC servo motor is to approach the actual DC motor. The control equivalent circuit of the DC motor by the armature voltage control method is shown in Figure 1. Parameters and values chosen for motor simulation can be shown at Table 1 [21]
Fig. 1. Equivalent Schematic of the DC Motor.
TABLE I. DCMOTOR PARAMETERS AND VALUES
Parameter Nomenclature Value
Moment of Inertia Jm 0.022 kg.m2
Friction coefficient Bm 0.0005 N.ms
Back EMF constant Kb 1.2 V/rad s-1
Torque constant Ka 0.015 Nm/A
Electric resistance Ra 2.45 Ω
Electric inductance La 0.035 H
Input voltage va
Back EMF voltage vb
Armature Current ia
Field Current if
Developed Torque Tm
Angle of motor shaft θm
Load Torque TL
Since the back EMF, vb, is proportional to rotational speed ω
directly, we have
)
Applying Kirchoff Voltage Law on the electrical circuit will yield:
Meanwhile, the dynamic equation which is derived from Newton’s law is:
a
By applying Laplace transforms to (1), (2), and (3), the equations can be reformulated as:
) described in Fig. 2:
Fig. 2. Block Diagram of the DC Motor in s-domain.
III. THE TAGUCHI METHOD
The Taguchi method is an effective tool in optimization problem. It is constructed based on the principle of an orthogonal array to reduce the number of design experiments required in any design process. For instance, if there are four factors each at three levels, the full factorial design method needs 34 = 81 experiments while the Taguchi method needs only nine experiments (L9) to obtain the predicted optimal values. In the Taguchi method, an orthogonal array that depends on the number of factors and their levels is used to study the parameters’ variation effect [22].
A. Orthogonal Array
In establishing an orthogonal array, three factors A, B, and C are considered. A is the proportional gain, B is the integral gain, and C is the derivative gain. To determine the factor levels, an initial guess must be established from the traditional Ziegler-Nichols method using Matlab's SISO design tool as shown in Figure 3. It can be inferred that the Ziegler-Nichols method gives the values of Kp, Ki, and Kd are 1.5865, 1.0018,
and 0.62811, respectively. Then, the three levels of three control factors were identified for study as presented in Table II. These factor levels define the experimental region, which is also studied and presented in Table II.
Fig. 3. PID Tuning using Ziegler-Nichols method.
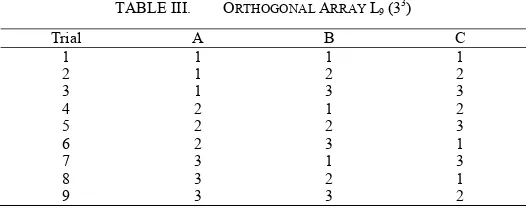
The orthogonal array chosen for this experiment is L9 (33), meaning that there are 9 experiments with three 3-level factors. In this array, the columns are mutually orthogonal. That is, for any pair of columns, all combinations of factor levels occur and they occur in an equal number of times. The next step is the development of a procedure, simulating the variation in the quality characteristic ISE. The ISE response was computed for each combination of control factors using the MATLAB program, which simulates the control factors equations. The selected orthogonal array (L9) is shown in Table III.
B. Signal-to-Noise Ratio
When performing experiment design using the Taguchi method, to understand the experiment’s performance, a design factor function is usually provided, and it made the standard for our measurement of performance, which is called performance measurement. Taguchi experiment design uses quality loss as a base to design a statistical measurement for
study, the performance index of PID optimization is the integral-squared-error (ISE) since ISE is correlated with all time responses, such as: rise time, settling time, steady-state error, and maximum overshoot. ISE is mathematically defined as [23]:
process model, respectively. Therefore our goal is to make the ISE as small as possible. The quality characteristics are chosen to be the smaller-the-better, and the SN ratio is:
MSD
SN =−10log (8)
and the mean squared deviation is:
∑
where yi is the value of the quality measurement and n is
the total number of measurements.
C. Main Effect Analysis
By designing the experiment plan in accordance with the L9 orthogonal array, the data produced by various processing parameter combinations in the orthogonal array can be obtained, and then the response table is established. First, the data obtained from the experiment are calculated into SN ratios, the calculation technique depends on the required quality characteristics. After calculating the ISE response values for each factor level Fi then the main effect values are
calculated for each factor level ΔF.
∑
Next, these data are sorted into a response table, and the effect of each factor is analyzed. If the main effect value of a factor
IV. RESULTS AND DISCUSSION
A. PID optimization
Nine experiments, as shown in Table III, should be carried out in order to know the dynamic response of the DC motor with the PID controller at combination levels of these factors. To obtain the values of ISE, the MATLAB-Simulink model of the DC motor system with the PID controller is used using motor parameters listed in Table I, as shown in Figure 4. Table IV shows the simulation results on each experiment.
1 Out1
2.45 Ra
Load Disturbance 0.015
KT
1.2 KB
1 s Integrator1 1
s Integrator
0.0005 B 1/0.035
1/La
1/0.022 1/J 1
In1
ia w
Fig. 4. DC Motor schematic in MATLAB-Simulink
TABLE IV. SIMULATION RESULTS ON EACH EXPERIMENT
Trial A B C ISE S/N Ratio
1 1 0.8 0.2 1.287 -2.19157
2 1 1 0.6 1.285 -2.17806
3 1 1.2 1 1.313 -2.36529
4 1.5 0.8 0.6 1.128 -1.04618
5 1.5 1 1 1.126 -1.03076
6 1.5 1.2 0.2 0.9341 0.59213
7 2 0.8 1 1.017 -0.14641
8 2 1 0.2 0.8334 1.58293
9 2 1.2 0.6 0.9137 0.78392
S/N ratios were computed in each of the trial combination and the values are displayed in the last column of Table IV. Since the experimental design is orthogonal, it is possible to separate out the effect of each factor. Therefore the average S/N Ratio of each level (1, 2, 3) of three control factors (KP, KI
and KD) can be obtained using (10). Response table and
response graph are shown in Table V and Figure 5.
TABLE V. THE RESPONSE TABLE
A B C
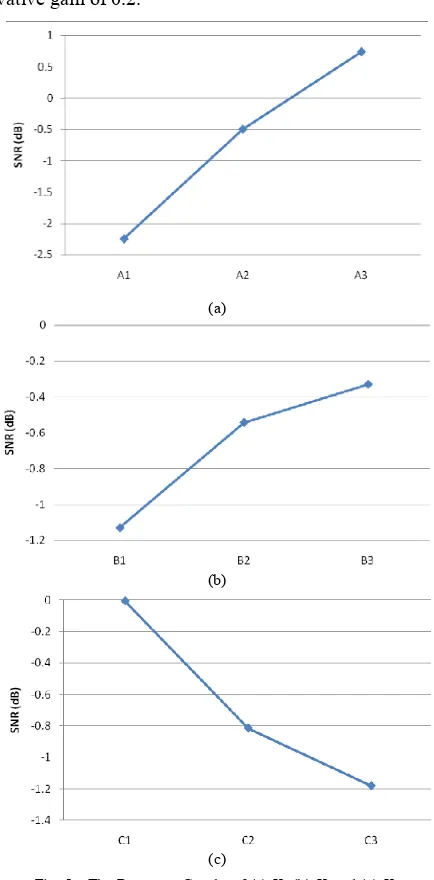
Level 1 -2.24498 -1.12806 -0.0055 Level 2 -0.49494 -0.54197 -0.81344 Level 3 0.740146 -0.32974 -1.18083 Difference 2.985122 0.798313 1.175324 Rank 1 3 2
Comparing the Figure 5(a)-(c) it is shown that the line in Figure 5(a) has the largest slope. Thus, from the Taguchi method it is testified that factor KP, is more important than
other factors. From the response table and response graph, the optimum control parameter combination for DC Motor speed regulation was determined, which is A3, B3, C1, in other words,
the proportional gain of 2, the integral gain of 1.2, and the derivative gain of 0.2.
(a)
(b)
(c)
Fig. 5. The Response Graphs of (a) KP (b) KI and (c) KD
B. Analysis of Variance (ANOVA)
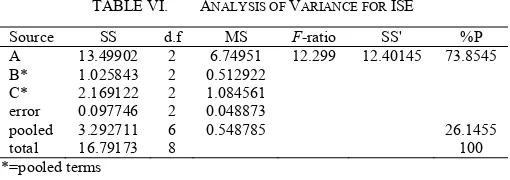
In order to identify the control factors that have significant effects, analysis of variance (ANOVA) for S/N ratio is performed at a certain confidence level. The result of ANOVA for ISE is shown in Table VI. From ANOVA of V-cut depth as shown in Table 3a, control factors A possess F-ratio greater than that obtained from table of F value with 95% confidence level. Therefore, KP is a significant factor whose effects are
TABLE VI. ANALYSIS OF VARIANCE FOR ISE
Source SS d.f MS F-ratio SS' %P
A 13.49902 2 6.74951 12.299 12.40145 73.8545
B* 1.025843 2 0.512922
C* 2.169122 2 1.084561
error 0.097746 2 0.048873
pooled 3.292711 6 0.548785 26.1455
total 16.79173 8 100
*=pooled terms
, where SS = Sum of Square d.f = degree of freedom MS = Mean Square F-Ratio = MS/MSE SS’ = Pure Sum of Square %P = Percentage of Contribution
C. Confirmation Simulations
After the optimum PID control parameters were obtained through Taguchi method, the confirmation simulations were conducted. First, the theoretical predicted values could be figured out through the significant factors in the ANOVA table using the following formula:
(
)
∑
=
−
+
=
ni
i
T
F
T
SN
1 ^
(12)
where T is the average of all the SN ratios and Fi is the SN
ratio of significant factor level values.
In order to effectively evaluate the various observed values, their Confidence Interval (CI) must be calculated. Its calculation is as shown below:
eff v
n
MSE
F
CI
1
2 , 1
,
×
×
=
α (13)where Fα,1,v2 is the F-ratio of significance level α; α is the significance level, the confidence level is 1- α; v2 is the DF of
the mean square of the pooled error; MSE is the mean square of the pooled error; neff is the effective observed value.
According to (12), the predicted value for the ISE is 0.740146 dB; whereas according to (13), the expected average value of 95% CI of the ISE is 1.77674 dB. It means that the range of acceptable confirmation is -1.0366 dB to 2.516894 dB.
Then, the ISE under optimum PID parameter (KP=2,
KI=1.2, KD=0.2) is calculated. The simulation shows that the
calculated ISE is 0.7922 or 2.023303 dB. The diagram for the CI of the ISE verification experiment values and theoretical predicted values are shown in Figure 6. From the diagrams, the CI from the verification experiment and the theoretical predictions did indeed coincide; therefore the results from our experiment are indeed reliable had been proven.
Fig. 6. Diagram for the 95% CI of the ISE verification value (in circle) and theoretical predicted value (in triangle)
D. Time Response Performance
Figure 7(a) and (b) demonstrates the disturbed step responses of the DC motor speed with PID parameter obtained from the traditional Ziegler-Nichols method and Taguchi fine-tuning method, respectively. The load disturbance is 0.005 Nm at t=15 s.
(a)
(b)
Fig. 7. Unit step responses with disturbance using (a) Ziegler-Nichols and (b) Taguchi method
From the above figures, it is clearly shown that the PID fine-tuning using Taguchi method improves the time response characteristic, i.e. rise time, maximum overshoot, and settling time, and also increases the system robustness against disturbance which stems from the load.
-2 -1 0
V. CONCLUSION
A Taguchi method was successfully employed for fine-tuning the PID control parameters in DC motor speed regulation. The proportional gain, the integral gain, and the derivative gain were chosen to define the search space for the optimization problem, while the objective is to minimize the integral squared error (ISE). From the response table and response graph, the optimum PID parameter combination was concluded as: the proportional gain of 2, the integral gain of 1.2, and the derivative gain of 0.2. From the ANOVA analysis, the factor that more significantly affected the ISE is the proportional gain. After carrying out verifying simulations, the 95% CI diagrams for the verification values coincides with that of the theoretical predicted value of the ISE. It means that the results of this method possess reproducibility. Furthermore, this method also demonstrated the superiority over the traditional Ziegler-Nichols PID tuning method for its robustness against load disturbances
References
[1] Y. Ma, Y.Liu, and C.W. Elissa, “Design of parameters self-tuning fuzzy PID control for DC motor,” in Proc. of Second International conference on Industrial Mechatronics and Automation, vol.2, pp.345-348, 2010. [2] K.A. Naik and P. Shrikant, “Stability enhancement of DC motor using
IMC PID controller,” International Journals of Advanced Engineering Sciences and Technologies, vol. 4, no. 1, pp. 92-96, 2011.
[3] W.P. Aung, “Analysis on modeling and Simulink of DC motor and its driving system used for wheeled mobile robot,” World Academy of Science, Engineering and Technology, vol. 26, pp. 299-306, 2007. [4] P.M. Meshram and R.G. Kanojiya, “Tuning of PID controller using
Ziegler-Nichols method for speed control of DC motor,” in Proc. of IEEE International Conference On Advances In Engineering, Science And Management, pp. 117-122, March 2012.
[5] J. Yao, Z. Jiao, and D. Ma, “Adaptive robust control of DC motors With extended state observer,” IEEE T. Ind. Electron., vol. 61, no. 7, pp. 3630-3637, 2014.
[6] G. Dewantoro and Y.L. Kuo, “Robust speed-controlled permanent magnet synchronous motor drive using Fuzzy Logic Controller,” in Proc. of IEEE International Conference on Fuzzy Systems, pp. 884-888, 2011.
[7] Y. Li, K. H. Ang, and G.C.Y. Chong, “PID control system analysis and design, problems, remedies, and future directions,” IEEE Contr. Syst. Mag., vol. 26, no. 1, pp. 32–41, 2006.
[8] K. Astrom and T. Hagglund, PID Controller: Theory, Design and Tuning, 2nd ed., Library of Congress Cataloging-in-Publication Data, 1994, pp.120-134.
[9] D. Xue, Y. Chen and D.P. Atherton, Linear Feedback Control, Society of Industrial and Applied Mathematics, 2007, ch. 6.
[10] A. Rubaai, M.J. Castro-Sitiriche, and A. R. Ofoli, “Design and implementation of parallel fuzzy PID controller for high-performance brushless motor drives: An integrated environment for rapid control prototyping,” IEEE Trans. Ind. Appl., vol. 44, no. 4, pp. 1090–1098, 2008.
[11] A. Rubaai and P. Young, “EKF-based PI-/PD-like fuzzy-neural-network controller for brushless drives,” IEEE Trans. Ind. Appl., vol. 47, no. 6, pp. 2391–2401, 2011.
[12] B. Lennartson and B. Kristiansson, “Evaluation and tuning of robust PID controllers,” IET Control Theory Appl., vol. 3, no. 3, pp. 294–302, 2009. [13] X. H. Li, H. B. Yu, M. Z. Yuan, and J. Wang, “Design of robust optimal proportional-integral-derivative controller based on new interval polynomial stability criterion and Lyapunov theorem in the multiple parameters’ perturbations circumstance,” IET Control Theory Appl., vol. 4, no. 11, pp. 2427–2440, 2010.
[14] C.-C. Hwang, L.-Y. Lyu, C.-T. Liu, and P.-L. Li, “Optimal design of an SPM motor using genetic algorithms and Taguchi method,” IEEE T. Magn., vol. 44, no. 11, pp. 4325–4328, 2008.
[15] M. Ashabani, Y. Abdel-Rady, I. Mohamed, and J. Milimonfared, “Optimum design of tubular permanent-magnet motors for thrust characteristics improvement by combined Taguchi-neural network approach,” IEEE T. Magn., vol. 46, no. 12, pp. 4092–4100, 2010. [16] Y.-H. Liu and Y.-F. Luo, “Search for an optimal rapid-charging pattern
for Li-ion batteries using the Taguchi approach,” IEEE T. Ind. Electron., vol. 57, no. 12, pp. 3963–3971, Dec. 2010.
[17] C.F.J. Kuo, H.Q. Vu, D. Gunawan, and W.L. Lan, “Multi-objective optimization of laser-scribed microgrooves on AZO conductive thin film using Data Envelopment Analysis,” Opt. Laser Technol., vol. 44, pp. 1959-1970, 2012.
[18] C.F.J. Kuo, G. Dewantoro, and C.C. Huang, “Optimization of injection-molded light guide plate with microstructures by using reciprocal comparisons,” J. Intell. Manuf., DOI 10.1007/s10845-013-0826-y, 2013. [19] J.G. Vlachogiannis, “Robust PID controllers by Taguchi’s method,” The
TQM Magazine, vol. 17, no. 5, pp. 456-466, 2005.
[20] G. Haung and S. Lee," PC based PID speed control of DC motor," in Proc. of International Conference on Audio, Language and Image Processing, pp. 400-407, 2008.
[21] N. Thomas and P. Poongodi, “Position control of DC motor using genetic algorithm based PID controller,” in Proc. of The World Congress on Engineering, vol. 11, 2009.
[22] R.K. Roy, Design of Experiments Using the Taguchi Approach. New York: Wiley-Interscience, 2001.