The Experts’
Tradiion
that Flows in the Vein
ENHANCING THE RESILIENCE OF
THE REAL SECTOR IN SUPPORTING
ECONOMIC RECOVERY
CHAPTER
Enhancing the Resilience
of the Real Sector in Supporing
Economic Recovery
Amid deep global economic contracion, the real sector has remained mostly resilient to the global economic pressure which enabled it to support the performance of the Indonesian economy in 2009.99
The impact of the global economic crisis on the country’s real sector was mainly through trade channel as relected in export performance which has dropped quite considerably. Such a drop in exports has prompted businesses to reduce their aciviies, which in turn led to a decline in investment and consumpion. In spite of being exposed to the impact of global economic crisis, the Indonesian economy has managed to grow by 4.5% (year-on-year) which was beter than previously esimated in the beginning of the year of 4.0% (year-on-year) due to domesic demand which remained strong, in paricular when it came to household consumpion. The coninuingly high household consumpion was atributable to several factors which include, in paricular, public purchasing power which remained quite strong, electoral expenditures whose amount was quite substanial and iscal simulus policy to maintain public purchasing power. Moreover, the domesic economic growth which remained high was also supported by Micro, Small, and Medium-sized Enterprises (MSME) which play quite a strong role in the Indonesian economy. Unil recently, given that the export and import role of the MSME sector has
99 Deiniion: the real sector refers to all which relates to the
remained limited, the impact of global economic crisis on that sector has been relaively small.
Meanwhile, the coninuingly high household consumpion was also propped by low inlaion. Such a low inlaion level helped maintain public purchasing power and led to the maintenance of consumers’ conidence and expectaion. Moreover, the maintenance of public purchasing power was also supported by a number of government policy packages such as reducing personal income tax and increasing non-taxable income limits.
However, the success in keeping up the resilience of domesic economy sill leave some problems as relected in the declining trend of the growth of the manufacturing sector and the constraints to which some infrastructure projects are subjected. Such challenges become increasingly important given that the ASEAN-China Free Trade Agreement (ACFTA) prompts businesses in the manufacturing sector to enhance their compeiiveness. Therefore, future industrial sector development should presuppose the availability of adequate infrastructure and take into consideraion regional aspects, that is, by taking into
account the sectors at which a region excels when building an industry in the region.
5.1
The Resilience of Household Consumpion
Amidst the global crisis, household consumpion emerged as the main pillar supporing the growth of the Indonesian economy. The coninuing, relaively high growth of household consumpion – which made up the largest segment of GDP, around 58% – was able to prevent economic growth from sliding further. In 2009, household consumpion was able to experience a suiciently high growth of 4.85%, only slightly lower compared to previous year (5.34%). In the irst semester of 2009 when the impact of the crisis on the Indonesian economy was very much felt, household consumpion sill managed to grow posiively, posing a suiciently high growth. Even in quarter I 2009, household consumpion was sill able to grow by 5.95%. This high growth of consumpion in the irst half of 2009 was paricularly related to the big spending associated with electoral aciviies made by poliical paries or legislaive candidates during legislaive campaigns and presidenial elecion. This general
elecion-related household consumpion expenditure was recorded by BPS as the expenditure of a non-proit private insituion. BPS data showed that during the irst quarter of 2009, it was recorded that the non-proit insituion spent Rp 26.58 trillion.
the country’s economic condiion to take a turn for the worse. As a result, household consumpion dropped signiicantly (Chart 5.1). In 2009, a suiciently low rate of inlaion successfully maintained public purchasing power as well as managed people’s expectaion, especially the consumers’ level of conidence and expectaion, and gradually transformed the pessimisic tone of Consumer Conidence and Expectaion Index in quarter I 2009 into an opimisic one for the rest of the year (Chart 5.2). As a result, household consumpion in 2009 was not as severely afected as in previous year (Chart 5.1).
Fundamentally, the strong household consumpion was propped up by public purchasing power which was sill high. In general, such a purchasing power which remained strong was atributable to some main factors. The irst factor was a general increase in people’s income. In 2009, the country’s per capita income calculated based on the GDP per capita at current market prices showed an increase from Rp 21.7 million per year in 2008 to Rp 24.3 million per year which represents an increase of around 12%. This was supported by data on increasing income in the formal and informal sectors. As far as the formal sector is concerned, a survey conducted by BTI Consultants indicated that the average salary rise in 2009 stood at 8.39% with the largest salary rise recorded in three sectors, namely the insurance sector (9%-13%), the oil and gas sector (8%-12%) and the sector associated with fast moving consumer goods (3%-11%).100 In the informal sector, such an income was relected in the increase of the real wage of agricultural labors from Rp 29,063 per day in 2008 to Rp 30,473 per day in 2009. Such
100 SWA Magazine. May 2009 ediion
increased earnings in both the formal and informal sectors very much helped leverage public purchasing power, paricularly amidst the low rate of inlaion. The second factor was the indicated use of savings by the private sector to prop up the exising level of consumpion. This was related to the consumer’s inter-temporal decision to maintain the sustainability of purchasing power by assigning part of future consumpion potenial to the current consumpion. Such inter-temporal decision was in turn able to keep domesic consumpion stable for a long period of ime. These high public savings potenial used to maintain consumpion level corresponded to the country’s high economic growth over the last four years which stood at around 6%.
Furthermore, to protect low-income earners’ purchasing power, the Government coninued to channel direct cash transfers (BLT). As for simulus package, the Government also issued several policies for reducing personal income tax, increasing the limit of non-taxable income (PTKP) as well as providing a variety of subsidies such as cooking oil subsidy. Then, in quarter II 2009, the Government paid the 13th salary to civil servants. Such programs were very helpful, in paricular for people in the low to middle income bracket. In addiion, Bank Indonesia’s monetary policy of reducing interest rates had also helped public purchasing power.
Consumer opimism of future income had propelled consumpion as well. A survey on consumers conducted by Bank Indonesia indicated that people’s expectaion of future income remained high despite global economic crisis (Chart 5.2). In quarter I 2009, such opimism jacked up the Consumer Conidence Index to the opimisic
Chart 5.1 Inlaion and Household Consumpion Growth Chart 5.2 Consumer Survey - Bank Indonesia
Source: BPS-Staisics Indonesia
percent, yoy
Household Consumpion (rhs) CPI
percent, yoy index
Consumer Confidence Index Consumer Expectaion Current Economic Condiion
optimistic
Countries Urbanizaion (millions) percentage of total populaion
Average of Annual Growth (%)
2000 2007 2000 2007 1990-2007
Indonesia 54.5 113.6 31 50 4.3
Brazil 111.8 163.1 75 85 2.2
China 311.0 556.3 27 42 3.4
India 216.6 329.1 26 29 2.5
level. Consumer opimism in future condiion was also relected in Danareksa’s survey in May, the Consumer Expectaion Index had started to pick up (Chart 5.3). The level of household consumpion which calculates the level of expected income in the future is an indicaion of household behavior which tends to follow the Life Cycle Hypothesis (LCH) and Permanent Income Hypothesis (PIH) theories. The LCH and PIH theories basically state that the consumpion decision of an individual is not only based on their current income but also on the calculaion of their expected income. Based on this premise, an increase or a decline in an individual’s income is considered temporary and will only give a limited efect to the individual’s consumpion. Conceptually, the LCH and PIH theories are the reverse of Keynes’ theory which assumes that the consumpion of an individual at a given ime will be very much related to their income at that paricular ime.
The strong posiion of the country’s household sector balance sheets made access to the inancing of
consumpion easy. According to a BIS survey (2009)101, the level of household debts in Indonesia was relaively low, that was, sill hovering around 7%, compared to other countries such as Korea (82%) and the U.S. and Britain where it went beyond 100%. Such a low raio made it easy for the country’s household sector to access inancing for consumpion. Based on December 2009 data, consumpion credit went up to 17.3% (year-on-year) which was far above the investment and working capital credit. Another source of inancing which also showed an increase was loans from pawnbrokers. As of September 2009, the growth of loans put up by pawnbrokers had increased by around 47.5%. Such an increase may relect the tendency of households to make use of their non-monetary savings such as gold and vehicles to maintain their level of consumpion.
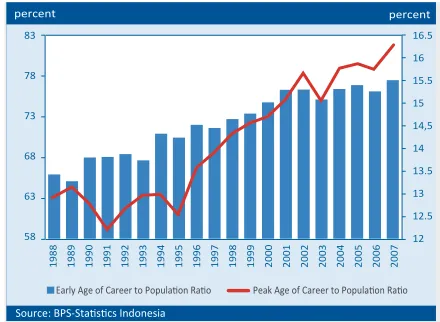
In the long run, the level of public consumpion will be afected by the demoCharic structure in society. The
101 Gounan Ma, Eli Remolona, and Ilhyock Shim (2009), ’Household
Debt : Implicaion for Monetary Policy and Financial Stability,’ Bank for Internaional Setlement, paper no. 46.
Chart 5.4 Raio of Early and Peak Age of Career to
Populaion
Chart 5.3 Consumer Survey – Danareksa
Source: BPS-Staisics Indonesia
percent percent
Peak Age of Career to Populaion Raio Early Age of Career to Populaion Raio
Source: Danareksa index
Consumer Expectaion Current Economic Condiion Consumer Conidence Index
Table 5.1 The Development of Urbanizaion in Indonesia and Emerging Markets
increase in the raio of populaion at the later career stages to the populaion at the early career stage indicated increased household income with higher capacity for consumpion and saving (Chart 5.4). In addiion, demoCharic change in the form of increased urbanizaion has also led to higher consumpion. Data from 2000 to 2007 showed that the average rate at which populaion moved from rural to urban areas stood at 4.3% per year, far higher compared to other countries like Brazil, China, and India which on average grew by 2.2%, 3.4%, and 2.5% per year respecively (Table 5.1).
The growth of urbanizaion was one of the sources of consumpion growth given that the average spending of populaion in urban areas was far higher than that in rural areas. In 2008, based on BPS data, the average spending of urban populaion, which amounted to Rp 496,000 per month, was higher by around 75% than the one of rural populaion.102
5.2
The Role of MSME as a Shock-absorber
of the Global Economic Crisis
The resilience of domesic economy in the face of global economic crisis cannot be detached from the important role of MSME mainly because the role of export and import aciviies in this sector is relaively limited. In addiion, many MSME rely on domesic sources for raw materials as well as domesic market as their main target. The persistence of MSME entrepreneurs in managing their business through eiciency measures as well as abundant and economical supply of labor helps minimize the adverse impact of the crisis on the MSME sector. In addiion, MSME workers who are generally low educated are responsible for the lexibility of movement of workers among MSME sectors, paricularly within the informal sector because this sector does not require highly speciied experise. This sub-chapter analyzes the role of MSME in the structure of the Indonesian economy.
g
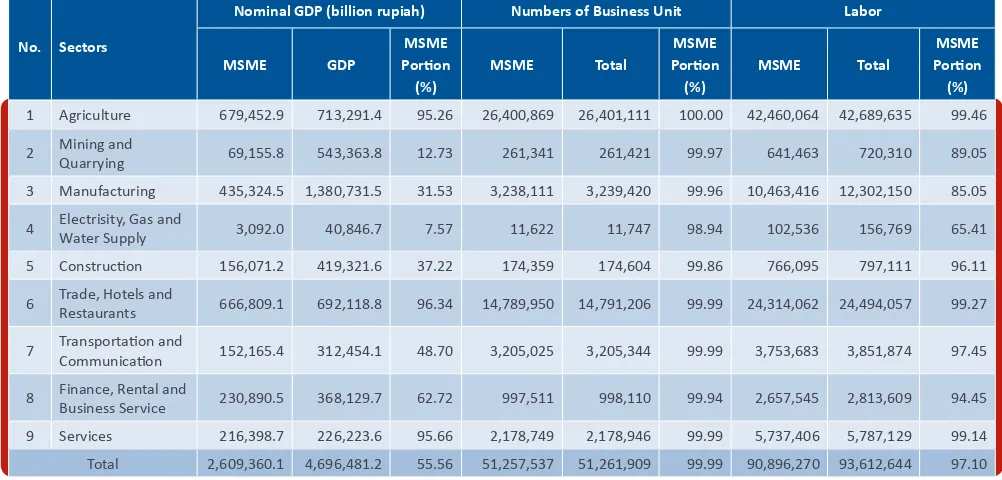
The Role of MSME in Economy
for 99.99% of total business units with the contribuion of the 3 largest sectors made up 85% of the total. The three largest sectors – the agricultural sector, the trade sector, and the services sector – managed 26.40 million, 14.79 million, and 2.18 million business units respecively (Table 5.2).103
In addiion, MSME played a signiicant role in absorbing labor. The amount of labor absorbed by MSME accounted for 90.9 million people or 97.10% of the total naional labor force, most of whom were concentrated in MSME of micro category, or 81.74% of total MSME labor force. In terms of their variety by sector, MSME labor force spread out over the enire sectors and most of them provided a signiicant contribuion to the absorpion of labor force in
103 Based on Law No.20 of the year 2008 on MSME: (1) a micro enterprise is deined as having a net asset of a maximum of IDR 50 million (not including land and building used for the business) or having an annual sales turnover of a maximum of IDR 300 million. (2) a small enterprise is deined as having a net asset of more than IDR 50 million up to IDR 500 million at the most (not including land and building used for the business) or having an annual sales turnover of more than IDR 300 million up to IDR 2.5 billion at the most. (3) a medium enterprise is deined as having a net asset worth more than IDR 500 million up to IDR 10 billion at the most (not including land and building used for the business), or having an annual sales turnover of more than IDR 2.5 billion up to IDR 50 miliar at the most.
the sector. In terms of labor absorpion, MSME absorbed the largest labor force in the agricultural sector and the trade sector, accounted for 42.46 million and 24.31 million workers respecively or around 73% of the total labor force absorbed in the MSME sector.
As far as the banking industry is concerned, the amount of loans it extended to MSME was also quite high.
Throughout 2009, the amount of loans extended to MSME accounted for 51.28% of the total loans by the banking industry. From such a proporion of MSME loans, it was obvious that the banking industry saw MSME as business unit worth inancing and commercially viable. During the same period, loans extended to small enterprises accounted for the largest share (37%) followed by loans extended to micro enterprises (32%) and to medium enterprises (31%) of total loans disbursed by the banking industry to MSME.
g
The Advantage of MSME in Facing
Economic Crisis
In general, the survey conducted by Bank Indonesia indicated that most respondents were aware of and felt
Table 5.2 The Role of MSME’s in The Domesic Economy in 2008
Source: Ministry of Cooperaive and Small and Medium Enterprises No. Sectors
Nominal GDP (billion rupiah) Numbers of Business Unit Labor
MSME GDP 4 Electrisity, Gas and
Water Supply 3,092.0 40,846.7 7.57 11,622 11,747 98.94 102,536 156,769 65.41
5 Construcion 156,071.2 419,321.6 37.22 174,359 174,604 99.86 766,095 797,111 96.11
6 Trade, Hotels and
Restaurants 666,809.1 692,118.8 96.34 14,789,950 14,791,206 99.99 24,314,062 24,494,057 99.27
7 Transportaion and Communicaion 152,165.4 312,454.1 48.70 3,205,025 3,205,344 99.99 3,753,683 3,851,874 97.45
8 Finance, Rental and Business Service 230,890.5 368,129.7 62.72 997,511 998,110 99.94 2,657,545 2,813,609 94.45
9 Services 216,398.7 226,223.6 95.66 2,178,749 2,178,946 99.99 5,737,406 5,787,129 99.14
the efects of global economic crisis on their businesses.104
The results of the survey indicated that while around 92% of respondents were aware of global economic crisis, the rest weren’t (Chart 5.5). Moreover, the global economic crisis inluenced MSME business aciviies as relected in the answers of 74.8% respondents who felt the efects of the crisis. Only 25.2% of the respondents did not feel the impact of the crisis on their businesses (Chart 5.6).
Despite being exposed to the crisis, the MSME sector can manage itself in a relaively good shape so that the impact of the crisis on its performance was relaively limited. As in the previous economic downturns – in 1997 and in 2005 – the existence of the MSME sector was one of the main factors which saved the Indonesian economy. And the main factors responsible for the high resilience of this sector included, among others, the markeing orientaion of MSME products to the domesic market and the relaively small proporion of their products which were intended for export. Moreover, MSM entrepreneurs had a strong moivaion to keep their business and producion aciviies relying on local materials. Another advantage of this sector lied in its characterisically abundant, economical and low-educated labor force with high mobility to move to another sector.
MSME products, which were mostly intended for the domesic market, added value to measures aimed at addressing the drop in export performance as a result of the crisis. Over the last 10 years (1999-2008), MSME exports were relaively small; on average it accounted
104 A quick survey was conducted by Bank Indonesia in mid- 2009 involving 1000 [MSME] respondents as target samples taken proporionally from almost the enire parts of Indonesia based on their respecive net GDP contribuions. The survey deines MSME on the basis of sales turnover as referred to under the Law No.20 of 2008 on MSME.
for 15.40 % of total exports (Chart 5.7). Therefore, when exports took a plunge like in 2009, MSME were relaively able to survive given that their products were mostly intended to meet domesic demand and only a few were export-oriented. There were two main MSME sectors which provided the largest contribuion to the GDP, namely the agricultural sector and the trade sector. On average, the contribuion of each sector over the last 10 years (1999-2008) was 94.76% and 96.43% respecively (Table 5.3). In 2009, each of the two sectors grew by 4.1% and 1.1% correspondingly. Moreover, in the same year, other MSME sectors with quite a large contribuion to the GDP – of more than 50% – such as the construcion, transportaion, and communicaion sectors; the inancial and business service sector, and the services sector grew quite high, that was, by 7.1%, 15.5%, 5.0%, and 6.4% respecively. This proved that MSME were able to withstand the crisis.
Labor is key to MSME’s resilience. In general, MSME’s labor force is characterized by low wages and low level of educaion (unskilled labor). Based on a Bank Indonesia
Chart 5.5 Survey of the Economic Crisis Chart 5.6 Impact of the Economic Crisis Survey
Aware of Economic Crisis
Chart 5.7 MSME Export Share
Source: State Ministry of Cooperaion and Small & Medium Enterprises percent
Chart 5.8 MSME Entrepreneurs Response (Quick Survey Result)
respondent
survey, the low wages of MSME labor force match their low skills and consequently, low producivity. This explains why MSME labor force is relaively economical and reducing workforce is considered as the last opion by MSM entrepreneurs. Such low labor costs made MSM entrepreneurs, when being hit by any inancial crisis, restrain themselves from terminaing their workforce massively and prefer to keep most of them for another momentum of demand recovery. For those experiencing the terminaion of employment, the characterisically economical and low-educated nature of the MSME labor force led them to shit in between or among MSME. As a result, once a MSME goes sluggish or goes out of business, it is relaively easy for their employee to swing or move. It has been shown under the Todaro migraion model that labor shiting in informal businesses, the majority of which are MSME, is relaively very easy given that employment opportuniies in the informal sector is quite largely available and does not require highly-skilled workers.105 Such an indicaion of labor shiting out of the
formal sector into the informal sector was conirmed by the Naional Staisics Agency (BPS) whose labor force data indicated that the number of informal sector workers had increased from 71.35 million in August 2008 to 72.61 million in February 2009 and lastly, 72.72 million as of August 2009.
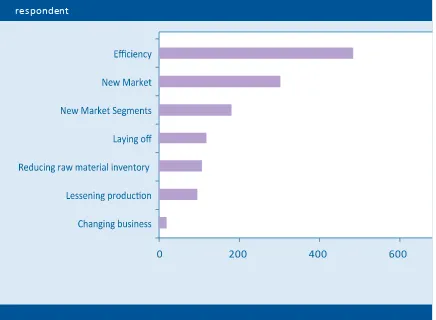
MSME’s persistent efort in keeping their businesses running has also helped bolster its performance. A quick survey conducted by Bank Indonesia indicated
105 Todaro. Michael P.. and Smith. Stephen C..”Economic Development”. Tenth Ediion. Addison Wesley. 2009
that the fallout of global economic crisis was relected in the average decline of monthly sales turnover. Such a decline, however, was not directly and fully followed by a reducion in producion and workforce. Presumably, one of the factors responsible for such a limited response was related to the efort made by MSME to conduct eiciency irst prior to terminaing the employment of their
workforce or reducing their capacity of producion (Chart. 5.8). This was relected in the results of the survey which showed that the majority of respondents employed an eiciency strategy to alleviate the adverse impact of the crisis. Apparently, reducion of workforce and producion was not a priority opion for them.
In addiion to self-help measures taken by MSM entrepreneurs, the Government has also taken various measures to develop MSME. Through the Ministry of Cooperaives, the Government has made some policies
Table 5.3 Average of MSME’s Contribuion to GDP (1999-2008)
No Sectors
Average of MSME's Contribuion to GDP
1999-2008
1 Agriculture 94.76
2 Mining and Quarrying 12.77
3 Manufacturing 32.02
4 Electricity, Gas and Water Supply 8.98
5 Construcion 54.93
6 Trade, Hotels and Restaurants 96.43
7 Transportaion and Communicaion 54.66
8 Finance, Rental and Business Service 63.21
9 Services 59.17
aimed not only at helping MSME address the crisis but also helping them coninue growing and developing. Government policies for empowering MSME through the extension of informaion or training are coninued to be made by the Ministry of Cooperaives. Measures to develop markets for MSME products are also coninued to be taken by the Government. Exhibiions of MSME products in diferent regions are coninued to be made by the Government in order to introduce MSME products and to open up and expand new markets. Moreover, the Government’s plan to help develop MSME is stated in its 100-day program and plan for 5 years to come which includes, among others, the extension of educaion and training programs for MSM entrepreneurs, the extension of the One Village One Product (OVOP) concept, the acceleraion of the development or revitalizaion of 90 tradiional markets. In addiion, the Government has also planned the addiion of the budget of the Naional Program for the Empowerment of Self-Help Communiies (PNPM Mandiri).
One of the measures the Government took to improve MSME’s access to the banking industry was the issuance of a People’s Business Loan (KUR). Under this scheme, MSME may obtain inancing with relaively easy requirements supported by the Government’s underwriing faciliies. Under such a scheme, MSME and Cooperaives which are not yet bankable in spite of the viability of their business because of collateral deiciency get the opportunity to obtain loans from banks because 70% of the loans are guaranteed by the Credit Guarantee Insituion which is owned by the Government. In implemening the KUR scheme, Bank Indonesia acted as a working partner for the Government which in this case
issued regulaions to support the implementaion for the underwriing, the monitoring of the implementaion of KUR program and coordinaing with banks and related government agencies. By the end of 2009, the KUR ceiling reached to Rp 17.18 trillion with a debit balance of Rp 8.15 trillion and with a total of 8,153,345 debtors. Meanwhile, the risk associated with the extension of the loan was quite low as relected in the level of NPL of 4.92%. In terms of sector, the extension of KUR was mostly aimed at the trade sector, the hotel and restaurant sector (PHR) and the agricultural sector.
The role of Bank Indonesia through the implementaion of monetary policies also afects the development of MSME. Monetary policies through the reducion of BI rate and measures to control the stability of exchange rate provide opportunity for MSM entrepreneurs to enhance their access to credit and shape MSM entrepreneurs’ opimism. Moreover, the role of Bank Indonesia to increase MSME’s access to banks’ loans was also carried out through appeals to the banking industry to help MSME development by providing loans or by providing MSM entrepreneurs with training such as training on how to draw a loan proposal. Such training is very important to make it easy for MSME to access loans from banks (or to make them bankable).
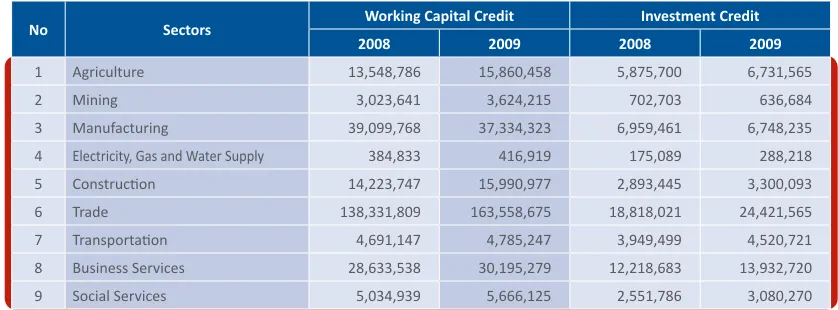
In general, there was sill an increase in loans extended to MSME by banks throughout 2009. The amount of working capital loans for MSME in all sectors – except the manufacturing sector – sill indicated a rise compared to that by the end of 2008. The same thing was also indicated by the development of investment loans. In general, the loans taken out by MSME for investment
Table 5.4 Development of MSME’s Working Capital and Investment Credit
millions of rupiah
No Sectors
Working Capital Credit Investment Credit
2008 2009 2008 2009
1 Agriculture 13,548,786 15,860,458 5,875,700 6,731,565
2 Mining 3,023,641 3,624,215 702,703 636,684
3 Manufacturing 39,099,768 37,334,323 6,959,461 6,748,235
4 Electricity, Gas and Water Supply 384,833 416,919 175,089 288,218 5 Construcion 14,223,747 15,990,977 2,893,445 3,300,093
6 Trade 138,331,809 163,558,675 18,818,021 24,421,565
in almost all sectors were on the rise (Table 5.4). This shows two things. Firstly, from banks’ side, the trust of the banking industry in MSME was sill high presumably because of the relaively good performance at which MSME pay of both their working capital loans and
5.3
The Role of the Manufacturing Industry
as the Engine of Economic Growth
g
Portrait of the Manufacturing Industry
The role of non oil and gas manufacturing sector is crucial for the Indonesian economy.106 In terms of its contribuion to economic growth, this sector sill provides the largest contribuion to the formaion of GDP. In terms of its contribuion to export, this sector posts a bigger share compared to the export of the agricultural and mining sectors. In terms of its contribuion to the labor force, this sector on average absorbs around 12% of the total labor force. Industrial sectors have great backward and forward linkages so that any enhancement in the performance of the manufacturing industry may afect other industrial sectors.107
Amidst its important role in the domesic economy, the performance of the non oil/ gas manufacturing sector coninues to be on a declining trend over the last 5 years. In terms of its contribuion to the GDP, since 2005 the performance of this industrial sector had coninued its decline even though the decline was limited, from 28.07% in 2005 to around 26% in 2009. In terms of its growth,
106 The deiniion and concept associated with the manufacturing
industry used here refer to the deiniion of BPS on the non-oil-and-gas manufacturing industry which is deined as an economic acivity of transforming a [raw] material mechanically, chemically and manually into a inished goods/ semi-inished goods, and or transforming goods of lower value into goods of higher value and whose characters are closer to the end user.
107 Forward linkage is an economic acivity whose output can be used
over the last ive years the manufacturing industry posted an average growth of 5% per year, far lower than in the period before the crisis in 1997 during which it was able to grow by an average of 10% per year. The decline made the growth of this paricular sector lower than the naional economic growth although previously, the growth of this sector had always been higher than that of the naional growth.
Throughout 2009, the non oil/gas manufacturing sector only grew by 2.5% (year-on-year), which was lower than last year’s growth. The decline of external demand as a result of global economic crisis signiicantly afected the manufacturing sector especially its export-oriented sub-sectors. Sub-sectors with signiicant export desinaion including, among others, imber/wooden, texile, and chemical products show a relaively low growth; even the imber/wooden product sub-sector sufered from a contracion in 2009. Meanwhile, domesic-oriented
sub-sectors such as the food, beverages, and tobacco industry posted a high growth in 2009, that was 11.3%. Presumably, the high growth of this sub-sector was atributable to the sill high growth of public purchasing power and also the increase in demand associated with legislaive elecion and presidenial elecion (Table 5.5).
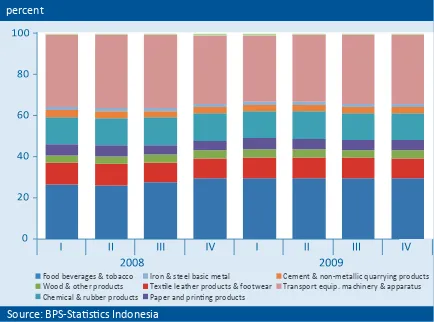
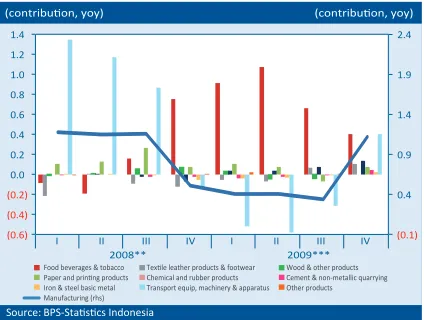
In terms of its sub-sectors in general, there were some industries sufering from contracion including the imber/ wood and forest yield sub-sector, the cement and non metal quarry material sub-sector, the basic metal, iron and steel sub-sector, and the sub-sector pertaining to transport equipment, machine and its equipment. Meanwhile, other sub-sectors sill show posiive performance (Table 5.5). In terms of its structure, the transport equipment, machine and its equipment sub-sector, the food, drink and tobacco sub-sub-sector, and the chemical and rubber product sub-sector sill make up the largest segment of the manufacturing sector (Chart 5.9). Meanwhile, the food, drink, and tobacco sub-sector and the paper and printed mater sub-sector were the main contributors to the growth of the manufacturing sector (Chart 5.10).
g
Some Characterisics of the
Manufacturing Sector
The drop in the performance of the non oil/gas manufacturing sector is related to some main
characterisics of the industrial sector. Firstly, the use of imported inputs in the aciviies of the manufacturing sector was quite high and thus made the sector vulnerable to the ups and downs of the exchange rate.
Table 5.5 Performance of Non-Oil and Gas Manufacture in 2009
Source: BPS-Staisics Indonesia
Chart 5.9 Distribuion of Manufacturing Sector
Source: BPS-Staisics Indonesia percent
Food beverages & tobacco Wood & other products Chemical & rubber products
Iron & steel basic metal Texile leather products & footwear Paper and prining products
Cement & non-metallic quarrying products Transport equip. machinery & apparatus
Manufacture Subsectors Growth 2009 (%.
yoy)
Share of Non-Oil & Gas Manufacture
1 Food. Beverages and Tobacco 11.3 29.8
2 Texile, Leather products and footwear 0.5 9.8
3 Wood products and other planing materials -1.5 3.8
4 Paper and prining products 6.3 5.2
5 Chemicals and rubber products 1.5 13.3
6 Cement and non-metalic mineral products -0.6 3.0
7 Basic metals -4.5 1.5
8 Transportaion equip. machinery and apparatus -2.9 32.9
Secondly, the export orientaion of the industrial sector to developed countries was sill high. Around 44% of exports of the manufacturing sector were sill desined for three main countries, namely the United Naions, Europe and Japan. As a result, this industrial sector becomes highly vulnerable to any economic upheavals taking place in the main export desinaion countries. Thirdly, the compeiiveness of most of the country’s industrial products was low as indicated in the low score
of Revealed Comparaive Advantage (RCA).108 Indicaion
of Indonesia’s weak industrial compeiiveness is also relected in the results of survey conducted by the World Economic Forum in the book it published itled Global Compeiiveness Report 2009-2010 which showed that Indonesia ranks 54th out of 130 countries surveyed in terms of compeiiveness. This did not difer from the previous period. Indonesia’s compeiiveness was sill far below that of other compeitor countries within ASEAN such as Singapore (which ranks 3rd), Malaysia (which ranks 21st), and Thailand (which ranks 36th) (Table 5.7). Such a low level of compeiiveness was related to the peculiarity of the country’s manufacturing industry which was characterized by the tendency to center around a number of companies and the prevalence of machines
108 RCA can be formulated as follows: RCA=(Xik/Xi/Wk/Wt). If the RCA value of a country for a certain commodity is greater than one (1), the country in quesion has a comparaive advantage over the global average for the commodity. The reverse is also true if the value is less than one (1). Analysis was made using data originaing from UNCOMTRADE based on the 2 digit SITC which is composed of 69 groups of commodiies. Note:
Xik = value of export commodity k from country i Xi = value of total exports from country i Wk = value of export commodity k in the world Wt = value of the world’s total exports
Chart 5.10 Growth Contribuion of Manufacturing subsectors
Source: BPS-Staisics Indonesia
Food beverages & tobacco Texile leather products & footwear Wood & other products Paper and prining products Chemical and rubber products Cement & non-metallic quarrying Iron & steel basic metal Transport equip, machinery & apparatus Other products Manufacturing (rhs)
Table 5.6 The Main Characterisics of Non-Oil and Gas Industries
Main Characterisics of Non-Oil&Gas
Manufacture Current Condiions Implicaions
1. Based on IO 2005 table, reliance on imported raw materials were sill high
- especially on transport equip., basic metal, iron, steel, chemical, paper, and texile
Sensiive to Exchange Rate
2. Export shares to developed countries were quite high.
- The market share to developed countries (USA,
Europe, Japan) were around 44.1% Industrial export performance was sensiive to economic changes in developed countries
- The market share to Emerging Markets (Singapore, China, India) were around 22.8%
3. Compeiiveness of industrial products were relaively low. Only texile and texile products had strong compeiiveness
- the RCA value of texile & texile products 1.88, chemical 0.47, machinery &
apparatus 0.37, electronic products 0.37% (source: UNComtrade, processed)
Taking opportunity of global economic recovery to boost the export growth were limited
4. Based on mapping survey of the economic sector, there were many industries using the old machines
- Machines need to be replace (> 15 years old) was
18% Increasing the acceleraion of producion growth was hard to do
- The old machines (13 years old) was 35% 5. Based on BI Producion Survey, the average
industrial capacity uilizaion in 2009 was 72.9%
- The high capacity uilizaion was in cement & non-metallic quarrying, chemical and paper
Increasing the acceleraion of producion growth was hard to do
6. Market structure of industrial sector is concentrated only in a few companies
- By using concentraion raio 4 (CR4) approach, the market share of 4 companies have controlled more than 75% of total market share.
Less compeiive
older than 10 years of age. Fourthly, most of the machines in the industry had a high uilizaion capacity and thus less responsive to increased demand. Based on Bank Indonesia producion survey, the uilizaion capacity of this industrial sector was relaively high, or beyond 70%. Some paricular sub-sectors had even a uilizaion capacity beyond 90%, namely the chemical sub-sector, the cement sub-sector, and the basic metal sub-sector (Table 5.6).
g
Readiness of the Industrial Sector in
Addressing ASEAN-China Free Trade
Agreement (ACFTA)
In addiion to the above-menioned characterisics of the industry, the challenge of the industrial sector gets bigger as a result of the applicaion of ACFTA. This ASEAN-China free trade agreement was iniiated by a framework of agreement of Comprehensive Economic Cooperaion in 2002 in Pnom Penh. ASEAN member countries and China agreed to establish free trade between China and six ASEAN member countries (Indonesia, Brunei, Thailand, Malaysia, Singapore and the Philippines) in 2010 and between China and four other ASEAN member countries (Cambodia, Vietnam, Laos and Myanmar) in 2015.
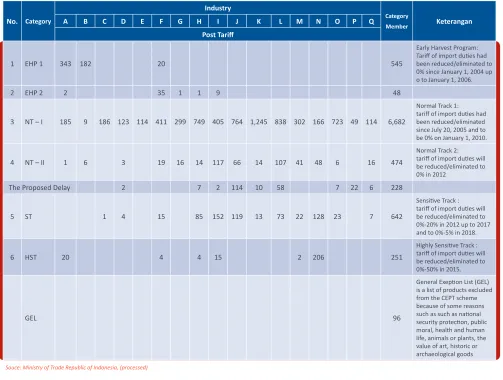
In the implemening stage of the free trade agreement, it is agreed that import duies are to be eliminated gradually. The reducion or the eliminaion of ACFTA import duies is divided into four schemes, namely Early Harvest Program (EHP), Normal Track (NT), Sensiive Track (ST) and Highly Sensiive Track (HST). Under the EHP scheme, it was agreed to reduce import duies gradually staring from January 1, 2004 down to 0% on January 1, 2006. The reducion in import duies under the NT scheme
came into force as of July 20, 2005 and the NT scheme had been further divided into NT I and NT II. The reducion in import duies under the NT-I scheme to 0% took place on January 1, 2010 while the reducion of import duies under the NT-II scheme to 0% would take place in 2012. Import duies under the ST scheme would go down to 20% in 2012 and sink down further to 0-5% in 2018. Import duies under the last scheme, that is, the HST scheme, would be 50% at maximum in 2015. Currently there are 8,738 commodiies under ACFTA, most of which (6,682) belong to the NT1 scheme (Table 5.8). Up to 2009, the number of commodiies whose import duies dropped to zero percent would amount to 5,709 or account for 65.3% of total commodiies. In 2010, the number of commodiies with zero percent import duies increased by 1,597 to 7,306 or accounted for 83.61% of the total ACFTA import duty posts.
The applicaion of ACFTA provides opportunity for Indonesia to increase its natural resources-based exports. The mapping of export opportuniies is based on the RCA indicator and based on the performance of the growth of non oil and gas exports over the last 5 years.109
Combinaion between the RCA indicator and the export performance divides commodiies into four quadrants. Based on the mapping results, most of the commodiies with the potenial to make use of China and ASEAN’s markets are natural resources-based commodiies. Some natural resources-based industrial commodiies such as Crude Palm Oil (CPO), rubber, and paper were the main
109 According to an analysis made on the basis of the 2 digit SITC (Standard Internaional Trade Classiicaion) which is composed of 69 groups of goods. The limit of growth based on the country’s average non oil and gas exports in the 2004-2008 period was 17.2%.
Table 5.7 Indonesia Compeiiveness Rank
Global Compeiiveness Index
Countries 2006-2007 2007-2008 2008-2009 2009-2010
Indonesia 50 54 55 54
Malaysia 26 21 21 21
Vietnam 77 68 69 69
Thailand 35 28 34 36
China 54 34 30 29
Philippines 71 71 70 87
Singapore 5 7 5 3
contributors to Quadrant I, or a quadrant with RCA greater than one and with growth above the average of other commodiies. Even though the number of commodiies under Quadrant I was relaively smaller compared to those under other quadrants, they accounted for the largest in terms of export value, or by 47.4% (Chart 5.11 and 5.12). Because of the relaively strong support of natural resources-based commodiies under Quadrant I, it was necessary to observe early on the development of groups of commodiies under potenial quadrants, or Quadrants II and IV. That’s because the commodiies under such quadrants were industry-based so that the
Note: A = Agriculture B = Marine and Fisheries C = Energy and Mineral D = Drug and Food Control E = Forestry
F = Food and Beverages
G = Forest and Plantaion H = Upstream Chemical I = Downstream Chemical J = Metal
K = Machine
L = Texile and Texile Products
M = Miscellaneous Industry N = Transport Equipment O = Electronics P = Mariime Q = Handicrat
diversiicaion of export became beter.
The distribuion of Indonesia’s export commodiies under Quadrants II and IV had a potenial for further development. In terms of their performance over the last ive years, commodiies under Quadrant II had shown promising performance by posing a growth above the average. Some main commodiies under Quadrant II include, among others, iron and steel, vehicles, machinery, and transport equipment. Meanwhile, commodiies grouped under Quadrant IV have a comparaive advantage but their growth is sill limited; they included, among
Table 5.8 Classifying Commodiies by Price Reducion and Sectoral Scheme
Souce: Ministry of Trade Republic of Indonesia, (processed) No. Category Tarif of import duies had been reduced/eliminated to 0% since January 1, 2004 up o to January 1, 2006.
2 EHP 2 2 35 1 1 9 48
3 NT – I 185 9 186 123 114 411 299 749 405 764 1,245 838 302 166 723 49 114 6,682
Normal Track 1: tarif of import duies had been reduced/eliminated since July 20, 2005 and to be 0% on January 1, 2010.
4 NT – II 1 6 3 19 16 14 117 66 14 107 41 48 6 16 474
Normal Track 2: tarif of import duies will be reduced/eliminated to 0% in 2012
The Proposed Delay 2 7 2 114 10 58 7 22 6 228
5 ST 1 4 15 85 152 119 13 73 22 128 23 7 642
Sensiive Track : tarif of import duies will be reduced/eliminated to 0%-20% in 2012 up to 2017 and to 0%-5% in 2018.
6 HST 20 4 4 15 2 206 251
Highly Sensiive Track : tarif of import duies will be reduced/eliminated to 0%-50% in 2015.
GEL 96
General Exepion List (GEL) is a list of products excluded from the CEPT scheme because of some reasons such as such as naional security protecion, public moral, health and human life, animals or plants, the value of art, historic or
others, texile and texile products (TPT), imber/ wooden products, paper and pulp, and house furniture.
The applicaion of ACFTA has the potenial to reduce the of inlaion. On the one hand, the prevalence of Chinese products since China’s accession to the WTO poses an increasingly serious threat to commodity compeiion on the global market. On the other hand, the Chinese products with relaively cheap prices in various countries has contributed to the reducion of the pressure of inlaion. The same can be said of Indonesia. Thanks to the gradual reducion of import tarifs since 2004 for some products under the EHP and NT schemes, more choices of goods are available with more afordable prices. Business who so far rely on relaively expensive machines from advanced countries have also conirmed the posiive impact of ACFTA which provides them with diferent alternaives of industrial machines from China.
In addiion to opportunity, the applicaion of ACFTA poses a threat to the development of domesic industries. In terms of export commodiies in general, serious challenges would have to be faced by industries which are not based on natural resources. Thanks to economies of scale and huge human resources, China relaively gets the upper hand in terms of industrial products compared to other countries. Industrial commodiies especially the ones produced domesically on a labor-intensive basis tend to face greater challenge in compeing with similar products from China. More speciically, potenial threats loom over export commodiies under Quadrant III which consists of mostly electricity and electronic equipment, organic chemical materials, and oice machines. In terms of performance of import of industrial goods from China,
the value of imports from almost all sub-sectors in the industry show an increase from 2006 to 2008. Meanwhile, in 2009 China’s industrial sectors were declining, afected by global economic crisis (Chart 5.13 and Chart 5.14). Among the nine sub-sectors in the manufacturing industry, there are four industrial sub-sectors with a highly signiicant increase in import, namely the transport equipment sub-sector, the machinery and its equipment sub-sector, the basic and steel metal sub-sector, and the sub-sector associated with chemical products, goods made from rubber, and texile. Predictably, those with domesic market-oriented businesses in these four sub-sectors will be hardest hit by the applicaion of ACFTA.
g
Challenges of Industrial Development
in the Future
The development of the manufacturing sector as engine for economic growth is very important to ensure long-term economic growth. The experience of some advanced countries like the U.S., Britain, France, Japan, and South Korea shows that the industrial sector plays a signiicant role in advancing their economy. In the structure of the Indonesian economy, the industrial sector accounts for the largest in the country’s GDP. About 26% of the enire producion of goods and services come from this sector. Moreover, the importance of this sector is also relected in its contribuion towards export, the absorpion of labor force and its broader interconnecion with other sectors in the economy. Therefore, the development of this sector very much determines the dynamics of the Indonesian economy in the future.
One of the main challenges currently faced by the
Chart 5.11 RCA Commodity vs Export Growth Chart 5.12 Export Share
manufacturing industry is the need to enhance the added value of natural resources-based products. Currently, some sub-sectors which consitute the mainstay of the manufacturing sector are mostly based on natural resources such as the food and drink sub-sector (due to its link to CPO), the rubber goods sub-sector (related to its link to natural rubber), and the paper and printed mater sub-sector (due to its link to forestry products). In terms of their compeiiveness, such commodiies have a high RCA indicator and very posiive performance. Throughout 2009, these three sectors sill grew posiively. The food and beverage sector sill even managed to grow beyond 10% thanks to the substanial export of CPO. However, the added value of such products is relaively low because their manufacturing process tends to be minimal. In the future, the challenge is how to produce derivaive products using natural resources as their base materials to be developed further so that they have greater added value.
Moreover, future industrial development must also consider sub-sectors that are not based on natural resources, especially to deal with compeiion under ACFTA. The current condiion shows that in general, industrial sector products that are not based on natural resources have a relaively low compeiive edge. This condiion is worrisome given that the current applicaion of regional free trade shows that imported goods entering Indonesia are mostly non natural resources-based goods with more compeiive prices. In the future, the Government must provide incenives as well as favorable condiion to enable the country’s non natural resources-based industrialists to become highly compeiive. Thus,
it is expected that non natural resources-based domesic industries are able to grow even stronger.
The producion capacity of the manufacturing sector needs to be increased to anicipate global economic recovery and the applicaion of ACFTA. Improvement of industrial capacity is crucial. Based on a survey conducted by Bank Indonesia, the uilizaion capacity of machines in the manufacturing sector is on average beyond 70% and the machines are relaively old. If this is uncared for, the chance of Indonesian industrial products to beneit from increased global demand becomes limited.
Moreover, the development of industrial sector in the future also needs to consider regional aspects by relying more on local economic bases. The development of local economic-based industries is an important step to develop local economy. Local economy is expected to be able to develop supporing industries which provide raw materials and help for other industries. Thus, the manufacturing industry is able to reduce dependency on imported raw and auxiliary materials. The increasing spread of industry in various regions is expected to increase the aspect of inter-regional equity. Therefore, regions must be provided with opportunity, moivaion, and incenives to enable them to develop iniiaives to build the real sector based on local potenials and link it to the demand of naional and global markets. In relaion to this, local governments need to make efort to enhance sector-based producivity in their regions with some policies that are able to support the achievement of high producivity. In this regard, one of the important measures to take is to enhance ability through educaion especially in regions. With
Chart 5.13 Import of Food, paper, Cement and Wood
Products from China
Chart 5.14 Import of Texile, Iron, Chemical, Transport
Equipment from China millions of USD
Food beverages & tobacco
Paper & prining products Wood & other products Other products Cement & non-metallic quarrying
Texile leather products and foodwear Iron & steel basic metal
millions of USD
beter-educated human resources as capital, the level of producivity can be increased (Mankiw, Romer, and Wei, 1992). A strong industrial basis in each region will inally get aggregated, making the naion’s manufacturing industry stand on a robust foothold.
The development of an industry needs to consider the merit of local economies in relaion to their respecive economic structures. Java, for instance, excels when it comes to producing goods with its manufacturing industry bolstered by levels of mastery of technology higher than those in regions outside of Java (Tjahjono and Anugrah, 2006). Meanwhile, a region outside of Java such as, say, Sumatera, has superiority in the agricultural sector with rubber and palm oil as its mainstay while districts within
5.4
Increased Availability of Adequate
Infrastructure
g
The Role of Infrastructure in Economy
The availability of infrastructure is one of the important factors in driving higher and more sustainable economic growth. Based on the survey conducted by Stéphane Straub and others (2008), investment in infrastructure contributes to the economic growths in some countries.110
Infrastructure availability plays a closely-knit role in the economy in some respects. Firstly, adequate infrastructure will encourage investors to invest their money in certain sectors given that the availability of infrastructure is one of the main consideraions in investment decision making. Secondly, the certainty of infrastructure availability – especially energy and logisics infrastructure – will ensure the coninuaion of producion while the availability of infrastructure such as roads, seaports, and airports will ensure good distribuion and mobility of goods and services. This will support economic measures aimed at securing a higher compeiive edge. The important role of infrastructure is highlighted in a study by the Insitute for Economic and Social Research of the Faculty of Economics of the University of Indonesia (LPEM UI) which shows that infrastructure development is highly related to economic growth (Table 5.9).
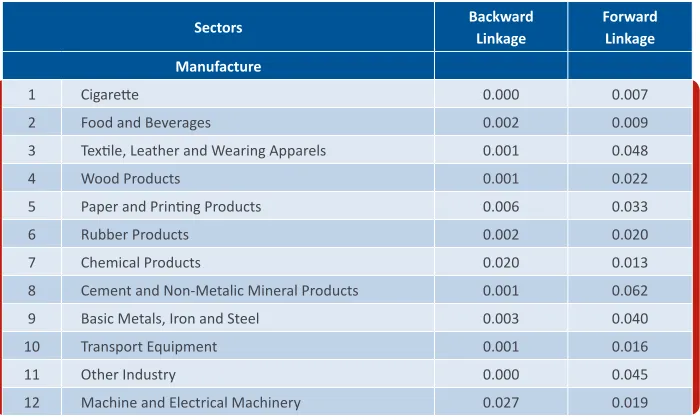
Adequate availability of infrastructure signiicantly afects the performance of the manufacturing sector. The results of a survey conducted by Bank Indonesia using 2005
input and output data indicate that the availability of infrastructure such as electricity is signiicantly related to various industrial sectors. Electricity sector is most signiicantly related to various industrial sub-sectors in paricular the cement, texile, metal and paper industries. This shows the important role of electricity as a source of energy in producion process. Meanwhile, the machine sub-sector and the chemical product sub-sector have the highest backward linkages with the electricity sector (Table 5.10).
g
Infrastructure Issues in Indonesia
Currently, infrastructure condiion in Indonesia is sill subjected to a lot of limitaion. The latest World Economic Forum survey whose results are stated in the forum’s book
itled Global Compeiiveness Report 2009-2010 shows that the quality of infrastructure in Indonesia ranks 96th out of 133 countries surveyed. In terms of infrastructure, Indonesia’s rank is sill way below that of some other countries within ASEAN such as Singapore (which ranks second); Malaysia (27); and Thailand (41) as well as China (66) (Chart 5.15).
One paricular infrastructure issue currently sill felt blocking the development of the real sector was limited electricity supply. It was predicted that the exising power capacity is already less than adequate to meet the demand for electricity consumpion, paricularly during peak load at 16.30 – 21.00 hours (Chart 5.16). In ideal condiion, the power capacity (realizaion of power that can be produced by power plants) must be 30% greater
Table 5.9 Elasicity of Infrastructure Development to Economic Growth (10% Growth of Stocks)
Table 5.10 Backward and Forward Linkage of Electricity Sector to Manufacture
Source: IO Table 2005 (processed)
* using aggregaion method from 66 sectors to only 24 sectors, IO Table 2005 (based on domesic farmer price)
Sectors Backward
Linkage
Forward Linkage
Manufacture
1 Cigarete 0.000 0.007
2 Food and Beverages 0.002 0.009
3 Texile, Leather and Wearing Apparels 0.001 0.048
4 Wood Products 0.001 0.022
5 Paper and Prining Products 0.006 0.033
6 Rubber Products 0.002 0.020
7 Chemical Products 0.020 0.013
8 Cement and Non-Metalic Mineral Products 0.001 0.062
9 Basic Metals, Iron and Steel 0.003 0.040
10 Transport Equipment 0.001 0.016
11 Other Industry 0.000 0.045
12 Machine and Electrical Machinery 0.027 0.019
Locaion Road Electricity
Telecommuni-caion
Water
Supply Harbour Irrigaion
Naional 0.884 0.839 0.610 0.220 0.259 1.264
Sumatera 0.143 0.119 0.092 0.043 0.087 0.374
Java and Bali 0.590 0.641 0.437 0.149 0.104 0.541
Kalimantan 0.044 0.032 0.027 0.011 0.041 0.070
Sulawesi 0.039 0.036 0.023 0.013 0.014 0.155
than the peak load condiion. In view of its developments, electrical power capacity has already appeared to be less than adequate to meet the demand for electricity during the peak load since 2004 (Chart 5.17). Under such condiion, any disrupion and damage to power supply system will result in scheduled power outage and interrupt the coninuity of producion and economic aciviies in general.
Another infrastructure issue relates to the relaively lower logisic performance. Based on a World Bank survey of the year 2009, the index of Indonesia’s logisic performance was sill relaively low compared to that of neighboring countries. Based on the calculaion of logisic performance index which is a composite of 6 components, that is, (1) eiciency, which covers speed and ease in the processing of permit; (2) the quality of infrastructure-related transportaion; (3) ease at ixing prices pertaining to internaional delivery; (4) the quality of logisic service; (5) the ability to trace back and track down delivery and (6) the precision of ime of internaional delivery. Indonesia’s rank was sill far below other countries in the region (Chart 5.18).
In addiion, a 2009 survey by the World Economic Forum also showed that Indonesia’s logisic quality is sill poor, Indonesia’s ranks in terms of road quality, railway, seaport and air transport were sill way below those of some other countries in the region (Table 5.11). In addiion, the study conducted by LPEM UI also showed that the logisic cost in Indonesia was quite high. Overall, the operaional cost of vehicles (trucks) for the transportaion of goods in Indonesia was Rp 3,093 per kilometer or around 34 cent U.S. dollar per kilometer. This igure was higher than
the average cost in countries within Asia which stands at 22 cent U.S. dollar per kilometer.111 The extremely high cost of domesic transportaion of goods is one of the big barriers for economic growth in Indonesia, especially the manufacturing sector.
Infrastructure limitaion in Indonesia is related to the low realizaion of infrastructure projects ofered by the Government. Data show that the Government’s eforts to encourage infrastructure development have been made through 3 events over the last 5 years. Firstly, ofers were made through Indonesia Infrastructure Summit (IIS) 2005, which was then coninued with Indonesia Infrastructure Conference and Exhibiion (IICE) 2006 and Public Private
111 Distribuion Cost of Transported Goods, Regulaions and Collecion
of Fees on the roads in Indonesia. The Asia Foundaion and the Insitute for Economic and Social Research of the Faculty of Economics of the University of Indonesia (LPEM UI). April 2008
Chart 5.15 Infrastructure Quality Raing in the Region Countries Chart 5.16 Daily Electrical Power Load Curve in Java-Madura-Bali
Chart 5.17 Full Capacity, Afordable Power, Peak Load
Source: World Economic Forum, 2009
Singapore, 2
Chart 5.18 Logisic Performance Index
Partnership (PPP) Book 2008. The realizaion of the various projects ofered under such events turns out to be quite low; only 4% of the total projects ofered are already running. As for commitments, their realizaion has just reached 9% (as of May 2009). As a whole, the accomplished projects are those in the transport sector, the water sector and the toll road sector (Table 5.12). Meanwhile, with respect to electricity development, since 2009 three new steam power plants have been operaing. They are PLTU Labuan, PLTU Rembang and PLTU Indramayu. The three projects are part of the irst phase of the plan for the development of 10,000 MW power plant projects. In 2010, a number of new power plants are expected to operate and it is targeted that half of the plan to generate 10,000 MW of electricity in the irst stage will be completed.
g
Future Challenges in Infrastructure
Development
In order to provide adequate infrastructure, the biggest challenge is to eliminate barriers of the development of
infrastructure projects (debotlenecking). Infrastructure improvement is expected to be able to help promote aciviies in the real sector so as to make it more
producive and have a higher compeiive edge and in turn able to support economic growth in the long run. To this end, the future challenge is to create favorable investment climate for infrastructure development. In relaion to this, measures such as the restructuring/simpliicaion of permit procedures, legal certainty, and employment relaions become important to consider in the future.
In addiion, suicient inancial support is required for future infrastructure development, which is a challenge. Based on Naional Development Planning Agency’ calculaion of the infrastructure development plan for 5 years to come (2010-2014), a inancing support totaling around Rp 1,429 trillion would be needed. From the total costs needed, only 31% or Rp 451 trillion come from the Government while the rest 69% or Rp 978 trillion come from the private sector. Given the signiicant inancing support from the private sector, the infrastructure availability-related challenge in the future would be how to atract private investors and make them willing to paricipate in the development of infrastructure projects.
The seriousness of the Government to remove barriers in its eforts to develop infrastructure is clearly seen in the Government’s 100-day program. Some infrastructure-related measures associated with the 100-day program include among others the establishment of an infrastructure inancing company to support infrastructure inancing, a guarantee for power supply, especially electricity through the issuance of a presidenial regulaion (Perpres) on the acceleraion of the project for the development of second-phase 10,000 MW power plants, efort to increase the low of goods and compeiive edge through the applicaion of investment
Table 5.11 Rank of Infastructure and Its Components
Source: World Economic Forum, 2009
No Countries Infratructure
6 Philippines 98 104 92 112 100 87
permit and informaion system electronically in the free trade and free port areas of Batam, and the development and maintenance of strategic infrastructure. As far as measures to simplify permits are concerned, the program includes measures to accelerate public service through
coordinaion with related agencies on the simpliicaion of requirements to start a business and to speed up the process associated with the issuance of permits.
Table 5.12 Infrastructure Projects Realizaion (May 2009)
Year 2005 (Indonesian
Infrastructure Summit)
2006 (Indonesian
Infrastructure Conference
Exhibiion)
2008 (Public Private
Partnership Book) The Total of Operated Projects up to May 2009
Sector ProjectsOfered Construcion Stage Operated
Ofered Projects
Construcion Stage Operated
Ofered Projects
Construcion Stage Operated
Ofered Projects
Construcion Stage Operated
Electrical/
Power Plant 12 0 0 2 0 0 1 0 0 15 0 0
Gas Pipelines 6 0 0 0 0 0 0 0 0 6 0 0
Transportaion 10 3 1 2 0 0 1 1 0 13 4 1 Railway 0 0 0 0 0 0 2 0 0 2 0 0
Water 24 1 2 3 0 0 1 0 0 28 1 2
Toll Road 38 5 1 2 0 0 3 0 0 43 5 1
Telecommuni-caion 1 0 0 1 0 0 0 0 0 2 0 0
Total 91 9 4 10 0 0 8 1 0 109 10 4
Raio Over
Of-fered Projets 10% 4% 0% 0% 13% 0% 9% 4%
5.5
Conclusion
In spite of global economic crisis’ signiicant impact on the Indonesian economy, the economy was sill able to grow quite well given the extremely high resilience of the real sector. The main pillar behind the high resilience of the real sector lied in economic structure that is more domesic-oriented in which the role of private consumpion is sill dominant. In addiion to economic structure, the resilience of the Indonesian economy was also supported by various iscal and monetary policies that have been put in place in an efort to miigate the impact of global economic crisis and to create favorable macro-economic condiion, especially in order to keep inlaion low. This has created expectaions among people who remained opimisic of future economic prospects.
Eforts to drive the industrial sector as the main engine to propel the Indonesian economy need some crucial measures. Firstly, the Government must issue policies focused on eforts to eliminate barriers which have thus far disrupted the implementaion of important infrastructure projects (debotlenecking) by taking measures such as simplifying permit processing as well as bolstering investment climate and legal certainty. This very much afects the private sector which wants to paricipate in the inancing of infrastructure projects. And this is important given the high expectaion of geing inancing from the private sector. By eliminaing such barriers, it is expected that infrastructure would be readily available, which, in turn, would help propel investment and compeiiveness in the manufacturing sector. Secondly, it
Box 5.1
: Important Role of the Informal Sector amidst Global Economic Crisis
The informal sector plays an important role in the Indonesian economy especially when it comes to miigate the negaive impact of global economic crisis. Under dire economic condiion, many workers are laid of. Informal sector may play a role as a bufer for domesic economy because it is able to accommodate laid-of formal sector workers. Moreover, this sector also provides alternaive job opportuniies for new jobseekers who are not absorbed in the formal sector. That’s why informal sector is able not only to survive in imes of crisis but also to grow rapidly. Moreover, the posiive role of informal sector in terms of labor consitutes one of the important factors in supporing people’s consumpion as a result of which people’s consumpion in 2009 was sill relaively high.
The main characterisics of informal sector include, among others, accessibility, a relaively small amount of capital to get a business started, reliance on local resources, a generally great number of units of business but on a small scale, the use of generally simple, adaptable and labor-intensive technology, generally low level of educaion and skills, usually low producivity of workforce and levels of wages that are relaively lower than those of the formal sector. Informal sector businesses include among others the business of selling wares, food and drinks on the street such as the one taken up by staionary and iinerant street vendors selling meals, cigarete, newspapers/ magazines, snacks and drinks.
Informal sector’s contribuion to the economy is
predominantly relected in its signiicant ability to absorb workers (especially low-income labor force). This oten helps reduce unemployment and provide the poor with sources of income in urban areas. In addiion, the informal sector also contributes to the income of city governments. In its developments, the informal sector also plays a role in supporing the formal sector through the provision of cheap inputs to large formal companies and low-cost goods for workers in the formal sector.
There are some main factors as to why the informal sector coninues to play a signiicant role in the
Indonesian economy. Firstly, the number of new entrants
to the labor market is greater than the available jobs in the formal sector so that those who do not get absorbed in the formal sector have to be accommodated by the informal sector. Secondly, the rate of urbanizaion is signiicantly high and exceeds the rate of industrializaion in urban areas. The signiicant number of people moving from rural to urban areas cannot be all absorbed by modern industrial sectors in urban areas because of the sectors’ limited absorpion capacity and because not all rural-to-urban migrants have the ability to work in the sectors. As a result, in order to survive, migrants who are not able to get into modern industrial sectors prefer informal sector which is relaively easy to get into. Thirdly, working in the informal sector is relaively easier than working in the formal sector. No high levels of skills or educaion are needed to work in the informal sector so that it is easy for many people to get into the informal sector. Moreover, it is also relaively easy to establish a business in the informal sector because not many administraive requirements are needed and the capitals required, too, are relaively small.
The important role of informal sector over the last ive years (2004-2009) is relected in the high proporion of informal sector workers to total workers and the coninuously increasing number of informal sector workers. The porion of informal sector workers over the last ive years appears more dominant than that of formal sector workers. Informal sector workers account for around 70% of the country’s total working populaion. Moreover, the number of workers in the informal sector is also coninuously on the rise. In 2004, there were 65.30 million informal sector workers but in August 2009, the igure rose to 72.72 million (Table 1).
impact of global economic crisis which has prompted a number of companies to reduce their workforce (layofs) and to the addiion of new entrants to the labor market that are not absorbed in the formal sector. In terms of labor demand, the increase in the number of informal sector workers is related to the increase in the demand for goods and services produced by the informal sector paricularly whose prices are lower than those produced by the formal sector. One of the measures taken by households or companies in the midst of global economic crisis is eiciency including subsituing consumer goods and input goods from the formal sector with the ones produced by the informal sector because their prices are relaively cheaper.
Even though it has been proven that the informal sector plays an economy-saving role in the midst of global economic crisis, future challenges need to be addressed with more serious measures to enable informal sector workers to return or move to the formal sector. Such measures are expected to be able to create more ideal condiion for the Indonesian economy in which the number of workers in the formal sector is greater than that in the informal sector. Enhancing the role of the formal sector in economy would provide a lot of beneit because the wages of workers in the formal sector are generally higher and protected by social security such as health insurance. For the Government, the enhancement
of the role of the formal sector is also beneicial to increase tax revenues. In conjuncion with this, efort to increase producion capacity in the formal sector such as the manufacturing sector is a must. To this end, the Government needs to eliminate various barriers (debotlenecking) which may disrupt efort to enhance producion capacity in the formal sector and even provides incenive so that producion capacity is able to increase rapidly. It is expected that capacity building for producion in this formal sector may serve as a stepping stone to facilitate the movement of informal sector workers to the formal sector.
Moreover, as for those who coninue doing business in the informal sector, the Government must coninue to pay atenion to their development through various measures to push for the development of informal sector. In relaion to this, the Government needs to provide incenive or assistance to informal sector workers especially when it comes to access to capital, markeing, managerial guidance, and skills improvement so that work in the informal sector can be promising for those who are not absorbed in the formal sector. In addiion, especially in the event of economic crisis, it is necessary for the Government to launch a scheme to help strengthen the informal sector in dealing with the crisis.
No The Employment
Status Ket.
2004 2005 2006 2007 2008 2009
Feb Nov Feb Aug Feb Aug Feb Aug Feb Aug