A STUDY OF USING QUEFTS MODEL FOR ESTABLISHING SITE SPECIFIC
FERTILIZER RECOMMENDATION IN MAIZE ON THE BASIS OF FARMER FIELDS
Yagus Wijayanto*) and Edy Prastyanto Faculty of Agriculture The University of Jember Jl. Kalimantan 37 Jember East Java Indonesia *)
Corresponding author Phone: +62-331-334054 E-mail: [email protected]
Received: February 2, 2010/ Accepted: June 17, 2011
ABSTRACT
Nutrient Use Efficiency (NUE) of maize is considered low. There are two important factors responsible for this condition: (a) uniform fertilizer recommendation, (b) lack of consideration on soil variability, Indigenous Nutrient Supply and plant nutrient needs. A method for studying low NUE and the capability of studying these two factors are urgently required. This study used Quantitative Evaluation of Fertility on Tropical Soils (QUEFTS) model. The main aim of this study was to employ and evaluate QUEFTS model for establishing site specific fertilizer recommendation in maize on the basis of farmer fields. Due to a unique characteristic of farmer field, it may be interesting to observe the pattern of soil fertility in relation to yields. Six farmer’s fields and thirty soil samples were taken and analysed in the laboratory. The results showed that QUEFTS model was a valuable tool to make fertilizer recommendation by using yields as an integrated indicator. The results also showed that QUEFTS model was a promising method for establishing fertilizer recommen-dation for maize. The merits of model for determining Indigenous Nutrient Supply, nutrient yield limiting factors, balanced fertilizer recommendation show that QUEFTS model is a valuable tool for site-specific fertilizer recommendation.
Keywords: QUEFTS, recommendation, site specific, yield
INTRODUCTION
Nutrient Use Efficiency in Maize in Indonesia and in almost countries in Asia is considered low which mainly relates to
inappropriate management (Dobermann in http://www.fertilizer.org/IFA/publicat/ PDF/2007_ IFA_FBMP-part_1_dobermann.pdf, Attananda and Yost, 2003). Two main factors responsible for this condition are: (a) uniform fertilizer recommendation and (b) lack of consideration on Indigenous Nutrient Supply (INS) and plant nutrient needs. These factors caused overapplication and underapplication of fertilizers (Scharf et al., 2005; Attananda and Yost, 2003; Witt and Pasuquin, 2007 in http://www. ipipotash.org/e-ifc/200714/ research4. php).
Large variability of factors determining plant performance has made this procedure impractical to be applied in real condition of field. Maiti et al. (2006), for example, claimed that there are significant differences amongst climate, soil and management, making it impossible to extrapolate the results of fertilizer recommendation from one site to others.
There are emerging technologies, particu-larly computer software which can contribute to the development of methodology for fertilizer recommendation, and one of these potential technologies is crop model. Maiti et al. (2006) claimed that crop model can assist in real time application of fertilizers. In fact, there have been a quite number of crop models which can support the development of fertilizer recom-mendation as claimed by Hartkam et al. (1999) and Segda et al. (2005). Hartkamp et al. (1999) described a number of crop models and their characteristics, two of them are DSSAT and WOFOST.These two models are called dynamic models. According to Hartkamp et al. (1999), the main weaknesses of dynamic model are: (a) significant amount of data are needed; (b) the limited data are most likely to be impediment for the calibration and validation of dynamic model. Therefore, for the purpose of fertilizer recom-mendation, a simple model is required.
Thus, a simple model for making fertilizer recommendation exists. This model is called QUEFTS (Quantitative Evaluation of the Fertility in Tropical Soils). The comprehensive descrip-tion of this model was explained in previous studies (Maiti et al., 2006; Mulder, 2000; Mowo et al. in http:// www.africanhighlands.org/pdfs/ wps/ahiwp_18.pdf). In terms of procedure used to make recom-mendation, QUEFTS model has four main stages (Mulder, 2000; Pathak, et al. 2003):
(a) The actual fertility of soil is calculated on the basis of certain chemical soil properties. For three macro-nutrients: nitrogen, phosphorus and potassium, the maximum quantity that can be taken up from the soil by the plant is determined.
(b) The relationship between potential supply (step 1) and actual uptake of the three nutrients (UN, UP, UK) is established. (c) For upper and lower nutrient bounds, yields
are calculated on the basis of the actual uptake of each nutrient (UN, UP, UK). The upper bound yield refers to the yield attainable when, for instance, N is maximally diluted in the plant, the Yield N maximally Diluted (YND) is obtained.The lower bound yield refers to the Yield N maximally Accumulated (YNA), the yield that could be obtained when N is maxi-mally accumulated in the plant.
(d) Finally the yield estimates are calculated in pairs on the basis of the actual uptake of each nutrient (UN, UP, UK) and the yield ranges are calculated in step 3 (YNA, YND, YPA, YPD,YKA, YKD). This will result in six paired estimations (YNP, YNK, YPN, YPK, YKN, YKP), which are averaged.
Evidently, QUEFTS model has been applied in many developing countries and most applications relate QUEFTS model to Site Specific Nutrient Management (SSNM). Beside the fact that QUEFTS model is simple, another reason for using QUEFTS model is because this model takes into account (a) Indigenous Nutrient Supply (INS), nutrient interaction and nutrient use efficiency. Another advantage on using QUEFTS model is that the integrated indicator variability of soil properties is more likely to exist in farmer fields due to inherent variability or the history of management occurred in every field; (b) fertilizer input into farmer field is different. As a consequence, every field could have different yields and fertilizer recommen-dation. .Therefore, the main aim of this study was to employ QUEFTS model for fertilizer recommendation at farmer fields. The focus of this study was on making recommen-dation for macro-nutrient only (nitrogen, phos-phorus and potassium).
MATERIALS AND METHODS
The study area was in Kertonegoro Village located in Jenggawah Sub-District in Jember Regency, East Java, Indonesia. The study area was about 40 Ha. The main reason of choosing this study was due to the existence of the variability of management conducted by farmers and the variability of soil properties in the area. Six farmer’ fields were chosen as samples since they repre-sented management and soil variability. Thirty soil samples were selected by grid sol sampling technique.
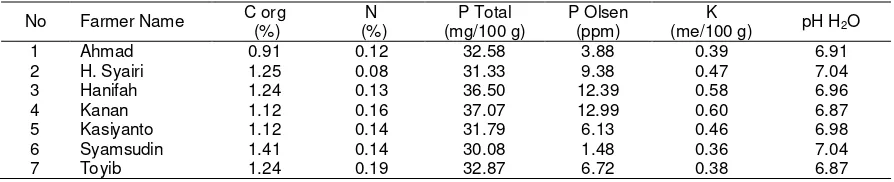
The analysis of soil samples was Capacity following standard procedure of soil analysis. The results of soil analysis were then entered into QUEFTS model. Table 1 shows the results of soil analysis indicating that other soil properties can be categorized as low to very low, except for soil P Total, K and pH (H2O).
Table 1. The results of laboratory analysis and the criteria of soil chemical for QUEFTS model
No Farmer Name C org (%)
N (%)
P Total (mg/100 g)
P Olsen (ppm)
K
(me/100 g) pH H2O
1 Ahmad 0.91 0.12 32.58 3.88 0.39 6.91 2 H. Syairi 1.25 0.08 31.33 9.38 0.47 7.04 3 Hanifah 1.24 0.13 36.50 12.39 0.58 6.96 4 Kanan 1.12 0.16 37.07 12.99 0.60 6.87 5 Kasiyanto 1.12 0.14 31.79 6.13 0.46 6.98 6 Syamsudin 1.41 0.14 30.08 1.48 0.36 7.04 7 Toyib 1.24 0.19 32.87 6.72 0.38 6.87
Table 2. Recovery efficiency obtained from calculation at the ommision plots
Partition N P K
RE (kg.kg-1) RE (kg.kg-1) RE (kg.kg-1)
Non NPK - - -
NPK 0.51 0.19 0.31
NP 0.21 0.19 -
NK 0.44 - 0.95
PK - 0.01 0.21
0.39 0.13 0.27
Model calibration was conducted by using data from Ommision plots to determine some important parameters required by QUEFTS. Besides, model calibration was conducted by using parameters used by previous studies (Maiti et al., 2006; Alxandrova and Donov, 2003). Model validation was conducted by using data obtained from the six farmer’s fields. At first, the fertilizer dosage at each farmer’s field was used as input for QUEFTS analysis. The results of analysis showed that there was a significant difference between the crop yields predicted and the actual yields. The only reason for this is that farmers had not applied balanced fertilizers, while QUEFTS model predicted crop yields on the basis on balanced fertilizer.
An important component of the analysis using QUEFTS model is the determination of Ymax (maximum yield) and GY (Grain Yield Target). In this study, Ymax was set at10000 kg/Ha, while GY Target was 70% Ymax and 80% of Ymax respectively. These Values of GY Target was considered realistic considering the yield obtained by farmers in the study area. Model Validation was conducted by running model at farmers’ fields using established parameters obtained from calibration. The yields predicted by QUEFTS model were then compared to those obtained in farmers’ fields in order to assess the accuracy using U-Theil. The values of U-Theil is interpreted as follow: if the value of U is equal to
zero, then the model is perfect, and if the value of U = 1, then the model is poor for prediction:
In which :
= the number of samples; = the predicted values of model = the real values
(Source : http://www.damandiri.or.id/file/elinu-ripbbab4.pdf)
RESULTS AND DISCUSSION
Results of Model Calibration
was taken by plant. These values show that uptake of nutrient of maize in the study area was 39% N, 13% P and 27%K of fertilizer. The values of RE in Table 2 indicates that there is a need to improve the fertilizer efficiency.
An important stage in the use of QUEFTS model is the calculation of two important parameters: (a) accumulation and (b) dilution, which are called “a” and ”d” respectively. The values of “a” and “d” can be seen in Table 3. Table 3. Parameters for QUEFTS model
Nutrients a d accurately at Ommision plots, especially when the balanced fertilizer was applied, as shown in plot NPK and NonNPK. For other plots, there seems to be a quite large difference. This difference is probably due to the nature of QUEFTS model for predicting yields in balanced fertilizer. validation. U-Theil statistic technique was used for calibrating model between the yields obtained from farmers’ fields and the predicted yields by QUEFTS model. The calculated U-Theil was 0.14 showing that the model can be used for predicting yields.
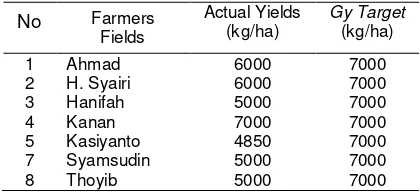
The same values (7000 kg/Ha) in column 3 (Table 5) show the targeted yield which was
set to be 7000 kg/Ha. The same values show that the yields could potentially be increased if balanced fertilizer was applied in farmers’ fields. Moreover, yield gap existed in most fields (Table 5). The results clearly indicate that there is still an opportunity to increase yields larger than the current yields by using balanced fertilizer. Table 5 . The comparison of yields at farmer’s
field and simulated QUEFTS model No Farmers
Table 6 shows the comparison of fertilizer dosage at farmers’ field and those resulting from the calculation of QUEFTS model. The results show that by considering Indigenous Nutrient Supply (INS), the dosage of fertilizer N and P was lower compared to those provided by farmers at Yield Target 7000 kg/Ha, whereas the recommended fertilizer dosage by QUEFTS model was higher for fertilizer K. However, some points need take into account:
a. there were differences in the values of Indigenous Nutrient Supply for every farmer’s field which proved that site specific condition seems to dictate the differences; b. imbalanced fertilizer inputs are most likely
to be the common practices by farmers; c. over dosage of N was the common
phenomenon in the study area.
Table 6 .The yield and fertilizer rates at farmer’s field and simulated QUEFTS model
No Farmers’ fields
Farmer’s Fertilization Practices Recommended dosages by QUEFTS at GY
Target 7000 (kg/ha)
Yields
(kg/ha) N (kg/ha) P (kg/ha) K (kg/ha)
Yields
(kg/ha) N (kg/ha) P (kg/ha) K (kg/ha) 1 Ahmad 6000 260 30 30 7000 213 48 15 2 H. Syairi 6000 318 0 0 7000 244 31 25 3 Hanifah 5000 329 30 30 7000 98 16 50 4 Kanan 7000 348 120 30 7000 63 11 50 5 Kasiyanto 4850 245 15 15 7000 109 42 50 7 Syamsudin 5000 276 0 0 7000 184 64 69 8 Thoyib 5000 280 40 40 7000 80 39 35
Table 7. The results of fertilizer recommendation modelled by QUEFTS at the target yield of 7000 kg/Ha
No Farmers’ fields
Results of QUEFTS
GY Target 7000
(kg/ha)
Fertilizers (kg/ha) Fertilizers (kg/ha)
N P K Urea SP36 KCl
1 Ahmad 7000 213 48 15 464 132 24
2 H. Syairi 7000 244 31 25 531 87 40
3 Hanifah 7000 98 16 50 214 45 79
4 Kanan 7000 63 11 50 137 31 79
5 Kasiyanto 7000 109 42 50 238 118 79 6 Syamsudin 7000 184 64 69 400 177 110
7 Toyib 7000 80 39 35 175 109 56
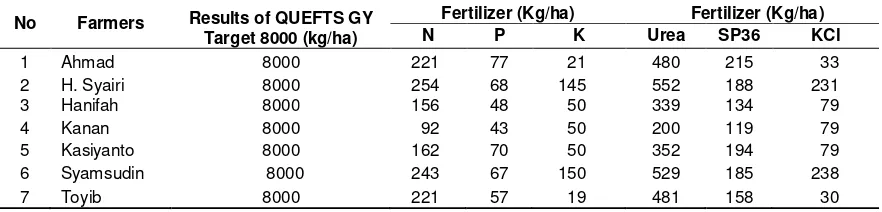
Table 8. The results of fertilizer recommendation modelled by quefts at the target yield of 7000 kg/Ha
No Farmers Results of QUEFTS GY Target 8000 (kg/ha)
Fertilizer (Kg/ha) Fertilizer (Kg/ha)
N P K Urea SP36 KCl
1 Ahmad 8000 221 77 21 480 215 33
2 H. Syairi 8000 254 68 145 552 188 231 3 Hanifah 8000 156 48 50 339 134 79
4 Kanan 8000 92 43 50 200 119 79
5 Kasiyanto 8000 162 70 50 352 194 79 6 Syamsudin 8000 243 67 150 529 185 238
7 Toyib 8000 221 57 19 481 158 30
Overall, QUEFTS model is an empirical model which potentially has a significant contri-bution for fertilizer recommendation. The capabi-lities of QUEFTS for calculating the Indigenous Nutrient Supply (INS) and crop yields provide significant benefits to Site Specific Nutrient Management.
CONCLUSIONS
This study has shown the merits provided by QUEFTS for fertilizer recommendation for farmers’ fields. The soil condition and the management in farmers’ fields are different from
one to the others, leading to the differences in yields and recommended fertilizer as modelled by QUEFTS. Although this study is considered as preliminary one, it has proven that QUEFTS model is a valuable tool for evaluating the farmer practices and provides the best management practices at field scale for improving fertilizer use efficiency, which is the main aim of Site Specific Nutrient Management.
ACKNOWLEDGMENTS
Funding 2007 and 2008. Thanks are also addressed to Dr. Christian Witt from IPNI who provided ideas and software for this study.
REFERENCES
Attananda, T dan Yost, R. 2003. A Site-Specific Nutrient Management Approach for Maize in Better Crop International, 17(1):1-7. Dobermann, A., C.Witt, S. Abdulrachman, H.C.
Gines, R. Nagarajan, T.T. Son, P.S. Tan, G.H. Wang, N.V. Chien, V.T.K. Thoa, C.V. Phung, P. Stalin, P. Muthukrishnan, V. Ravi, M. Babu, G.C. Simbahan and M.A. Adviento. 2003. Soil Fertility and Indige-nous Nutrient Supply in Irrigated Rice Domains of Asia in Agronomy Journal, 95: 913-923.
Hartkamp, A.D., J.W. White and G. Hoogen-boom. 1999. Interfacing Geographic Information System with Agronomic Modelling : A Review dalam Agronomy Journal, 91:761-772
Maiti, D., D.K. Das and H. Pathak. 2006. Simulation Of Fertilizer Requirement For Irrigated Wheat In Eastern India Using The QUEFTS Model in Archives of Agronomy and Soil Science, 52(4):403-418d
Mowo J G, B.H. Janssen, O. Oenema, Laura, A. German, J.P. Mrema and R.S. Shemdoe 2005. Soil Fertility Evaluation and Management By Smallholder Farmer Communities in Northern Tanzania. African Highlands Initiative (Ahi) • Working Papers # 18 in http://www.africanhigh-lands.org/ pdfs/wps/ahiwp_18.pdf.
Mulder I. 2000. Soil Fertility : QUEFTS and Farmer’s Perceptions. In http://www.prem-online.org/archive/17/doc/creed30e.pdf Pathak H, P.K. Aggarwal, R. Roetter, N. Kalra,
S.K. Bandyopadhaya, S. Prasad S. and H. Van Keulen. 2003. Modelling The Quantitative Evaluation of Soil Nutrient Supply, Nutrient Use Efficiency, and Fertilizer Requirements of Wheat in India. Nutrient cycling in agroecosystems, Vol. 65(2):105-113
Scharf, P.C., N.R. Kitchen, K.A. Sudduth, J.G. Davis, V.C. Hubbard and J.A. Lory. 2005. Field Scale Variability in Optimal Ntrogen Fertilizer Rate for Corn in Agronomy Journal, 97:452-461.
Segda, Z, Haefele, S.M., Wopereis, M.C.S., Sedogo, M.P and Guinko, S. 2005. Combining Field and Simulation Studies to Improve Fertilizer Recommendations for Irrigated Rice in Burkina Faso in Agron. J. 97:1429–1437.
Tabi F.O, J. Diels, A. O. Ogunkunle, E.N.O. Iwuafor B. Vanlauwe and N. Sanginga. 2007. Potential Nutrient Supply, Nutrient Utilization Efficiencies, Fertilizer Recovery Rates And Maize Yield In Northern Nigeria. Nutrient Cycling In Agroecosystems in http://www. springerlink.com
Witt, C. and J.M.C.A.Pasuquin. 2007. Research Findings: iv The Principles of Site-Specific Nutrient Management for Maize. IPNI-IPI Southeast Asia Program, Singapore.in http://www.ipipotash.org/e-ifc/2007-14/rese-arch4.php