www.orientjchem.org
An International Open Free Access, Peer Reviewed Research Journal CODEN: OJCHEG 2017, Vol. 33, No.(5): Pg. 2518-2523
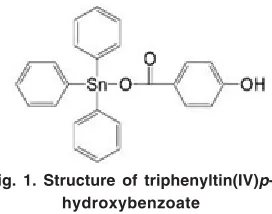
The Chemical Analysis of Triphenyltin(IV)p-hydroxybenzoate
by SquareWaveVoltammetry
HARDOKO INSAN QUDUS
2**, RIA DWI YUNITA and SUTOPO HADI
1*
1,2Department of Chemistry, Faculty of Mathematics and Natural Sciences, Universitas Lampung,
Bandar Lampung, Indonesia 35145.
*Corresponding author E-mail: [email protected], [email protected]
http://dx.doi.org/10.13005/ojc/330546
(Received: June 23, 2017; Accepted: July 28, 2017)
ABSTRACT
The method validation of chemical analysis for triphenyltin(IV) p-hydroxybenzoate compound by squarewave voltammetry has been performed. This compound has successfully been synthesized, fully characterized and applied as anticorrosion inhibitor. The squarewave voltammetry was chosen as this method has excellent sensitivity and the chemical analysis was easily conducted. The validation parameters used were linearity, limit of detection, precision and sensitivity, for this purpose the measurements of standard solution of triphenyltin(IV)p-hydroxybenzoate prepared were varied its concentrations. The concentrations used were 1.6 x 10⁻⁴ M; 3.2 x 10⁻⁴ M; 4.8 x 10⁻⁴ M; 6.4 x 10⁻⁴ M; and 8.0 x 10⁻⁴ M. The measurements were set at
conditions of potential windows of +700 mV to +1,400 mV, scan rate potential of 100 mV/s, working electrode Au, auxiliary electrode Pt, reference electrode Ag and supporting electrolyte used was NaCl solution 0.02 M in H2O-DMSO (3 : 1). The results showed that the method validation analysis gave regression linear equation of ip= 6.1857C + 7.945, coefficient correlation (r) 0.995128, standard deviation percentage (%RSD) 1.96%, limit of detection (LoD) 0.099 mM and sensitivity (S) 6.1857 µA/mM
Keywords: method validation, square-wave voltammetry, triphenyltin(IV)-p-hydroxybenzoate.
INTRODUCTION
Organotin(IV) compounds are continuous to attract attention not only due to their interesting structural features but also the wide spectra of their strong biological activities1-3. Their activities are mainly determined by the number and the type of organic ligand attached to the Sn metal center1,3. These compouunds and their derivatives have been widely used and known in many biological activity tests such as antifungal4-7, anticancer and
antitumour8-12, antiviral13, antibacterial14,15 and anticorrosion16-20.
percentage efficiency inhibition (%EI) of 80.41%21. The structure of this compound is in Fig. 1. This compound was prepared by the reaction of triphenyltin(IV) hydroxide and p-hydroxybenzoic acid with methanol as solvent and temperature reaction of 60oC and reflux times of 4 h. similar to analogous compounds previously prepared11,12,20,21.
Based on the application of this compound so far, in the future triphenyltin(IV) p-hydroxybenzoateand other derivatives may be produced in the large scale and will be extensively used in the environment. However, the analysis method to trace and detectthe presence of this compound and similar compounds in the environment is yet available. Thus, the analysis method to overcome the problem that may arise has to be prepared to study the behaviourof thesecompounds.The analyses of the tin metal and other heavy metals have been performed by voltammetry method22. Voltammetry is an analysis method which rapidly grows compare to other methods as it has some advantages such sensitivity, selectivity, the simple instrument and the ease ofthe analysis procedure23. Some applications of voltammetry are in the analyses of environment, pharmacy, the synthesis of coordination and organic compounds24.
In squarewave voltammetry, the pulse is given to working electrode in the form of symmetrical square on the base potential like stairs. The advantage of this voltammetry is its high sensitivity and very fast scan rate22. The current is measured twice in one-cycle squarewave, which are at the end of forward pulse and at the end of back pulse22. Therefore, in this paper, we reported the new method of voltammetry analysis for triphenyltin(IV)p-hydroxybenzoate compound in order to be useful for further application in the future.
EXPERIMENTAL
Materials
Triphenyltin(IV)p-hydroxybenzoate was available in our laboratory and has been previously prepared and carefully characterized by some spectroscopy techniques, aqua pure waterobtained from the laboratory of National Agency of Drugs and Food Controls, Bandar Lampung, Indonesia, sodium chloride (NaCl) and dimethylsulphoxide (DMSO, (CH3)2SO)) was obtained from MERCK and were used as received. ER 644 integrated potentiostateDAQwith three electrode system was used where the gold as working electrode, silver wire as reference electrode, andplatinumas counter electrode.
Preparation of Solution
Triphenyltin(IV)-p-hydroxybenzoate solution(10-3 M)
12.75 mg of triphenyltin(IV)-p-hydroxy-benzoate was weight out and dissolved by stirring with 6.25 ml DMSO, and was added with aqua pure water in 25-ml volumetric flask, to give concentration of triphenyltin(IV)-p-hydroxybenzoate 1 x 10⁻³ M. The concentrations of 1.6 x 10⁻⁴ M; 3.2 x 10⁻⁴ M; 4.8 x 10⁻⁴ M; 6.4 x 10⁻⁴ M; and 8.0 x 10⁻⁴ M were then prepared from the solution stock, each concentration was prepared in 10 ml.
Supporting electrolyte solution (NaCl 0.02 M)
29.25 mg of NaCl was weight out and dissolved with 50 ml aqua pure waterin volumetric flask to give NaCl solution NaCl 0.1 M. 2 ml of NaCl 0.1 M was taken and diluted to 10 ml with volumetric flask to give NaCl solution of 0.02 M.
Measurement of Blank Solution with square wave voltammetry
Blank solution was prepared by mixing 2.5 mL DMSO and 7.5 ml aqua pure water in 10-ml volumetric flask, and washomogenized. The measurement was performed by pouring 2 ml of blank solution in 2.5 ml erlenmeyer and was added with 0.5 mL NaCl 0.02 as supporting electrolyte. Then the voltammogram was measured at potential of + 700 mV to +1400 mV.
Measurement ofvoltammogramtriphenyltin(IV)-p-hydroxybenzoatewith squarewave voltammetry
The solutions of triphenyltin(IV)-p-hydroxybenzoate with concentration variations of 1.6 x 10⁻⁴ M; 3.2 x 10⁻⁴ M; 4.8 x 10⁻⁴ M; 6.4 x 10⁻⁴ M; and 8.0 x 10⁻⁴ M with supporting electrolyte NaCl 0.02 M were measured at potential window of + 700 mV to +1400 mV. Each concentration was measured for 5 times. The similar procedure in the measurement of blank solution was performed for each concentration of this solution.
The statistical analysis (Method Validation)
The data obtained were then evaluated their statistical parameters which include linearity, precision,limit of detection and sensitivity.
Linearity
The determination of linearity was done by measuring each standard solution containing triphenyltin(IV)p-hydroxybenzoate with certain concentration with square wave voltammetry for 10 times. The calibration curve was obtained by measuring the peak current of the standard solution. The current response from voltammogram for each analysis to the standard solution was then plotted against concentration. The calibration curve was then calculated with regression linear equation (y=a + bx) and the linearity was expressed by correlation coefficient (r).
Precision
The precision was determined using the concentration values of the current obtained by calibration curve. The values of mean, standard deviation (SD) and relative standard deviation percentage (%RSD) were then calculated25. The %RSD was determined using the Equation 126.
%
(1)
Limit of Detection (LoD)
Limit of detection was determined by the use of regression linear on calibration curve. Based on the measurement, the LoD was calculated using the Equation 226.
(2)
Sensitivity
Sensitivity was determined by analyzing the slope of calibration curve.
RESULT AND DISCUSSIONS
Voltammogram of standard solution triphenyltin(IV)-p-hydroxybenzoate
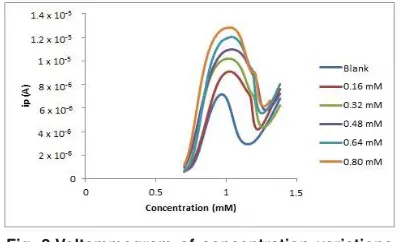
The voltammogramof standard solution triphenyltin(IV)-p-hydroxybenzoate with square wave voltammetry is shown in Figure. 2.
The voltammogram of the standard solution fortriphenyltin(IV)p-hydroxybenzoatedueto the increase of oxidation potential given by the voltammogram, the oxidation peak current (ip) and oxidation peak potential (Ep)can be identified. The data of oxidation peak current value (ip) and oxidation peak potential (Ep) of the standard solution measured were tabulated on Table 1 and 2.
Fig. 2.Voltammogram of concentration variations of standard solution triphenyltin(IV) p-hydroxybenzoate with square wave
voltammetry.
Based on Table 1 and 2, the increase of oxidation peak current of standard solution triphenyltin(IV)-p-hydroxybenzoate was affected by the concentration of the solution used, where the increase of peak current was higher with the increase of solution measured22. Thus, it can be said that the potential scan rate is directly proportional with peak current obtained. This is fit with the Randles-SevcikEquation (Eq. 3) where ip is peak current (A), A is electrode wide (cm2), D is diffusion coefficient (cm2/s), C is concentration (mole/cm3) and v scan rate (V/s)27.
Table. 1: The value of Epstandard solution triphenyltin(IV)p-hydroxybenzoate.
No Ep (Volt)
0 M 1.6×10⁻⁴ M 3.2×10⁻⁴ M 4.8×10⁻⁴ M 6.4×10⁻⁴ M 8.0×10⁻⁴ M
1 0.97 1.01 1.01 1.035 1.035 1.015
2 0.97 1.01 1.01 1.03 1.035 1.015
3 0.975 1.015 1.01 1.035 1.02 1.035
4 0.975 1.01 1.01 1.035 1.035 1.02
5 0.975 1.02 1.015 1.035 1.035 1.035
Mean 0.97 1.013 1.011 1.034 1.032 1.024
RSD (%) 0.3 0.441 0.221 0.216 0.650 1.001
Table. 2: The value ofipstandard solution triphenyltin(IV)-p-hydroxybenzoate.
No ip (µµµµµA)
0 M 1.6×10⁻⁴ M 3.2×10⁻⁴ M 4.8×10⁻⁴ M 6.4×10⁻⁴ M 8.0×10⁻⁴ M
1 7.17 9.09 10.06 10.85 11.88 12.66
2 7.45 9.09 10.09 10.91 11.91 12.67
3 7.72 9.09 10.14 10.92 11.91 12.71
4 7.92 9.1 10.19 10.93 11.99 12.82
5 8.13 9.11 10.2 10.99 12.05 12.83
Mean 7.678 9.096 10.136 10.92 11.948 12.738
RSD (%) 4.9 0.098 0.602 0.458 0.587 0.641
the stastitical test was performed using the hypothesis test (F test). It was carried out by comparing the values of F calculation and F from the table, if Fcalculated<FTable then the hypothesis is accepted. Based on the statistical test, the result was Fcalculated>FTablemeaning that the hypothesis was rejected or there are significantly differences between values of Ep of standard solution and blank solution, so the samples were not from the same variance.
Method Validation
Method validation used including parameters of linearity, limit of detection, precision and sensitivity.
Linearity
Linearity relates to the ability of analysis method to give response directly and proportional to the concentration of analyte in the sample28. This test was performed to know the standard ability to detect the analyte in the sample25. In this test, it can
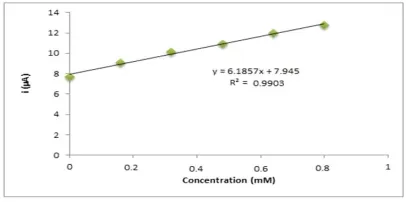
be done by creating the calibration curve of standard solution towards the response of measurement results. The regression linear equation and correlation obtained from the calibration curve was used to evaluate the relationship between concentration and current produced. The regression linear produced from the measurement of the standard solution with variation concentrations is shown in Figure. 3.
Fig. 3. The calibration curve of triphenyltin(IV) p-hydroxybenzoate using square wave
The linearity test produced the calibration curve with regression linear of y = 6.1857x + 7.945orip = 6.1857 C+ 7.945with coefficient correlation (r) = 0.995128. Based on these data, 99% of diversity on y values can be explained by the linearity relationship with x29. Therefore, the method applied in this work can be used to analyze the derivatives of organotin(IV) compound with sensitivity of 6.1857 µA/mM.
Precision
Precision relates to the proximity of independent test result obtained under the condition used. The method which a good precision is shown by the value of relative standard deviation (RSD) < 5%26. In this work, the result analysis on the blank sample using this method, the relative standar deviation of this compounnd was below 5%, i.e. 1.96%, thus the RSD of the standard solution used in this work was very good.
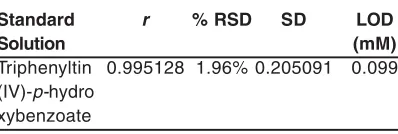
Table. 3: The values of r, % RSD, SD and LoD of triphenyltin(IV)-p-hydroxybenzoate.
Standard r % RSD SD LOD
Solution (mM)
Triphenyltin 0.995128 1.96% 0.205091 0.099 (IV)-p-hydro
xybenzoate
Limit of Detection
Limit of detection is the smallest concentration which still can be detected by the instrument. The result of measurement in this work is presented in Table 3.
REFERENCES
1. Tiekink,E.R.T., Appl. Organomet. Chem.
1991, 5 (1), 1-23.
2. Shahid,K.; S Ali, S Shahzadi, Z Akhtar, Turk. J. Chem. 2003, 27 (2), 209-215.
3. Pellerito, L.; Nagy, L., Coord. Chem. Rev. 2002, 224, 111-150.
4. Bonire, J.J; Ayoko, G.A.;Olurinola,P.F.; Ehinmidu, J.O.;Jalil, N.S.N.;Omachi,A.A., Metal-Based Drugs. 1998, 5 , 233-236. 5. Szorcsik, A.; Nagy, L.;Gadja-Schrantz, K.; Pellerito,
L.; Nagy, E.; Edelmann, E.T. J.Radioanal. Nucl. Chem. 2002,252, 523-530.
6. Hadi, S.; Irawan, B.; Efri. J. Appl. Sci. Res.
2008, 4, 1521-1525.
7. Hadi, S.,Rilyanti, M.;Nurhasanah. Modern Appl. Sci. 2009, 3,12-17.
8. Gielen, M. J. Braz. Chem. Soc. 2003, 14 (6), 870-877.
9. Rehman, W.;Badshah, A.; Khan, S.;Tuyet, L.T.A. Eur. J. Med.Chem. 2009,44,3981-3985. 10. Li, Y.; Li, Y.;Niu, Y.;Jie, L.; Shang, X.;Guo, J.; Li, Q.
J .Bioinorg.Chem. 2008,102, 1731-1735. 11. Hadi, S.;Rilyanti, M. Orient. J.Chem. 2010,
26, 775-779.
12. Hadi, S.;Rilyanti, M.;Suharso.Indo. J.Chem.
2012, 12, 172-177.
Method validation of analysis needs to be done in order to ensure and to confirm that the method used was suitable for the analysis. Referring to association of official analytical chemists (AOAC), the data obtained with validation parameter done in this work showed that the analysis performance was suitable for the purpose of the work29.
Sensitivity
Sensitivity relates to the ability of analyis procedure to show the small differences in concentration. It is the ratio of potential increase for each analyte concentration increase26. Based on the result of regression linear in this work, the sensitivity was 6.1857 as sensitivity corresponds to the slope on the regression linear equation.
CONCLUSION
The squarewave voltammetry method has successfully been used to analyzed thetriphenyltin(IV)p-hydroxybenzoate. The method validation data were successfully obtained.
13. Singh, N.K.; Srivastava, A.; Sodhi,A.; Ranjan, P. Transit. Metal Chem. 2000,25, 133-140. 14. Maiti, A.; Guha, A.K.;Ghosh, S . J. Inor. Biochem.
1988, 33, 57-65.
15 . Win, Y.F.; Teoh, S.G.;Vikneswaran,M.R.; Sivasothy, Y.; Ha, S.T.; Ibrahim, P. Aus.J. Basic Appl. Sci.
2010,4,: 5923-5931
16. Kurniasiah, H ,Nurissalam, M ,Iswantoro, B , Afriyani,H , Qudus,H.I., Hadi., S., Orient. J. Chem. 2015, 31, 2377-2383.
17. Hadi, S.; Afriyani, H.; Anggraini, W.D.; Qudus, H.I.; Suhartati, T. Asian J. Chem. 2015, 27, 1509-1512.
18. Singh,R.;Chaudary, P.; Khausik, N.K. Rev. Inorg. Chem. 2010, 30,275-294.
19. Rastogi,R.B.; Singh, M.M.; Singh, K.; Yadav, M. Afr. J. Pure Appl.Chem. 2011, 5, 19-33. 20. Hadi, S.; Afriyani, H.; Qudus, H.I.; Noviany, J. Chem.
Pharmaceut. Res. 2016, 8 (8), 975-980. 21. Afriyani, H.Sintesis Dan Karakterisasi
S e n y a w a Tu r u n a n Tr i f e n i l t i m a h ( I V ) Hidroksibenzo at Sebagai Inhibitor Korosi Pada Baja Lunak Dalam Medium NatriumKlorida. (M.Sc. Thesis). Universitas Lampung. Bandar Lampung, (in Indonesian), 2016 .
22 . Wang, J.,Analytical Electrohemistry. VCH Publisher.New York, 2000.
23. Harvey,D.,Modern Analytical Chemistry. The Mcgraw-Hill Companies, Inc.Nort America,
2000.
24. Skoog, D.A.; Holler, F.J.; Nieman,T.A., Principles of Instrumental Analysis. 5th ed. Harcourt Brace College Publishers. USA. 1998, 563-598. 25. Riyanto, Validasidan Verifikasi MetodeUji.
Deepublish.Yogyakarta, (in Indonesian),
2014.
26. Miller, J.C.; Miller,J.N.,Statistics forAnalitycal Chemistry, 3rd ed, Ellis Horwood, PTR Prentice Hill, New York, 1993.
27. Kounaves, S.P.,Voltammetric Techniques. Handbook of Instrumental Techniques for Analytical Chemistry.Frank A. Settle (Ed). Prentice Hall, Inc.New Jersey, 1997.
28. Harmita, Petunjuk Pelaksanaan Validasi Metodedan Cara Penghitun annya. MajalahIlmu Kefarmasian. 2004, 1 (3), 117-135. (in Indonesian)