Available online at HABITAT website: http://www.habitat.ub.ac.id
Production and Efficiency of Pond Fish Farming Business Milkfish
Hadi Sudarmo1, Samsul Alam Fyka2*
1Department of Agribusiness, Faculty of Agriculture, H.E.A Mokodompit 9323, Anduonohu Kendari,
Indonesia
Accepted: February 14 2017; Revised: March 4 2017; Published: April 1 2017
ABSTRACT
Various different factors, either direct or indirect one, contribute to decreasing production of milkfish in milkfish farms located in North Konawe. Production of milkfish in the area is relatively low and it is predicted that the milkfarmers’ inability to either allocate inputs or maximize the use of the inputs becomes the cause. Therefore, the objectives of the study were to analyze the line of production factors and production efficiency of milkfish farm in South Konawe. Path analysis was the method to analyze the direct and indirect factors affecting the production of the milkfish farm while marginal product value was the one used to analyze the price efficiency and optimal input. The findings of the study indicated that: the factors that directly affected production were the number of seed and employees as well as the amount of fertilizer while the factors indirectly affecting production were the number of seeds and employees as well as the amount of fertilizer. The milkfish farms in North Konawe would become efficient when there were 7,606 milkfish seeds, 41 employees and 427 kilograms of fertilizer.
Keywords: production; efficiency; optimal input How to cite: (Sudarmo & Fyka, 2017)
Sudarmo, H., & Fyka, S. A. (2017). Production and Efficiency of Pond Fish Farming Business Milkfish. HABITAT, 28(1), 14–21. https://doi.org/10.21776/ub.habitat.2017.028.1.3
1. Introduction
The purpose of production or cultivation is to gain as much profit as possible. Being able to get maximum profit is closely related to the efficiency in production. Milkfish farm is an example of production and milkfish farmers should be paid attention to. North Konawe is a municipality in which milkfish becomes their natural resources and as the result, there are a lot of milkfish farms.
Based on the data from the Department of Marine Affairs and Fisheris of South East Sulawesi (2014), production of milkfish in North Konawe is increasing from one year to another even though the increase has yet been significant compared to the potentials and total area in the region.
A lot of factors, either direct or indirect one, contribute to decreasing milkfish production in North Konawe. Examples of the direct factors are employees, stocking density, feeding, fertilizing
and liming while the examples of the indirect ones are total area of the fishfarm, fish farmer’s experience and age of fishpond. Low production results in low profit; these are due to lack of efficienct in allocating input and inefficient use of the input.
Milkfish farm in North Konawe should be developed optimumly in order to increase the public welfare. The development should be effective, efficient, optimum, sustainable and environmentally friendly. In running their business, milkfish farmers in North Konawe use various production factors. All of the factors have their own impact towards the fishfarm productivity. Some of the factors have direct influence while some others have indirect one.
Environmental issues in shrimp farm are ones related to wrong choice of location and improper business management such as water quality maintenance, feeding time, cultivate quality and quantity as well as lack of coordination between fishfarmers. Another frequent issue is lack of funding or capital because building complete fishfarm with secondary and tertiary irrigation ---
*) Corresponding Author.
Available online at HABITAT website: http://www.habitat.ub.ac.id system requires a lot of money. Furthermore, the
fish farmers who do not have a lot of money may find it difficult to buy fry and seeds (Maulina, et.al, 2012).
Previous studies have discussed some production factors in milkfish farming. Silondae (2005) conducted a study focusing on the efficiency of production factors in milkfish farm (a case study in Tinanggea, South Konawe). The finding stated that employee, seed, fish feed and fertilizer were the production factors that simultaneously had significant influence towards milkfish production while fertilizer alone did not have any significant influence towards the production. However, utilization of the production factors in Tinanggea is a topic that has yet been discussed. Therefore, analysis towards which production factor that directly or indirectly affects milkfish farm productivity is needed. The significance of the analysis is description about the most current situation of milkfish farming in North Konawe and methods to use production factors effectively. The objectives of the study are (1) analyze line of production factors in milkfish farm, (2) analyze how efficient the production factors in the milkfish farm are used, and, (3) analyze how the efficient factor is used in the milkfish farm.
2. Methodology
The setting of the study was Motui and Lasolo, two regions located in North Konawe. Purposive sampling was the method used to select the setting; Motui and Lasolo were the areas that produced the highest amount of milkfish in North Konawe. The population was 257 fish farmers who had milkfish farm in the areas. The Slovin’s formula, which was adopted by Umar (1998), was the formula used to determine the total number of the samples. The total sample was 87 who consisted of 2 regions and four villages. Simple random sampling was the sampling technique used.
The data were analyzed to meet the following purposes, namely:
Purpose 1: analyzing the line of production factors in milkfish farm using path analysis with the following steps (a) testing correlation between variables, (b) determining path coefficient.
a. Testing Correlation between Variables The following equation (Nazir, 2003) was used to descibe correlation between variables. 𝑟𝑋𝑖𝑋𝑗=
𝑛 ∑𝑛ℎ−1𝑋𝑖ℎ𝑌𝑗ℎ− ∑𝑛ℎ−1𝑋𝑖ℎ𝑌𝑗ℎ √𝑛 (∑𝑛 𝑋2
ℎ=1 𝑖ℎ− (∑𝑛ℎ=1𝑋𝑖ℎ)2) 𝑛 ((∑ℎ=1𝑛 𝑋2𝑗ℎ− (∑𝑛ℎ=1𝑋𝑗ℎ)2))
………..(1)
Description:
rXiXj = correlation coefficient n = total sample
i ≠ j = 1,2,4,5,6 b. Path Coefficient
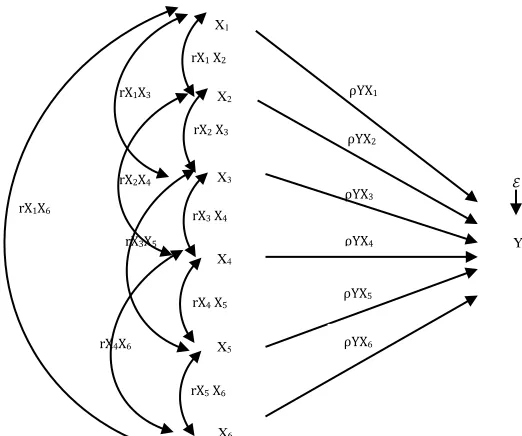
The following model was used to determine path coefficient.
Y = ρYX1X1 + ρYX2X2+ ρYX3X3 + ρYX4X4 + ρYX5X5 +
ρYX6X6 + ρYℰ
………..(2)
Description:
Y = Production (Kg)
ρYXi = Path coefficient; i = 1,2,3,4,5,6 X1 = Fishfarming experience (year) X2 = Number of seeds (seed) X3 = Employee (person)
X4 = Total area of the fishfarm (Ha) X5 = Fertilizer (Kg)
X6 = Saponins (Kg)
Available online at HABITAT website: http://www.habitat.ub.ac.id 1. When F was significant or < α = 0.1, the
exogenous variables simultaneously had significant influence towards production. 2. When F was significant or > α = 0.1 the
exogenous variables simultaneously did not have significant influence towards production.
Partial testing of exogenous variable towards endogenous variable was as follow:
1. When t was significant or < α = 0.1, the exogenous variable partially had significant influenve towards production.
2. When t was significant or > α = 0.1, the exogenous variable partially did not have significant influenve towards production. In the partial testing, any exogenous variable that did not have significant influence towards the endogenous variable would be eliminated. The analysis was conducted once again to describe the direct and indirect influence.
The following formula was used to describe the direct influence.
Y ← Xi → Y = Y ρYXi…...(3) Description:
Y = Production (Kg) Xi = exogenous variable
ρYXi = path coefficient; i = 1,2,3,4,5,6 rYXi = correlation coefficient of Xi i ≠ j = 1,2,4,5,6
Having determined the coefficient correlation and path coefficent, the correlation between variables was described in the following chart
Figure 1. Relationship between Variables Chart Purpose 2: Analyzing Price Efficiency and
Optimizing the Milkfish Farming Price was efficient when marginal
Price efficiency was achieved when marginal productivity value of each input with input price equaled to one. Nicholson (2002) stated that requirement for the condition was NPM equaled the production factor price.
Available online at HABITAT website: http://www.habitat.ub.ac.id
Py = production factor Y price (Rp/Unit) Pxi = production factor X price (Rp/Unit)
3. Results and Discussions 3.1. Path Analysis
Path analysis was conducted through correlation analysis and path coefficent analysis. 3.2. Correlation Analysis
The result of the correlation analysis between variables showed the variables had positive and significant relationship. The positive and significant relationship was between X4 and analysis showed that the correlation between the variables and the indicators was significant because the scores were closer to one. As the result, the path analysis may be conducted.
3.3. Path Analysis
Structural equation described the influence of X1, X2, X3, X4, X5, X6 towards Y. The influence of the variables would be clear by comparing between the significant value and the 10% level of significance (α = 0.1). When the significant value was lower than the level of significance, the variable had significant influence towards Y. Table 1 showed that the significant value (0.000) was lower than the level of significant (α =0.1). Therefore, X1, X2, X3, X4, X5, X6 simultaneously had significant influenve towards Y.
The following step was the partial analysis; when the significant value was lower than the level of significance (α =0.1), the variable partially had significant influence towards Y.
X1, X4 and X6 consecutively did not have significant influence towards Y while X2, X3 and X5 did. The determination coefficient (R2) was 0.776 which meant that the exogenous variable had
77.6% towards the endogenous variable and the remaining 22.4% was affected by other variables outside the model.
Table 1. Exogenous Variable Path Coefficient
Variable Path Coefficient tratio Sig. Fratio R2 X1 -0.046 -0.773 0.442 Note: * = significant when the level of significant was 10% (α =0.1)
Based on the coefficients, the structural equation was as follow:
𝑌 = −0.046𝑋1+ 0.352𝑋2+ 0.284𝑋3+ 0.151𝑋4+ 0.318𝑋5− 0.159𝑋6+ 0.224ɛ………...(12) Description:
Y = Production (Kg)
X1 = Fishfarming Experience (Year) X2 = Number of Seed (Seed) variables was improved using the Trimming method; it is a method that eliminated non significant variables (X1, X4, and X6). The Trimming method re-analyzed only the significant variables (X2, X3, and X5). Table 2 described the path coefficient having finished the Trimming method.
Table 2. Exogenous Variable Path Coefficient after Trimming
Note: * = significant when the level of significant was 10% (α =0.1)
Available online at HABITAT website: http://www.habitat.ub.ac.id towards Y. The exogenous variable had 76.9%
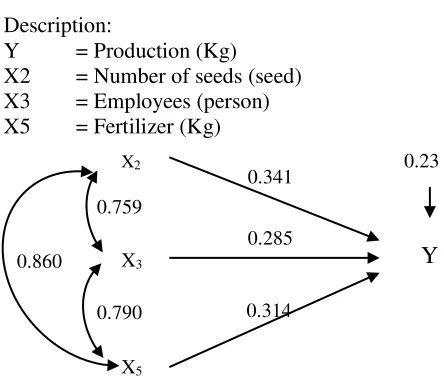
towards the endogenous variable while the remaining 23.1% was influenced by other variables outside the model. The structural equation developed after trimming was as follow:
𝑌 = 0.341𝑋2+ 0.285𝑋3+ 0.314𝑋5+ 0.231𝜀……...(13)
Figure 2. X2, X3, X5 towards Y Path Diagram The trimming method eliminated several variables, X1, X4, and X6 because these three did noy have significant influence towards milkfish farming production. Figure 2 described the relationship between variables after Trimming was conducted.
3.4. Direct and Indirect Influence of Number of Seeds, Employment and Fertilizer towards Milkfish Production
The analysis towards direct and indirect influence of the number of seeds, employment and fertilizer towards milkfish production revealed that seed was the dominant variable. Table 3 described the influence of the variables towards milkfish production.
Table 3. showed that in terms of the direct influence, the number of seeds was the most dominant variable (0.116 or 11.6%) followed by the amount of fertilizer (0.099 or 9.9%). In terms of the indirect influence, the number of seeds again became the most dominant variable (0.166 or 16.6%) followed by the amount of fertilizer (0.163 or 16.3%). In total, the influence of the number of seeds and fertilizer towards the milkfish production was 0.282 (28.2%) and 0.262 (26.2%) respectively. The total influence of all variables was 0.770
(77.0%) while that of the residual variable was 0.230 (23.0%).
Table 3. The Influence of Seeds, Employees and Fertilizer towards Milkfish Farming Production
Variable Influence Total
Direct Indirect Residual Variable Influence 0.230
Table 3. showed that the number of seeds had 0.166 (16.6%) indirect influence towards milkfish production and it had 0.116 (11.6%) direct influence towards the production. Milkfish seeds are not going to kill one another (canibalism) and therefore, higher number of seeds will increase production. It is in line with the findings of Tjoronge (2005) and Kholifah, et.al (2008)’s study stocking density was not a direct factor that influenced the lifespan of milkfish because milkfish searches for food in small groups.
Studies showed that the average stocking density in milkfish farm is between 5.000 and 7,000 seeds/Ha. Compared to the SNI 7309;2009, the average was low since the stocking density of intensive milkfish production for consumption is between 10-25 fish /m2(10,000-100,000 fish/Ha).
Kholifah, et.al (2008) explained that in order to get maximum level of production, the suitable stocking density is 25 milkfish/m2. It showed that the milkfish farming in North Konawe was semi-intensive because it relied upon natural fishfeed. Low density meant the milkfish would get more food but production-wise, it was not efficient. At the opposite, high stocking density equaled more fishfeed and may affect quality of water which eventually affected growth and survival of the fish.
Available online at HABITAT website: http://www.habitat.ub.ac.id and the year of business establishment
simultaneously affected production.
Fertilizing was critical because it provides phytoplankton as source of food and oxygen in the water (Murachman, et.al, 2010). Fertilizer, and liming as well as quantity of water and irrigation have significant influence towards fishfarm productivity. The type of fertilizer the milkfish farming used was TSP and Urea. These types of fertilizer allowed the natural fishfeed (clasp) to grow. It is in line with the main function of fertilization, to provide nutrients necessary for the growth of natural food, improve soil structure and inhibit absorption of water on porous soils. The use of those types of fertilzer to fertilize the soil that became the bottom of the fishpond was suitable, because it contained essential mineral and major
organic acids for soil fertility and growth of the clasp or natural fishfeed.
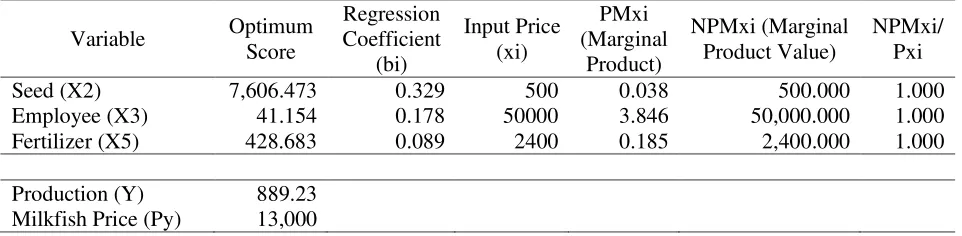
3.5. Analysis towards Price Efficiency and Optimum Production Factors in the Milkfish Farm
Efficiency is the focus of various business sectors including fish farming. Objective of input efficiency is to get optimum output. One of the purposes of the study was to analyze price efficiency of milkfish farming. Requirement to achieve price efficiency of production factors is the ratio between marginal product score (NPMxi) and production factor price (Px) equals to one. Table 4 described the price efficiency of the production factors.
Table 4. Price Efficiency of Production Factor in Milkfish Farming Variable Average
Table 4. the milkfish farm in Konawe has yet utilized their input efficiently. The evidence was the ratio between marginal product value of the input (NPMxi) and the price of input (Pxi) was higher than one. The reason was the inaccurate use of input.
The variables, the number of seeds, employees, and fertilizer, were not efficient and as the condequence, additional input was needed. Findings of Tajerin (2007)’s study showed that the average level of efficiency was between low to
average; such efficiency level has yet been efficient technically speaking.
Hukom, et.al (2013) described that total area and seeds were the two production factors that had yet been efficient. Traditional aquaculture should increase their total area and seeds they use. On the other hand, employees for preparation-harvesting, fertilizer, lime and saponins were inefficient production factors that should be eliminated.
In order to be efficient, the milkfish farm should meet the optimum score. Table 5. described the optimum scores of the variables
Available online at HABITAT website: http://www.habitat.ub.ac.id Table 5. showed that the input would be
efficient when there were 7,606 seeds, 41 employees and 427 kilograms of fertilizer. Milkfish farm requires a lot of employees because production requires a lot of work.
Andriyanto, et.al (2013) stated that based on analysis towards production efficiency, employee, fertilizer, fishfeed and stocking density were the production factors that has yet been efficient (optimum condition has yet been fulfilled). Therefore, fish farming should increase the following production factors, namely employee, fertilizer, fishfeed and stocking density.
4. Conclusion
1. The production factors that have direct influence are the seed (0.116 or 11.6%), and fertilizer (0.099 or 9.9%) and the ones that have indirect influence are the seeds (0.166 or 16.6%) and fertilizer (0.163 or 16.3%). The total influence of the number of seeds and amount of fertilizer towards milkfish production are 0.282 (28.2%) and 0.262 (26.2%). The total influence of all variables is 0.770 (77.0) while that of the residual variable is 0.230 (23.0%).
2. The milkfish farming in North Konawe has yet had been efficent because the efficiency scores of the sedes, employees and fertilizer were 1.001, 10.037 and 1.137respectively; these are higher than 1.
3. The milkfish farms in North Konawe would become efficient when there were 7,606 milkfish seeds, 41 employees and 427 kilograms of fertilizer.
References
Andriyanto, F., A. Efani dan H. Riniwati. 2013. Analisis Faktor-Faktor Produksi Usaha Pembesaran Udang Vanname (litopenaeus vannamei) di Kecamatan Paciran Kabupaten Lamongan Jawa Timur; Pendekatan Fungsi Cobb-Douglass. Jurnal Economic and Social of Fisheries and Marine Journal, Vol. 1(1): 82-96.
Dinas Kelautan dan Perikanan Provinsi Sulawesi Tenggara, 2014. Statistik Perikanan Budidaya Tahun 2009-2013. Department of
Marine Affairs and Fisheries, South East Sulawesi, Kendari.
Hukom, V., T. Kusumastanto, dan D. Djokosetyanto. 2013. Jurnal Aplikasi Manajemen, Vol. 2 (4): 585-594.
Juarno, O., Rina, O., Akhmad, F., dan Nunung, N. 2011.Kinerja Produktifitas dan Faktor yang berpengaruh terhadap Factor Productivity (TFP) Tambak Udang Indonesia.J. Sosek KP Vol. 6 No.(2).2011.
Kholifah, U., N. Trisyani dan I. Yuniar. 2008. Pengaruh Padat Tebar yang Berbeda Terhadap Kelangsungan Hidup dan Pertumbuhan Polikultur Udang Windu (Penaeus monodon Fab) dan Ikan Bandeng (Chanos chanos) pada Hapa di Tambak Brebes - Jawa Tengah. Jurnal Neptunus, Vol. 14 (2): 152-158.
Lelono, E. J. dan I. Susilowati. 2010. Penguatan Kinerja Budidaya Tambak dalam Rangka Pencapaian Ketahanan Pangan.Jurnal Ekonomi Pembangunan, Vol. 11 (2): 202-216.
Maarif dan Sumamiharja. 2000. Strategi Peningkatan Produktivitas Udang Tambak. Journal II Pertanian Indonesia. Vol 9. (2). Maulina, I., A. A. Handaka dan I. Riyantini. 2012.
Analisis Prospek Budidaya Tambak Udang di Kabupaten Garut. Jurnal Akuatika, Vol. 3 (1): 49-62.
Muliawan, I, Zamroni, A dan Priyatna, FN. 2016.
Kajian Keberlanjutan Pengelolaan Budidaya
Ikan Bandeng di Gresik. Jurnal Kebijakan
Sosek KP Vol. 6 No. 1 June 2016: 25-35
Murachman, N. Hanani, Soemarno dan S. Muhammad. 2010. Model Polikultur Udang Windu (Penaeus monodon Fab), Ikan Bandeng (Chanos-chanos Forskal) dan Rumput Laut (Gracillaria sp.) Secara Tradisional. Jurnal Pembangunan dan Alam Lestari, Vol. 1 (1): 1-10.
Nazir, Moh. 2003. Metode Penelitian, Edisi 5. Ghalia Indonesia, Jakarta.
Available online at HABITAT website: http://www.habitat.ub.ac.id Silondae, Irwan Hasanuddin, 2005. Efisiensi
penggunaan faktor-faktor produksi usahatani tambak ikan bandeng (Studi kasus di Kecamatan Tinanggea Kabupaten Konawe Selatan). Thesis. UGM.
Sumaryanto, 2001. Estimasi Tingkat Efisiensi Usaha Tani Padi dengan Fungsi Produksi Frontier Stokastik, Jurnal Agro Ekonomi, Vol 19, No. 1, pp.65–84.
Susilo, H. 2007. Analisis Ekonomi Usaha Budidaya Tambak dan Faktor-faktor yang Mempengaruhi Produksi. Jurnal EPP, Vol. 4 (2): 19-23.