Modeling of Risk Factors in Determining Network Security Level
Martin Suhartana, Bens Pardamean and Benfano Soewito
Universitas Bina Nusantara, Jakarta, Indonesia
[email protected], [email protected], [email protected]
Abstract
This paper provides a series of work on risk management models to identify the assets and risks. The goal of modeling them is to analyze and calculate meaning of the level of security in the cyber world. Analyzing and calculating was done by the quantitative method, so that the investment decision in security tools were expected to be objective, which were based on performance and situational experiences in an organization. Risk management was then associated with the calculation of costs that may occur with the point of view of the financial aspects of ROI/CBA, such as NPV, IRR, and ROI, so it can be measured in the level of security of the organization and can be maintained within a certain period. Our model consisted sixteen formulas that can show the increasing level of security based on the cost.
Keywords: Risk Management, Network Security, Security Level, Risk Assessment, Asset Identification, and CIA
1.
Introduction
The use of digital technology and the Internet in the business world was an effort so that the business could run more effective and efficient. An improvement in customer service was expected, while the cost of the business becoming more efficient. However, the development of business applications in the Internet were also accompanied by an increase of cyber crime that could disrupt business processes to the detriment of the company (Viduto et al., 2012; Bojanc et al., 2012). Becoming more obvious that Internet security was very important. However, the cost of security for this issue was very high, while on the other side network security level was difficult to measure when compared to the cost incurred. Because of that, great number companies were reluctant to spend money to improve the security of these networks (Harland et al., 2002; Hare and Goldstein, 2010). It was a question in business about how the cost of dollars relates to how much security level will be achieved.
This paper discussed the correlation between the cost incurred and the extent of security that could be achieved. Clarity in security level, when network security was characterized by an increase in the safe and convenience service for customer, compared to the cost incurred could convince company to incur in securing its networks. This is consistent with the concept of security, the CIA (confidentiality, integrity, availability) (Whitman and Mattord, 2010; Rahimi and Zagham, 2012; Ioannidis et al., 2012; Viduto et al., 2012).
Management of the company has always considered the risk of financial and business aspects of such issue and it becomes a mindset for decision making in corporate management. Studies have produced a modeling standard to relate cost value and the level of security so that the decision making could be performed in a more objective, measurable, effective and efficient way when determining the level of security of the company (Bojanc et al., 2012). (Harland et al., 2002).
perform simulations as well. Models which currently exist only discussed the technical aspects of identification only, and not discussed thoroughly until the financial calculations and business processes that complicate the analysis, calculation, and implementation. On this research, a model was made with the consummation of the more easily understood and international standardization refers to the National Institute of Standards and Technology Special Publish 800 Series (NIST-SP800) on guidelines for conducting risk assessments and the International Organization for Standardization ISO 27001/27002: 2005 regarding information security systems and evaluation models management for financial calculations (Bojanc et al., 2012; Viduto et al., 2012).
In the process of applying this research in modeling, someone who was able to identify, classify, and control the risks from various sources asset is needed (Lo and Chen, 2012). In addition, to get the maximum results in the application of the proposed model requires common understanding in terms of network security as one of the assumptions of the model is made all the stakeholders that have a high understanding of network security. It is implied as one of the assumptions of the model is made all the stakeholders that have a high understanding of network security. Therefore, to equate understanding of this network security, training program is conducted for all stakeholders to raise awareness and as well to plant good knowledge and high vigilance against threats and vulnerabilities of a system (Luminita and Magdalena, 2012; Pander, 2001).
2.
Methodology
The approach to identify risk factor followed reference from ISO Standard/ IEC 27001/27002 and NISP SP800 (Viduto et al., 2012; Bojanc et al., 2012; Lo and Chen 2012) which was then mapped to the form of variables that were considered vulnerable and threat potential. Discussion in the modeling of risk factors was intended to protect CIA in the business process.
Organizational investment companies issue policies to improve information security covering processes, and technology, which was developed in the form of system variables including system information software and hardware that use, store, and transmit that information. Through the implementation of these policies, training and awareness programs on network and information security are done in order to obtain a more effective investment decisions and efficient (Ioannidis et al., 2011; Yue et al., 2006; Harland et al., 2002; Hare and Goldstein 2010; Bojanc et al., 2012).
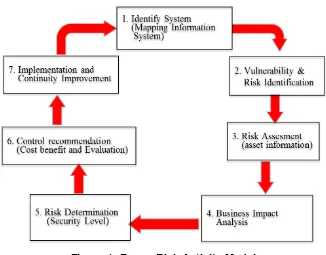
Figure 1. Frame Risk Activity Model
The discussion of network security on the technical and nontechnical aspect were overlooked through six terms of approach, namely 1) Financial loss (budget and policy), 2) Performance losses (operating losses), 3) Physical losses (technical), 4) Psychological harm, 5) Social disadvantage, 6) Loss time (time management) (Harland et al., 2002; Reggiani 2012).
3.
Modeling
To complete the planning process modeling, it was conducted conceptual framework and methodology development while collecting some data information. Figure 1 illustrated the model of the framework.
Conducting assessment on the security level overview early could be seen as a mean of controlling business risk as a representation of risk management activity. Through quantitative mathematical modeling approach, more objective assessment was thus expected. Using the model describing those recommendations, the management could provide all the decision in managing the existing system during certain period, either to maintain or to increase the previous security level through preventive, corrective or detective action.
The more the evaluation of these models according to the recommendations was conducted, the quicker new issue was identified conforming immediate risk aversion. Thus the network security level could continue to scale to a certain value.
4.
Formulation
Assessment of risk reduction objective would be obtained by referring to NIST-SP800, ISO/IEC 17799, and ISO 27001/27002 as the standard of network security. It was then linked to several quantitative methods such as RAOM which was combined with weighted assessment of Gordon & Loeb and Robust Technology, and the evaluation model as the basis of business management control and financial aspects as well.
i
n i Risk
1
basic formula.
(events) x (probability) x (consenquenses)
with:
Events: all production activities within organization (usually event services) collected through monitoring its success or failure
Probability: Likelihood assumption of all production activity predicted to cause loss or error which determined through objective evaluation using weighing score.
Consequences: controlling and considering the worst possible loss as a minimum consequence that must be accepted.
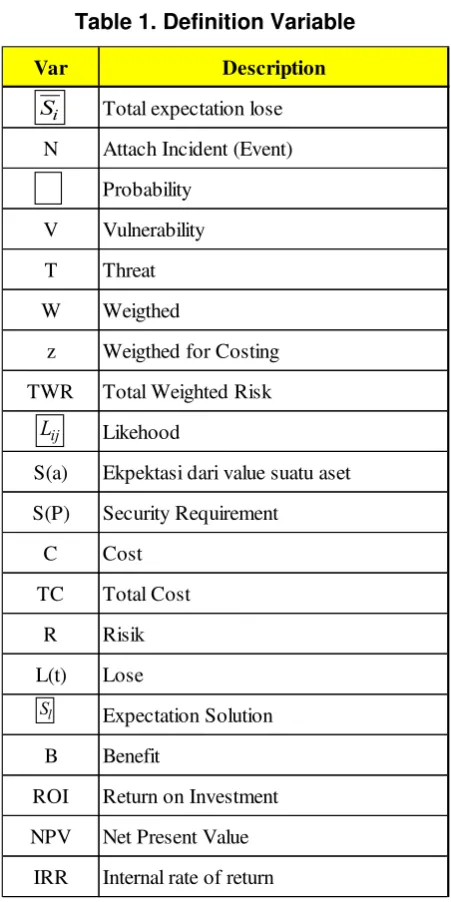
Before doing the modeling, variables should be prepared and collected first to facilitate the process of building model and formula which were going to become the result of this research. Table 4.1 enlisted those variables and its description.
Table 1. Definition Variable
Var Description
Total expectation lose
N Attach Incident (Event)
Probability
V Vulnerability
T Threat
W Weigthed
z Weigthed for Costing
TWR Total Weighted Risk
Likehood
S(a) Ekpektasi dari value suatu aset
S(P) Security Requirement
C Cost
TC Total Cost
R Risik
L(t) Lose
Expectation Solution
B Benefit
ROI Return on Investment
NPV Net Present Value
IRR Internal rate of return
r
Si
Lij
Sl
explained previously were added. Specifically, the concept of risk that was a sum of multiplication of events, probability and consequences was added as well. Preceded by that basic formula, through further consideration and analysis, above explained concept was derived into concise formula and model so that it became easier to be carried and understood.
Table 1 enlisted the symbol and description of variables in the formula used to perform quantitative calculation, modeling and derivative formulas. Hence the process of considering the risk could be measured mathematically in order to achieve more objective consideration.
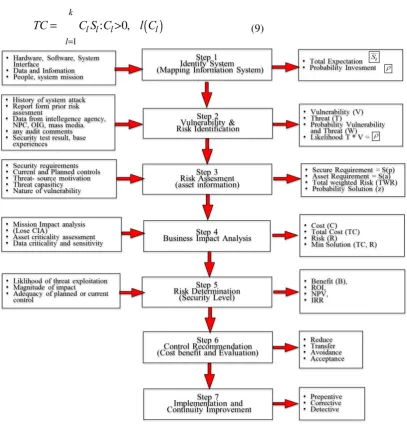
Figure 2 discussed steps to be taken in modeling by considering risk factor to determine the network security level and finalized with the financial evaluation which was able to be mapped and extracted as derivative formula for certain variable and quantitative formula on each step. There were seven sub steps on each step resulting in brief explanation for both formula and its derivatives resulting as many as 16 formulas (Viduto et al., 2012; Bojanc et al., 2012).
The first step was to identify the system for appraising some assets as a means of production by examining risks that might arise in the future. Things that should be taken into account as inputs were:
1. Determine the system or asset within a business organization such as hardware, software, and system interfaces.
2. Workers or employee or user or staff.
3. Mission or purpose of the built system/developed system.
4. It was composed into system parameter for supporting business needs or requirement on the organization.
Assessment of the organization’s assets in companies was performed using the following formula:
asset Value
1
m
i
i i i S
N V (1)
Refer to Table 1 for description of variables N,i,Vi,Si..
The second step was to identify the vulnerability risk and threat. Vulnerability was every possible risk appearing in the future which stands as an input when analyzing existing system susceptibility which in itself was a possible threat for organization in the later days. The basic input could come from historical analysis data of attack, intelligence data, mass media, report of risk event, audit report, and also demand and security expectation from the company itself, including the result of safety tests conducted.
During the vulnerability assessment, identification was necessarily defined according to the existence of vulnerability. Value 1 means it had vulnerability and conversely value 0 means it did not have any vulnerability. Further identification of the risk was represented by the threat (Threat = T) which was likely to occur, through the same identifying manner, which value 1 was given for having a threat, and zero value for the absence of threat. Described in the following formula (2), (3) for a total expectation of vulnerability and threat, and for the number of events was the possibility of the value of V and T as in formula (4).
Vi 1,0 i, i 1,2,..., n.
V (2)
Tj 1,0 j, j 1,2,..., m.T (3)
v T v T, ) .
(
(4)
With probability threat and vulnerability:
T: v = 1:1, means that one threat occurrence was caused by one vulnerability. T: v = 1: ~, means one threat occurrence caused by several vulnerabilities.
Risk could be assessed more objectively by the means of quantitative evaluation using weighing approach. It was determined and considered by experience basis, which the estimation of this assessment was usually based on certain management policy of organization. The following formula (5) was the amount of risk could be calculated objectively with specific values:
i
w
Low
( )
0.1Medium
( )
0.5High
( )
1ì
í
ï
îï
TWR
=
L
ijW
iV
ii=i n
å
j=1 m
å
(5)The third step was risk assessment, which analyzed the existing assets, and to plan an assessment to the identified assets. Then it was associated with the possibility of incidents, threats, vulnerabilities nature, and limitation of the needs and capabilities of the organization. Afterwards, the result which reflects the quantitative value was used as a means of consideration whether to accept or manage the risk. In other words, comparison could be conducted by comparing the loss of assets S (a) and the value of the security requirements that could be overcomeS(), which at most had the same maximum values.
Through the similar identification method in the 2nd step, whether the solution addresses business issue could be measured, which the value of 1 indicated that the right solution was implemented, value of 0 indicated the contrary, and value of -1 indicated that the solution even created another new issue. Done preparing set of items through formula (6), score weighing was performed to find the precision of solution to the threat emerged. Formula (7) was a process to fulfill CIA requirements in the system network security.
S
=
{ }
S
l=
{ }
1, 0
"
l
,
l
=
1, 2,...,
k
.
(6)=
S(a) S() (7)
The fourth step was business impact analysis which analyzed from business continuity perspective of an organization. Consideration performed on this step was done by conforming itself to the organization capabilities in term of financial, time, psychology, etc. When looking company business, total financial loss should be calculated through analysis of sensitivity and critical asset level. In order to measure such thing, assumption regarding possible value should be made in regards to asset value, expected security level, and whether the new asset requirement could overcome business issue from the risk aspect. This was a precise question leading to disharmony and subjectivity in risk. This topic was stated in the formula (8), with assumption of having 4 costs variables and it was then summed to cost of right solution resulted from formula (9).
i l i l i l i l i l li v creates direcly S if v creates indirecly S if match t don v and S if v addresses indirectly S if v addresses S if Z 1 5 , 0 ' 0 5 , 0 1
C
i=
C
nn=1 4
TC
=
C
lS
l:
C
l>
0,
"
l C
( )
ll=1
k
å
ì
í
ï
îï
ü
ý
ï
þï
(9)Figure 2. Risk Activity Model
Forth, risk management activity saw the benefit of this consideration by evaluating if the means was able to reduce financial loss or on the contrary it still needed to continue the identification and performed ongoing change by making revisions. Referring to matrix table created, a risk formula derived from all preceding formula aboves(1-9) could be formed in to risk form (R) like formula (10). Problems found should be identified from vulnerability, threat, and best minimal possible solution, which correlated to cost and risk in formula (11). This issue was bounded by other risk parameters.
R= TWR- Lji
i=1
n
å
j- 1
m
å
l=1
k
å
lizliSlì
í
ï
îï
ü
ý
ï
þï (10)
R
=
r
.
L
=
T
.
v
.
[ ]
L
(11)min
S l
TC
,
R
[
]
(12)Where strategy expectation design parameter risk:
L
max The maximum time of incident causing loss was still acceptable to theorganization
R
min The minimum reasonable risk value to organizationThe fifth step was risk determination, which analyzed the total loss aroused, controlled in many ways to reduce the occurrence of losses that was sorted by priority to avoid the worst possible loss. This can be achieved after enduring some considerations on the 4 previous steps. Finally, risk assessment result (R) that may appear with total loss (L) that may occur can be acquired.
Looking at the exposure of 5 steps above, certain level of risk within an organization could be perceived. This result could serve as a consideration factor on the next step to protect organization from the possible worst risk. Afterwards, activity controlling and evaluating current asset used to run business was done continously and unceasedly by utilizing the most effective and efficient solution using below financial formula:
c
R R
B 0 (13)
ROI =B- C
C (14)
NPV = Bt- Ct
1+i
( )
t t- 0n
å (15)
B
t-
C
t1
+
IRR
(
)
tt=0 n
å
=
0
(16)The sixth step discussed the control recommendations, which oversaw the benefit gained compared to the cost incurred. It was followed by evaluation to find whether what was done was able to give benefit and contribution when the risk occurs, or adding new problem instead.
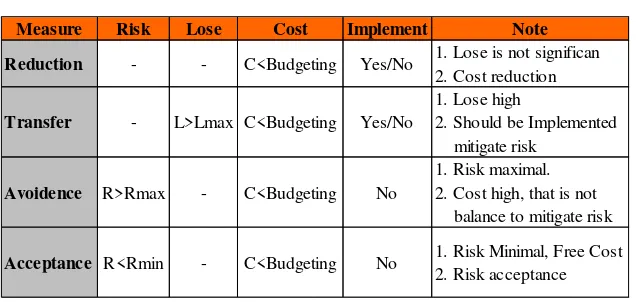
Table 2. Risk Assessment
Measure Risk Lose Cost Implement Note
Reduction - - C<Budgeting Yes/No 1. Lose is not significan 2. Cost reduction
Transfer - L>Lmax C<Budgeting Yes/No
1. Lose high
2. Should be Implemented mitigate risk
Avoidence R>Rmax - C<Budgeting No
1. Risk maximal. 2. Cost high, that is not balance to mitigate risk
Acceptance R<Rmin - C<Budgeting No 1. Risk Minimal, Free Cost 2. Risk acceptance
Table 2 showed qualitative logic in order to understand about the expectation of company regarding R (risk), L (lose) and C (cost). As shown in Table 2, the next step could be prepared when doing implementation. Because of the cost that will incur, which would be discussed thoroughly later on, quantitative calculation could be done in advance by evaluating model to cost (c) and benefit (B). In other words, it was comparing benefit gained and cost incurring.
step an organization protected itself from potential attack by providing security anticipation that could be classified into 3 categories impacting the risk(R), probability, and loss (L) variables.
The steps above recommended early check to identify risks that might occur in the future day during certain period as soon as possible. The quicker risk identification was performed, the quicker possibility of loss or damage which sometimes leads to worsen situation or financial loss would be recognized.
5.
Result
To easily understand the use of created model, here, a simple scenario sample was given so that directions might be obtained when developing quantitative calculation to reduce the risk in the network related to business and financial of the company.
Initially, the implementation process of that scenario was mapped to the model created. On the telecommunication network, specifically internet service, the key was to keep the service up and running. It was sought by keeping the CIA in maximum possible way for the network built of software and hardware. In Table 3, the use of formula (1), (2), and (3) to determine vulnerability related to threat could be observed.
Table 3. Vulnerability Assessment
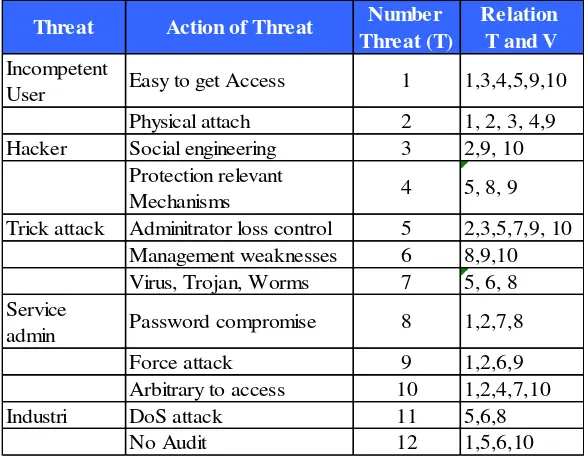
Table 4. Mapping of Vulnerability and Threat
Threat Action of Threat Number
Threat (T)
Relation T and V
Incompetent
User Easy to get Access 1 1,3,4,5,9,10
Physical attach 2 1, 2, 3, 4,9
Hacker Social engineering 3 2,9, 10
Protection relevant
Mechanisms 4 5, 8, 9
Trick attack Adminitrator loss control 5 2,3,5,7,9, 10
Management weaknesses 6 8,9,10
Virus, Trojan, Worms 7 5, 6, 8
Service
admin Password compromise 8 1,2,7,8
Force attack 9 1,2,6,9
Arbitrary to access 10 1,2,4,7,10
Industri DoS attack 11 5,6,8
No Audit 12 1,5,6,10
Number
(V) Vulnerability (V)
Impact to (CIA)
Forth, associated with possible threat as shown in Table 4 (Mapping of Vulnerability and Threat) and formula (4), vulnerability matrix was developed by mapping based on Table 3 and Table 4 so that weighing score, minimum(0.1), medium(0,5), maximum (1), could be assigned.
Here, in Table 5, was the result of mapping in the assessment weighing.
Table 5. Matrix Vulnerability and Threat
T * V 1 2 3 4 5 6 7 8 9 10
1 0.5 0 0.1 0.1 0.5 0 0 0 0.5 0.1
2 1 0.5 0.1 0.1 0 0 0 0 0.1 0
3 0 1 0 0 0 0 0 0 0.5 0.1
4 0 0 0 0 0.1 0 0 0.5 0.5 0
5 0 0.5 0.1 0 0.5 0 0.1 0 0.1 0.5
6 0 0 0 0 0 0 0 0.5 0.1 1
7 0 0 0 0 1 0.1 0 0.1 0 0
8 1 0.5 0 0 0 0 0.1 0.1 0 0
9 0.5 0.1 0 0 0 0.1 0 0 1 0
10 0.1 0.5 0 0.5 0 0 0.1 0 0 1
11 0 0 0 0 0.5 0.5 0 0.5 0 0
12 0.1 0 0 0 0.5 0.5 0 0 0 1
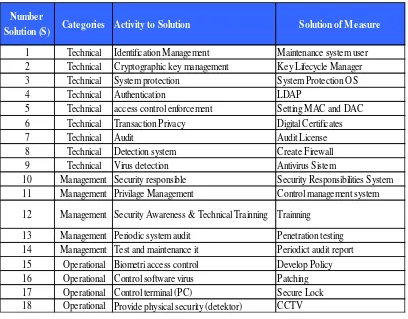
In determining the level of security, step to be taken was to analyze the precision of solution which could be distinguished into 3 categories, described in NIST-SP800, ISO 1799, and ISO 27001/27001, which were operation, management and technical. Table 6 showed information regarding this.
Table 6. Mapping Solution
Number
Solution (S) Categories Activity to Solution Solution of Measure
1 Technical Identification Management Maintenance system user 2 Technical Cryptographic key management Key Lifecycle Manager 3 Technical System protection System Protection OS
4 Technical Authentication LDAP
5 Technical access control enforcement Setting MAC and DAC 6 Technical Transaction Privacy Digital Certificates
7 Technical Audit Audit License
8 Technical Detection system Create Firewall 9 Technical Virus detection Antivirus Sistem
10 Management Security responsible Security Responsibilities System 11 Management Privilage Management Control management system
12 Management Security Awareness & Technical Trainning Trainning
Before moving to the next step, score weighing should be done first to assess the accuracy of solution to the existing vulnerabilities, as mapped in Table 7. The next step would make assumption about cost spending for overcoming the vulnerability and threat which were associated according to the step taken in fourth model, specifically formula (9) and (10). Hence the total cost could be calculated as shown in Table 7.
Table 7. Mapping Solution Matrix
S * V 1 2 3 4 5 6 7 8 9 10 Medium
1 1 -0.5 0.5 0 0.5 0 -0.5 0 -0.5 -0.5 0.25
2 0 -0.5 0.5 -0.5 0 0 0 0.5 0.5 -0.5 0.15
3 -0.5 -1 1 1 0 0 1 0.5 0.5 1 0.58
4 1 0 0.5 0 0.5 0 0.5 -0.5 -0.5 0.5 0.25
5 0 -0.5 0.5 0 0.5 0 1 1 0 0 0.28
6 0.5 -0.5 0.5 0 0.5 -0.5 0 0 -0.5 -0.5 0.18
7 0.5 0.5 0.5 0.5 1 0.5 0.5 0.5 1 0.5 0.40
8 0.5 -0.5 0 0 0.5 0 0.5 1 0.5 0.5 0.25
9 0 0 0 0.5 1 0.5 0.5 0 0 0 0.18
10 0 0.5 0 0 0 0 0.5 0 0 1 0.15
11 0 0.5 0.5 0 0 0 0 0 0.5 0 0.08
12 1 1 0.5 0.5 0.5 0.5 1 1 1 1 0.70
13 0.5 -0.5 1 0.5 0.5 0.5 0.5 1 1 0.5 0.48
14 1 1 0.5 0.5 1 0.5 0.5 0.5 0.5 0.5 0.48
15 -0.5 -0.5 0 0 0 0 0 0 0 0 0.05
16 0 0 0 0 1 0.5 0 0 0.5 0 0.15
17 0 0 0.5 0 -0.5 0 0 0 0 0.5 0.08
18 -0.5 -1 0 0 0 0 0 0 0.5 0.5 0.18
Table 8. Total Cost
Number
Solution (S) Solution of Measure Operasional Man Power Budgeting Training
Total Cost ($)
1 Maintenance system user 2,500.00 25.00 2 Key Lifecycle Manager 3,180.00 31.80 3 System Protection OS 500.00 5.00 4 LDAP 100.00 1,500.00 250.00 18.50 5 Setting MAC and DAC 100.00 300.00 4.00 6 Digital Certificates 400.00 1,000.00 500.00 19.00 7 Audit License 100.00 155.00 300.00 5.55 8 Create Firewall 1,000.00 2,500.00 1,100.00 46.00 9 Antivirus Sistem 60.00 500.00 200.00 7.60 10 Security Responsibilities System 2,500.00 25.00 11 Control management system 1,000.00 10.00
12 Trainning 300.00 2,000.00 23.00
13 Penetration testing 1,000.00 5,000.00 60.00 14 Periodict audit report 150.00 1,000.00 11.50 15 Develop Policy 500.00 1,500.00 2,000.00 40.00 16 Patching 500.00 200.00 7.00 17 Secure Lock 500.00 1,000.00 500.00 20.00 18 CCTV 1,000.00 300.00 3,000.00 43.00 401.95
expectation. Subsequently, the decision making process, including policy development, was usually done through opinion survey spread to all stakeholders. This was to ensure that every decision made was accountable and consistent with the experience from every division which was operation, management and technical. At the end, decision could be made in more objective way as shown by the number in quantitative score. Hence, the weighing process was intended to convert the issue of experience from each division, which was a qualitative data, into quantitative component.
After getting the total cost for risk anticipation or reduction, it was also necessary to consider the benefit through total asset value prediction to make it calculable in financial aspect. Considerations taken into account were NPV, IRR, and ROI.
Usually, in order to predict the benefit gained, the maximum loss in one year was calculated along with how long it lasts (Lmax ). Additionally, financial risk that might occur if no action was given on the acknowledged risk should be taken into account as well with the certain discount rate according to company capability or equated to finance macro-economics.
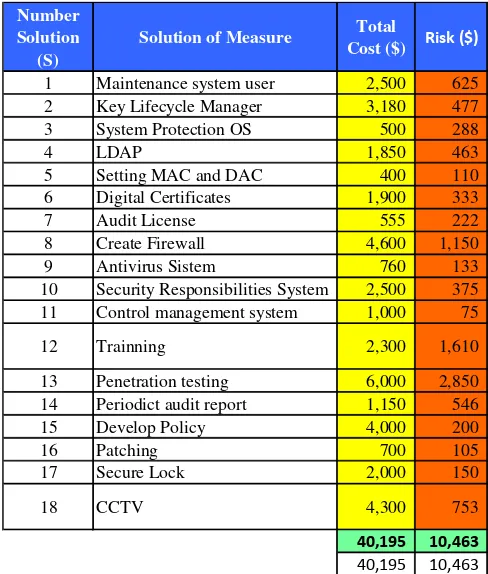
Table 9. Total Cost and Risk Assessment
Number Solution
(S)
Solution of Measure Total
Cost ($) Risk ($)
1 Maintenance system user 2,500 625 2 Key Lifecycle Manager 3,180 477 3 System Protection OS 500 288 4 LDAP 1,850 463 5 Setting MAC and DAC 400 110 6 Digital Certificates 1,900 333 7 Audit License 555 222 8 Create Firewall 4,600 1,150 9 Antivirus Sistem 760 133 10 Security Responsibilities System 2,500 375 11 Control management system 1,000 75 12 Trainning 2,300 1,610 13 Penetration testing 6,000 2,850 14 Periodict audit report 1,150 546 15 Develop Policy 4,000 200 16 Patching 700 105 17 Secure Lock 2,000 150 18 CCTV 4,300 753
40,195
10,463
40,195
10,463
Table 10 exposed the result of the calculation; NPV= $51,723, IRR=60%, ROI=76.37%; with the following assumptions:
1. 15% discount corresponding to Bank standard on investment. 2. Operating costs are generally 30% of the investment value.
3. The length of implementation time which was 3 years assuming there were 5 occurrences every year (15 occurrences in total).
Above result spoke that $40,195 investment was more advantageous rather than accepting loss caused by each possible problem might be aroused in later days. The magnitude of these losses was proportional to value of NPV, IRR and ROI.
The final step was to look at the changes that occur if the number of assumed event affecting NPV, IRR, and ROI was changed. Thus, it could be concluded that when the less event occurrence happens, the prediction made in the beginning was not right. The investment undergone losses since it was intended to prevent risk yet actually there was no vulnerability or threat as assumed previously.
Table 10. Cost and Benefit Analysis
Discount Rate 15%
Cost 0 1 2 3
40,195
12,059 12,059 12,059 76,371
Discount rate 1 0.8696 0.7561 0.6575
PV 40,195 10,486 9,118 7,929 67,727
Benefit 0 1 2 3
0 52,316 52,316 52,316
Discount rate 1 0.8696 0.7561 0.6575
PV - 45,492 39,559 34,399 119,450 NPV Benefit Discounted benefit-cost - 40,195.00 35,006.74 30,440.64 26,470.12 60% IRR Cumulative benefit-cost - 40,195.00 - 5,188.26 25,252.38 51,722.51 $51,722.51 NPV
NPV $ 51,723
ROI 76.37%
IRR 60%
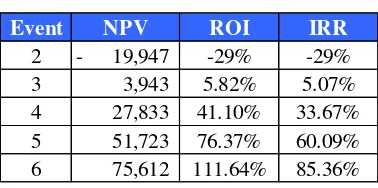
Contrarily, if all events assumed did occur, the greater the benefit was gained corresponding to the investment made for risk prevention. Table 11 showed the total event assumption which was 2, 3, 4, 5, and 6 on each year so the comparison between NPV, IRR and ROI could be seen.
Table 11. Financial Analysis
Event NPV ROI IRR 2 - 19,947 -29% -29% 3 3,943 5.82% 5.07% 4 27,833 41.10% 33.67% 5 51,723 76.37% 60.09% 6 75,612 111.64% 85.36%
Table 12 expressed the simulation of changing benefit (B) affected by every assumed event change. The more predicted event occurs, the more is the benefit gained while it also showed a pertinence in doing threat and vulnerability analysis. This could be measured by the gain value generated from the calculation process.
Hence, it was appeared that management' decision on investment could be analyzed through the drawing.
Table 12. Event, Benefit, and Cost Simulation
Payback
Period 0 1 2 3
TC 40,195 50,681 59,799 67,727
BENEFIT 2 - 18,197 34,020 47,780
BENEFIT 3 - 27,295 51,031 71,670
BENEFIT 4 - 36,394 68,041 95,560
BENEFIT 5 - 45,492 85,051 119,450
BENEFIT 6 - 54,591 102,061 143,340
Figure 3 was then showing a simulation result explaining that every change in event occurrence affecting the benefit. It was even proven that the less assumed incident occurs, the less benefit was gained. This implied that the investment decision to reduce the risk was not appropriate. Otherwise, the more incident event occurs, the more is benefit gained which imply that the investment decision for risk reduction was more than appropriate. In conclusion the number of risk incident occurrence was equal to the benefit value of security implementation which was invested by certain cost. It was visible on the event's curve line that each event simulation was as a linear curve reducing risk. Moreover, it did significantly emerge on this simulation that reduction process changedRmax Rmin . In addition, a linear change on number of event didn’t mean a linear risk reduction (Rmax Rmin ). Yet, risk reduction was acquired in the form of Markowitz risk curve (not linear).
Figure 3. Probability Event, Cost, and Benefit
Figure 3 provided recommendation on organization to undertake:
1. Reduction, as the risk Rmax Rmin was reduced, the company could continue to accept
2. Transfer, was performed when the accomplished time breaches the maximum threshold defined. On this simulation, it was expected that in maximum 3 years, risk reduction investment would return.
3. Avoidance, was performed when the meeting point Rmax and the value of the cost to do the anticipation of vulnerabilities and threats that had been assumed.
If it couldn’t be attained, no investment should be made to anticipate the risk.
On the next stage, it was important to do monitoring in regular basis so that risk management (preventive, corrective, detective action) could be done earlier. This was an implementation process and continuous improvement in organization which took finance and business continuity aspect into account.
6.
Conclusion
Our model showed the association between risk assessment related to security level and investment cost. This model could be derived into 16 mathematic formulas. These sixteen formulas were grouped and attained based on 7 steps, namely 1) system identification, 2) threat and risk identification, 3) risk assessment, 4) business impact analysis, 5) risk determination, 6) control recommendations and 7) implementation and continuous improvement. It was believed this model in this research could be utilized by company management as a policy in decision making when considering an investment for network security, specifically when they shared the same judgment on financial and business aspects. The simulation carried was a verification process done by author to ensure the validity of this research. After series of test done through the simulation, it could be concluded that the change in number of event occurrence can affect the security valuation, the less security value gained. This showed inappropriate investment as an effort to reduce risk as investment cost should be lower. And conversely, the more event occurrence appears, the more security value obtained. Hence, the precision in predicting risk reduction over the investment cost was getting better. In other words, the number of risk occurrence equal to the security value. Thus the authors believed that the model could be utilized in other enterprise risk management case to measure the security level associated to financial and business aspects.
7.
Discussion
This research had been done by making a model that could be used as a general reference for measuring network security level as an effort to reduce risk or financial loss in company. The research process had also been verified through simulation in mathematical quantitative derived to 16 formulas. Therefore, network security level could be measured from financial aspect in more objectives, effective and efficient manner. Methodology approach used on this study was RAOM (Risk Assessment and Optimization Model) Viduto et al., (2012) that is associated with the method of Gordon & Loeb by Yue et al., (2006) and Robust Technology by Titarenko (1997).
References
[1] A. Reggiani, “Network resilience for transport security: Some methodological considerations”, Transport Policy.
[2] B. Cho Kim and Y. Wan Park, “Security versus convenience? An experimental study of user misperceptions of wireless internet service quality”, Decision Support Systems, vol. 53, (2012), pp. 1-11. [3] C.-C. Lo and W.-J. Chen, “A hybrid information security risk assessment procedure considering
interdependences between controls”, Expert Systems with Applications, (39), (2012), pp. 247-257. [4] C. Harland, R. Brenchleyb and H. Walkera, “Risk in supply networks”, Journal of Purchasing & Supply
Management, vol. 9, (2003), pp. 51-62.
[5] C. Ioannidis, D. Pym and J. Williams, “Information security trade-offs and optimal patching policies”, European Journal of Operational Research, pp. 216, (2012), pp. 434–444.
[6] F. Hare and J. Goldstein, “The interdependent security problem in the defense industrial base: An agent-based model on a social network”, Critical Infrastructure Protection, vol. 3, (2010), pp. 218-319.
[7] ISO. 2005. IEC 27001:2005 Information technology - Security techniques Information security management systems - Requirements. In International Organization for Standardization.
[8] ISO/IEC. 2005. International Standard ISO/IEC 17799 Information technology - Security techniques - Code of practice for information security management. Switzerland: ISO/IEC.
[9] I. Cibrario Bertolotti, L. Durante, P. Maggi, R. Sisto and A. Valenzano, “Improving the security of industrial networks by means of formal verification”, Computer Standards & Interfaces, vol. 29, (2007), pp. 387-397.
[10] R. Carneiro Cavalcante, I. Ibert Bittencourt, A. Pedro da Silva, M. Silva, E. Costa and R. Santos, “A survey of security in multi-agent systems”, Expert Systems with Applications, vol. 39, (2012), pp. 4835-4846. [11] R. Bojanc, B. Jerman-Blazic and M. Tekavcic, “Managing the investment in information security
technology by use of a quantitative modeling”, Information Processing and Management, vol. 48, (2012), pp. 1031-1052.
[12] S. Rahimi and M. Zargham, “Analysis of the security of VPN configurations in industrial control environments”, Critical Infrastructure Protection, vol. 5, (2012), pp. 3-13.
[13] B. Soewito, L. Vespa, N. Weng and H. Wang, “Hybrid pattern matching for trusted intrusion detection”, Security and communication Network, vol. 4, (2009), pp. 33-43.
[14] B. P. Titarenko, “Robust Technology in Risk Management”, International Journal of Project Management, vol. 15, no. 1, (1997), pp. 11-14.
[15] V. Viduto, C. Maple, W. Huang and D. Lopez-Perez, “A novel risk assessment and optimisation model for a multi-objective network security countermeasure selection problem”, Decision Support Systems, vol. 53,
(2012), pp. 599-610.
[16] W. T. Yue, M. Cakanyildirim, Y. U. Ryu and D. Liu, “Network externalities, layered protection and IT security risk management”, Decision Support Systems, vol. 44, (2007), pp. 1-16.
[17] Y. Min Bae and Y. Hoon Lee, “Integrated framework of risk evaluation and risk allocation with bounded data”, Expert Systems with Applications, vol. 39, (2012), pp. 7853-7859.
Authors
Martin Suhartanaobtained his Master’s in Technology Information from University of Bina Nusantara in Jakarta in 2013. His research was focused on the technical risk management model including financial perspective.
Bens Pardamean currently holds a dual-appointment as the Head of the Bioinformatics Research Group and as an Associate Professor of Computer Science at the University of Bina Nusantara in Jakarta, Indonesia.