Uncovering Regional
Wealth
An Analysis of Budget Policies for
Land and Forest Governance in
Three Provinces and Six Districts in
Indonesia
Uncovering Regional
Wealth
An Analysis of Budget Policies for
Land and Forest Governance in
Three Provinces and Six Districts in
Indonesia
2013
Glossary
APBD : Local Government Budget
APBD-M : Local Government Budget-Original APBD-P : Local Government Budget-Amended APBD-R : Local Government Budget-Realised
BPK : State Audit Agency
BPS : Central Statistics Agency
DAK : Special Allocation Fund
DBH : Profit-Sharing Fund
DAU : General Allocation Fund
Daper : Balanced Fund
DJPK : Directorate General of Fiscal Balance
HD : Village Forest
HKm : Community Forest
HTR : Community Forest Plantation
Ha : Hectare
IUP : Mining Business Permit
IUPHHK-HA : Forest Timber Product Utilisation Permit – Natural Forest IUPHHK-HTI : Forest Timber Product Utilisation Permit – Industrial
Plantation Forest
IUPHHK-RE : Forest Timber Product Utilisation Permit
JATAM : Mining Advocacy Network
KP : Mining Authorisation
LKPD : Regional Government Financial Statement
LPDS : Other Revenue
LULUCF : Land Use, Land-Use Change and Forestry
Migas : Oil and Gas
MP3EI : Master Plan for the Acceleration and Expansion of Indonesia’s Economic Development
PAD : Regionally-Generated Revenue
PDRB : Gross Regional Domestic Product
RKPD : Regional Government Work Plan
RPJMD : Regional Mid-Term Development Plan
RTRW : Regional Spatial Plan
RTRWP : Provincial Spatial Plan
TKHL : Land and Forest Governance
SDA : Natural Resources
SiKPA : Budget Deficit
SiLPA : Budget Surplus
Table of Contents
PART I BUILDING AN ANALYTICAL FRAMEWORK FOR
REGIONAL BUDGET POLICIES ON LAND AND FOREST GOVERNANCE IN INDONESIA
PART II EXAMINING REGIONAL PLANNING POLICIES ON LAND
AND FOREST GOVERNANCE IN INDONESIA 8
2.1 Regional Authority Over Land and Forest
Governance ... 8 2.2 Natural Resource-Based Regional Economic
Structure ... 11 2.3 Exploitative Planning Policies in the Absence of an Adequate Recovery
Program ...
16 PART III REVIEWING REGIONAL BUDGETS: MEASURING
REGIONAL GOVERNMENT COMMITMENT AND
PARTIALITY TOWARD LAND AND FOREST GOVERNANCE 20
3.1 Overview of Regional
Revenue ... 20 3.2 Markdown Symptoms and Revenue
Politicisation ... 26 3.3 Overview of Regional
Spending ... 31 3.4 Low Budget Commitment for Land and Forest
Governance.. ... 35 3.5 Regional Financing and Fiscal
2... ...
List of Tables, Graphics, Diagrams and
Boxes
List of Tables
Table 1.1 - General Statistical Data Profile of Research
Areas... 5 Table 1.2 - Data Used and Source of
Data ... 6 Table 2.1 - Regional Planning Policies in Natural Resource Utilisation as a Basis for Regional Economic
Growth ...
... 9
Table 2.3 - Development of Forest Land Use Permits for Mining
Production/Exploitation...
... 13
Table 2.4 - Development of Mining Business Permits in East Kalimantan Province ...
13 Table 2.5 - Area of Oil Palm Regions by Province, 2008-2012
(Ha) ... 14
Table 2.6 - Area of Oil Palm Plantation
Regions ... 15 Table 2.7 - Plantation Development Plan in West Kalimantan
Province ... 15
Table 2.8 - Conflicts and Conflicting Companies in
2012 ... 16 Table 2.9 - Critical Land Area Growth in Three Provinces,
2007-2011 ...
16 Table 2.10 - Area of Production Forest Land
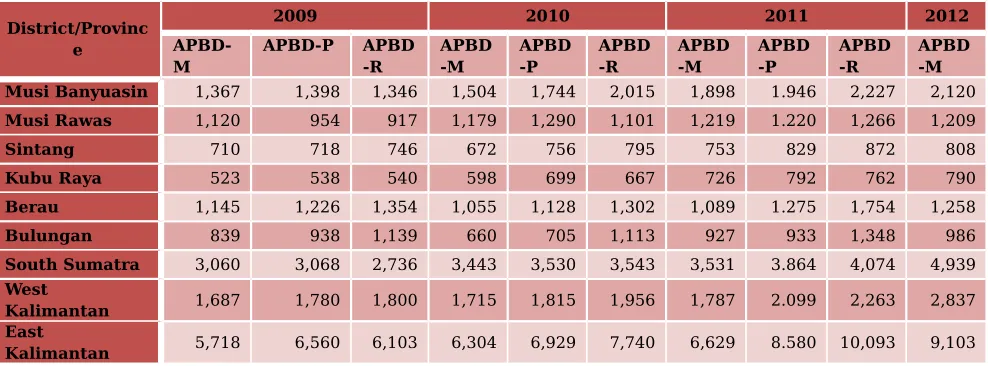
Utilised ... 17 Table 3.1 - Comparison of Original, Amended and Realised Revenues of
Provinces and Districts, 2009-2012, Based on Constant Price 2012 (Rp
Billiob) ... 28 Table 3.2 - Comparison of Original, Amended, and Realised Expenditure of Provinces and Districts, 2009-2012, Based on Constant Price 2012 (Rp
Billion) ... 31 Table 3.3 - Forestry and Land Function Expenditure per
Hectare ...
39 Table 3.4 - SiLPA of Current Budget Year and Its Ratio to Regional
Spending, East Kalimantan Province
2011 ...
... 46
Table of Appendix 1.1 – Management of Land and Forest Governance Functions in the Research
Areas... ... ...
57
Table of Appendix 1.2 - Division of Authority Between Government Levels in the Governance of Forestry, Mining and Plantation Affairs 59 List of Graphics
Graphic 2.1 - Growth in the Production of Petroleum, Natural Gas and Coal in South Sumatra and East Kalimantan Provinces, 2009-
Graphic 3.1 - District Revenue Composition,
2009-2012 ... 21 Graphic 3.2 - Provincial Revenue Composition,
2009-2012 ... ...
21 Graphic 3.3 - Provincial Balanced Fund Composition,
2009-2012 ... 22 Graphic 3.4 - District Balanced Fund Composition,
2009-2012 ... 22 Graphic 3.5 - Provincial DBH-SDA Composition,
2009-2011 ... 24 Graphic 3.6 - District-Level Natural Resources Profit-Sharing Fund
Composition, 2009-2012 ... 24
Graphic 3.7 - Budget Transfer and Realisation of Forestry Natural Resources,
2009-2011... ...
25
Graphic 3.8 - Provincial Revenue and Growth, 2009
-2012 ... 26 Graphic 3.9 - District-Level Revenue and Growth, 2009
2012 ... 27 Graphic 3.10 - Per Capita Regional Revenue,
2010 ... 28 Graphic 3.11 - DBH Per Capita and Its Ratio to Regional Revenue,
2009-2012 ...
29 Graphic 3.12 - Profit-Sharing Fund Trend Per Capita and Its Ratio to
Revenue,
2009-2011... ... ...
29
Graphic 3.13 - DBH SDA Revenue and Poverty Rate,
2010 ... 30 Graphic 3.14 - Provincial Expenditure and Growth, 2009
-2012 ... 31 Graphic 3.15 - District-Level Revenue and Growth, 2009
-2012 ...
32 Graphic 3.16 - District-Level Expenditure Composition,
2009-2012 ... 33
Graphic 3.17 - Provincial Expenditure Composition,
2009-2012 ... 35 Graphic 3.18 - District-Level Expenditure on Land and Forest Sector
Functions, 2009-2012 ... 36
Graphic 3.19 - Provincial Expenditure on Land and Forest Sector
Functions, 2009-2012 ... 36
Graphic 3.20 - Proportion of District-Level Forestry Functions to Regional Expenditure,
2009-2012 ... ...
37
Graphic 3.21 - Proportion of Provincial Forestry Functions to Regional
Expenditure, 2009-2012 38
Graphic 3.22 - Ratio of Expenditure on Forestry Functions to Forestry Balanced Fund,
2009-2012...
... 40
Graphic 3.23 - DBH SDA Contribution to Personnel Spending, 2011 ...
40 Graphic 3.24 - Expenditure on Spatial Zoning Functions, 2009
-2012 ... 41
Graphic 3.26 - Expenditure on Agricultural Functions, 2009
-2011 ... 43 Graphic 3.27 - Provincial Deficit/Surplus,
2009-2012 ...
45 Graphic 3.28 - Ratio of SiLPA to Provincial Spending,
2009-2011 ... 45 Graphic 3.29 - Provincial Real Fiscal Space Per Capita and Its Ratio to
Revenue, 2009-2012 ... 48
Graphic 3.30 - District Real Fiscal Space Per Capita and Its Ratio to
Revenue, 2009-2012... 49
List of Diagrams
Diagram 1.1 Framework of Research on Budget Policies in Land and
Forest Governance ... 4
Diagram 1.2 Analysis Scheme of Land and Forest Governance
Budget ... 7
List of Boxes
Box 2.1 Formation of Reclamation and Post-Mining Supervising Committee
in East Kalimantan 10
Box 3.1 Balanced Funds for Reducing Fiscal
Gap ... 23 Box 3.2 Budget Politics during APBD Amendment
Period ...
32 Box 3.3 Composition of
Spending ... 33 Box 3.4 Companies Failing to Deposit Reclamation Guarantee
Funds ... 42
Box 3.5 Food Estate Program in West Kalimantan
Province ... 44 Box 3.6 Methods of Corruption Using
SiLPA ... 46
Preface
In the name of transparency,
The SETAPAK program, which is funded by the United Kingdom Climate Change Unit (UKCCU), aims to improve land and forest governance in Indonesia to support the reduction of Indonesia’s greenhouse gas emissions. This study is part of that effort, as a monitoring instrument developed by civil society to assess and evaluate the process of land and forest governance from a budget perspective.
A budget can be used as an indicator to measure a regional government's commitment and efforts to improve land and forest governance. Most regional revenue is derived from the Natural Resources Profit-Sharing Fund (DBH – SDA), however, policy redistribution through regional spending is mostly allocated for those programs beyond the coverage of environmental sustainability issues.
Regional revenue policies that rely on natural resources as their greatest source of revenue will result in an increase in land and forest-based industrial activities. In addition, in the era of decentralisation, there is the phenomenon of so-called “rich regions”, with a connotation of those regions successfully managing, utilising and exploiting their petroleum, coal and forest reserves, thus providing them with a great amount of Profit-Sharing Funds each year. In the last four years (2009-2012), the government sectors of forestry, spatial zoning and the environment at the provincial and district levels each received an allocation of only 1 percent on average of the total regional expenditure. This allocation is far smaller than the expenditure on social assistance and grants, with these figures reaching more than 10 percent.
Improving budget policy will play a very strategic role in improving the quality of land and forest governance in Indonesia. A responsive revenue policy will contribute to the prevention of excessive exploitation of natural resources. An efficient, effective and appropriately targeted expenditure policy will support attempts to prevent deforestation, promote forest land rehabilitation, and prevent exploitation and optimisation of plantation production, thereby avoiding any possible new land openings within forest areas.
In drafting this report, we want to express our gratitude and highest appreciation to UKCCU for its support of the SETAPAK program, including this particular study. We would also like to thank the national and local level researchers for their hard work in obtaining and analysing the data. We hope that this study can be useful in improving land and forest governance in Indonesia.
Jakarta, December 2013
Yenny Sucipto Secretary General Seknas FITRA
Blair Palmer
Environmental Governance Program Director
The Asia Foundation
Acknowledgments
This report is the result of cooperation between Seknas FITRA and The Asia Foundation. The Seknas FITRA team was coordinated by Hadi Prayitno and its members included Ahmad Taufik and Rizka Fitriyani. The Asia Foundation team was coordinated by Blair Palmer with members including R. Alam Surya Putra and Ade Cahyat.
This report was prepared based on the results of field research conducted by local researchers from about 10 civil society organisations, comprising:
South Sumatra : Nunik Handayani, Eli Mailiana, Sumarni (FITRA South Sumatra), Basyir, Anton (Wahana Bumi Hijau), Ade Ramayeni, Yogi (Pilar Nusantara);
West Kalimantan : Liem Keng Sia, Didik Supriyatno, Ngusmanto (Fakta), Yongky Yob Yosafat, Fredy Dulhadi (Jari Borneo Barat), Endang Kusmiyati, Dea Ishadi (Titian);
East Kalimantan : Ramlianur, Buyung Marajo, Burhanuddin (Pokja 30).
The analysis and report drafting processes were performed jointly by Hadi Prayitno, Ahmad Taufik and Rizka Fitriyani (Seknas FITRA), and R. Alam Surya Putra (The Asia Foundation). Finally, it was edited by R. Alam Surya Putra.
We would also like to thank Blair Palmer, Erman Rahman, Frans Siahaan, Prayekti Murharjanti, Ridwan and Chitra Hariyadi who gave their reviews, feedback and criticism on this report. Dorta Pardede and Kiki Tobing also contributed much to its printing and publication.
This report was undertaken with the support of the United Kingdom Climate Change Unit (UKCCU). However, the opinions, findings, interpretations and conclusions in this report are solely the views of civil groups and do not represent the views of The Asia Foundation or UKCCU.
Part I
Building an Analytical Framework for
Regional Budget Policies on Land and
Forest Governance in Indonesia
1.1Introduction
Decentralisation has created new challenges for the management of natural resources and the environment in the regions. Decentralisation depends on the varied capacities of regional leaders with all kinds of interests in managing natural resources and human activity. The World Bank holds the view that the varied capacities and institutional visions of the regions are some of the main challenges faced in the decentralisation era, as well as the appropriate use of incentives, and a minimum of standards, enforcement and assistance from the central government.1
Corruption is another important challenge faced by Indonesia under decentralisation. The numerous corruption cases involving officials at the regional level indicate that the center of corrupt practices has moved along with the greater authority given to regional governments. The Center for International Forestry Research (CIFOR) suggests that the problem of corruption in the natural resources sector (particularly in the misuse of reforestation funds) has become more decentralised during the post-Suharto period since provincial and district-level governments in Indonesia have received an increased level of authority to manage their forestry revenue.2 The natural resources sector is considered a part of this era's failure to manage and allocate said resources in an optimal manner for the public good. In this context, land and forests serve as a source of both formal and informal revenue for the government as well as for other parties whose interests lie beyond the government’s. In addition to the misuse of reforestation funds, corruption related to natural resources occurs through the release of land, the issuance of business permits to the private sector, and the conversion of forests.3
Deforestation and degradation problems that the Indonesian government must confront. This is not just because the Indonesian government has made a commitment to the international community to mitigate its rate of emissions, but also because deforestation in many cases has eliminated a source of public income. Many studies4 even suggest that the challenges the Indonesian government has to face have become increasingly difficult, since most deforestation is related to corrupt political and economic systems that consider natural resources, and land and forests in particular, as a source of revenue to be exploited for both political and personal gain.
1 World Bank, Country Environmental Assessment, Investing in a More Sustainable Indonesia, 2009.
2 CIFOR, Tata Kelola Keuangan dan Dana Reboisasi selama Periode Soeharto dan Paska Soeharto 1998 – 2009, 2011.
3 Setengah Hati Berantas Kejahatan Kehutanan, Indonesia Corruption Watch, 2012
As a part of the political and economic systems, land and forest governance must be continuously monitored by several parties. Similar research should be conducted constantly in order to generate recommendations and feed massive public debate to promote improvement to governance as soon as possible. In addition to looking at what policy packages, programs and activities the government makes available, another approach to examining the government's commitment is to use a budget instrument, that is, to examine to what extent government revenue and expenditure are utilised to reduce the rate of deforestation. This approach deals with the question of whether the budget policy the government develops actually decreases or increases the rate of deforestation in Indonesia. In other words, analysis of budget management is an instrument that can provide feedback on land and forest governance in Indonesia. This study is an attempt to answer that question.
This study aimed to analyse budgeting policies at the regional level regarding land and forest governance in Indonesia. Three (3) provinces and six (6) regencies were reviewed in this study, considering to what extent planning and budgeting policies at the regional level provide useful contributions toward improving land and forest governance. In particular, the study aimed to analyse two issues: firstly, it reviewed the potential and realised regional revenue from land and forest governance, and secondly, it examined the orientation of regional expenditure policies in accelerating improvements to land and forest governance. Unlike the budget study conducted at the national level, which reviewed the consistency of existing planning policies and their relevance to budget policies, this study only reviewed how the budget policies were managed in order to support the objective of mitigating deforestation and forest degradation, which contributes directly to emission mitigation.
As part of a monitoring instrument, this study was developed by civil society groups to review and evaluate the land and forest governance process in Indonesia within the framework of budget policy. This study was developed by a civil society network experienced in reviewing the policies of budget management in various government sectors. Seknas FITRA coordinated this study with the support of ten (10) civil group networks in the regions. Within the last five years, Seknas FITRA has intensively reviewed APBD budgets in 72 districts/municipalities and seven provinces, though the sectors or functions under review until now have mostly been education, healthcare and infrastructure.
governments in particular, this research is expected to provide useful feedback for strengthening government roles in evaluating, supervising and providing technical assistance to district-level governments. For other parties, the study is expected to serve as feedback for a broader dialogue on policy and to generate better public debate in order to improve policy.
1.2Research Framework
The research framework used in this study is similar to that for analysing national budget policy on land and forest governance. In
previous studies5 it has already been mentioned that budgets can be used as
analytic instruments to examine a government's performance in land and forest governance. The budget as an instrument can also be used to assess the government's level of commitment or concern for managing its natural resources in a wise and fair manner. However, what makes this study different is that it gives less consideration to planning policy as a comparative instrument in budget policy analysis. The national budget study only evaluates one government entity, that is, the central government, hence making it possible to evaluate the suitability of planning policies and budget policies. Meanwhile, the study of regional budgets looks at the tendencies of regional governments, as represented by three (3) provinces and six (6) regencies in research areas, in managing their general budget policy for land and forest governance. Therefore, it is not possible to correlate the findings with policy planning analysis.
Several issues below serve as the basic assumptions used as a frame of thought and analysis in the study of budget policy at both the national and regional levels:
The budget (either the APBN or APBD) is an important instrument for the government to implement its programs. The adequacy of the government budget in financing its programs is mostly affected by the way the budget is managed.
The government's budget is a reflection of political decisions
between the executive and legislative branches that indicates what the government does each year. This political decision has widespread impacts, not only on the quality of life for citizens, but also on the way the government allocates existing resources to fulfill its programming requirements. Therefore, this political decision reflects the extent of the government’s concern for its people and the environment.
Budget policies are closely related to land and forest governance. In addition to serving as an instrument of regional revenue, land and forest governance is also an instrument of regional spending and financing.
o As a revenue instrument, land and forest governance is seen as an incentive policy through taxes and royalties the government withdraws for activities related to the land and forest sector. However, incentive policies through taxes and royalties might lead to an increase in deforestation and forest degradation and/or,
5 See Measuring Commitment: An Analysis of the National Budget and Planning Policies on Land and Forest Governance in Indonesia, 2013, Seknas FITRA – The Asia Foundation, Jakarta.
conversely, a decrease in deforestation and forest degradation. The political decision to determine the sources of state revenue reflects the extent to which the government is committed to increasing or decreasing deforestation and forest degradation.
o In terms of regional spending, this deals with the extent to which government money will be spent on those programs and activities supporting development goals. In particular, it ensures that there is an adequate budget available to finance programs and activities supporting the mitigation of deforestation and forest degradation. Additionally, it ensures that an allotted amount of money is spent in an optimal manner to achieve the objective of mitigating deforestation and forest degradation.
o Financing is oriented toward the extent to which government money is invested in green-growth development or in non-green-growth development. Ensuring that the money that is available supports green-growth development through optimisation of the budget is critical to the fulfillment of the state funding scheme.
Below is a diagram of the effect of budget policies on land and forest governance employed as the framework of this research.
Diagram 1.1 Framework of Research on Budget Policies in Land and Forest Governance
1.3Research Methodology
a. Scope of Analysis
This study focused on general analysis budget management and specific analysis of budgets for the land and forest sector. The general analysis includes the profile and tendencies of budget revenue, expenditure and financing. The sectoral analysis, in essence, focuses on spending on programs that are expected to contribute to efforts toward reducing the rates of deforestation and forest degradation. This sectoral analysis focuses on forestry, agriculture, spatial zoning and the environment (LH), as well as energy and mineral resources (ESDM).
Six districts in three provinces were reviewed. These six districts and three provinces are the areas studied under the SETAPAK program6 of which Seknas FITRA is a partner. In the SETAPAK program, the provinces and districts were selected based on the condition of their forests and the availability of peatland and forest coverage, their regional socio-political conditions, and the availability of other supporting capacities such as civil society and infrastructure accessibility. The locations of the study include the province of South Sumatra with its Musi Banyuasin and Musi Rawas districts under review, East Kalimantan
6 SETAPAK (Selamatkan Hutan dan Lahan melalui Perbaikan Tata Kelola, or Save Land and Forests through Improved Governance) is one of The Asia Foundation's programs supported by UK Climate Change Unit (UKCCU). This program aims to support the Indonesian government’s efforts, and that of regional
governments in particular, to improve sustainable management in land and forest governance. This program commenced at the end of 2011 and it is planned to wrap up in mid-2015.
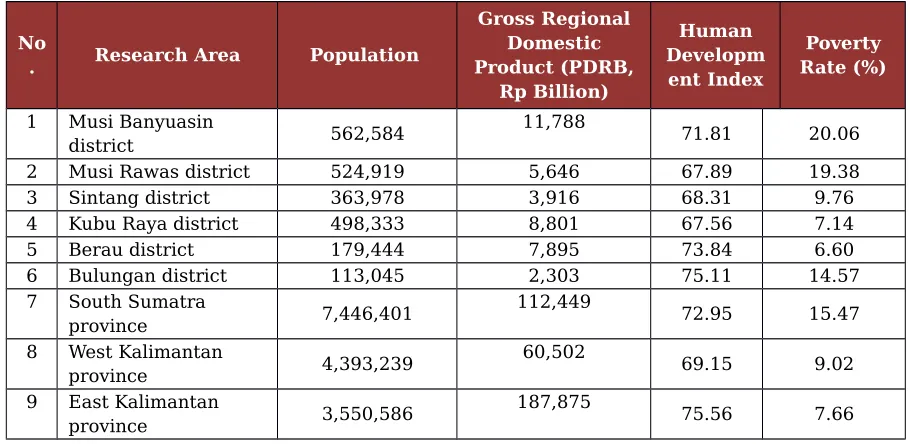
province with its Berau and Bulungan districts7 under review and West Kalimantan province with its Sintang and Kubu Raya districts under review. Table 1.1 below is shows the nine regions participating in the SETAPAK program, which also serve as the research areas for this study.
Table 1.1 General Statistical Data Profile of Research Areas
No
2 Musi Rawas district 524,919 5,646 67.89 19.38
3 Sintang district 363,978 3,916 68.31 9.76
4 Kubu Raya district 498,333 8,801 67.56 7.14
5 Berau district 179,444 7,895 73.84 6.60
6 Bulungan district 113,045 2,303 75.11 14.57 7 South Sumatra
Source: Central Statistics Agency/BPS (Population Census Results 2010 and PDRB Statistics 2009), National Team for the Acceleration of Tackling Poverty/TNP2K (IPM 2010, Poverty Levels 2010)
Notes: PDRB does not include oil and gas, based on the prices in effect as of 2010
The Regional Revenue and Expenditure Budget (APBD) data under analysis includes budgets from 2009-2012. The 2009-2011 APBD data use the original budget (APBD-M), amended budget (APBD-P) and realised budget (APBD-R), while for 2012, they use a budget plan (APBD-M or ‘original’). In addition to the budget data, the analysis also uses the latest supplemental statistical data, from both regional governments and various institutions of the central government.
b. Data Collection Technique
APBD data and sectoral statistical data was collected at the regional and national levels. APBD data was collected by the team of researchers and research assistants in their respective areas, using both formal and informal access. Additionally, APBD data was obtained by national researchers (Seknas FITRA) from the Finance Ministry through the Directorate General of Fiscal Balance (DJPK). Both the researchers and their assistants received prior training on the reading of budget data, data collection techniques and analysis for the purposes of this study.
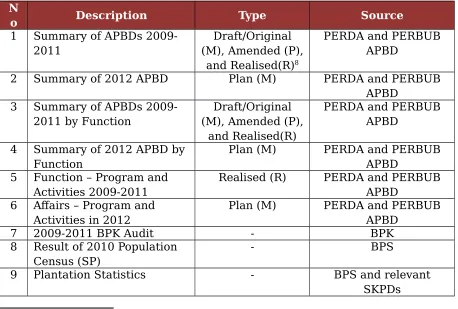
Table 1.2 Data Used and Source of Data
N
o Description Type Source
1 Summary of APBDs 2009-2011
Draft/Original (M), Amended (P),
and Realised(R)8
PERDA and PERBUB APBD
2 Summary of 2012 APBD Plan (M) PERDA and PERBUB
APBD 3 Summary of APBDs
2009-2011 by Function
Draft/Original (M), Amended (P),
and Realised(R)
PERDA and PERBUB APBD
4 Summary of 2012 APBD by Function
Plan (M) PERDA and PERBUB
APBD 5 Function – Program and
Activities 2009-2011
Realised (R) PERDA and PERBUB APBD
6 Affairs – Program and Activities in 2012
Plan (M) PERDA and PERBUB
APBD
7 2009-2011 BPK Audit - BPK
8 Result of 2010 Population Census (SP)
- BPS
9 Plantation Statistics - BPS and relevant
SKPDs
10 Forestry Statistics - BPS and relevant SKPDs
11 Mining Statistics - BPS and relevant
SKPDs
12 Other Statistics - BPS
The data were processed in stages, including data input, cleaning, compilation, analysis and interpretation. The regional data input was performed by regional researchers and the national data input by the Seknas FITRA team. All data was compiled by area and year, and verified by cross-checkingagainst other sources, before being analysed and interpreted.
c. Data Analysis
Budget policies were analysed by examining trends, proportions and correlations. This type of analysis has been employed by Seknas FITRA in its study of previous budgets.9 Below is the scheme of data analysis employed in the current research.
9 Regional Budget Analysis: Study of 2008-2011 APBD in 20 districts/municipalities in four provinces, Seknas FITRA, 2012: 4
Diagram 1.2 Scheme for Analysing Land and Forest Governance Budgets
Analysis of land and forest governance at the regional level focused on five functions. These five functions were forestry, mining, environment,
agriculture and spatial zoning. Each region has its own scheme to manage these five functions. Some combine several functions into one to enable management under one department and others assign some functions to their own
departments. Appendix 1 describes the table on management of functions of the district- and provincial-level governments under study.
Part II
Examining Regional Planning Policies on
Land and Forest Governance in Indonesia
2.1 Regional Authority Over Land and Forest Governance
Decentralisation has brought changes to the way natural resources are managed in Indonesia. Currently, regional governments assign different values to regional revenue depending on the types and quantities of natural resources found in the area. The amount of regional revenue is obtained from a Profit-Sharing Fund (DBH) as jointly managed by the central government. This state of affairs has given rise to a dichotomy in regional wealth in the decentralisation era. So-called “rich” regions tend to be associated with the natural resources they have in their possession, while regions with minimum natural resources and less fertile lands are frequently referred to as “poor” regions. Therefore, during the decentralisation era natural resources have been an important factor in the sustainability of a region's governance.
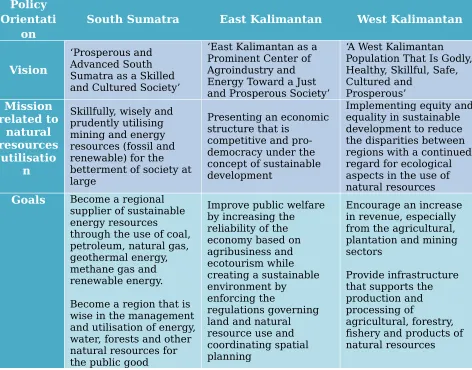
Decentralisation has also led to important changes in the authority over managing natural resources. Regional governments have a good deal of authority in utilising their natural resources, including to ensure that there have been efforts made to recover damaged natural resources. Although the authority over forestry function currently lies with the central government, regional governments are still involved in monitoring. The redistribution of authority over natural resource management presents regional governments with new challenges. In other words, the survival of natural resources relies on local leadership, along with its capabilities and capacities. Whether natural resources are being managed well or not is reflected in the regional vision and mission. Planning policies in the research areas tended to be exploitative of natural resources, while promising the concept of sustainable development. The planning documents of the three provinces clearly describe natural resources as something that must be utilised optimally for development purposes, using the jargon of social welfare. The development plans of West Kalimantan province explicitly promote the increase of regional revenue from the land and forest sectors. The provinces of East Kalimantan and South Sumatra are the same. Their development plans are oriented toward the utilisation of natural resources to their maximum potential. The development of one million hectares of oil palm land in East Kalimantan, and development of South Sumatra into a supplier of energy through the utilisation of land show how local leaders tend to manage their natural resources.
These regional planning policies pose a serious threat to deforestation and land and forest degradation. Even the World Bank (2009) has mentioned that natural resources in Indonesia are rapidly dwindling without being offset by a proportionate amount of investments in production or human resources, which has led to large-scale economic loss; as a result the cost of environmental
damage will tend to rise in the future. Currently, the cost of environmental damage is equal to the the average annual growth rate of environmental damage.10
Table 2.1 Regional Planning Policies on Natural Resource Utilisation as a
Basis for Regional Economic Growth
Policy Orientati
on
South Sumatra East Kalimantan West Kalimantan
Vision through the use of coal, petroleum, natural gas, geothermal energy, methane gas and renewable energy.
Become a region that is wise in the management
Programs Food Storage Barn
Source: RPJMD and RKPD (2013) of each region
Aside from provincial governments, district-level governments also appear to be in a race to utilise their natural resources. District-level governments in possession of natural resources have clearly made these sectors the basis of their economic growth. An example is Musi Rawas district, which has established its local vision for the 2011-2015 period as “Presenting the Agropolitan Earth and Mining
Zone For Musi Rawas
Darussalam”. One of its missions is to develop its mining and environment
sectors. Other districts have established similar visions and missions, such as the districts of Musi Banyuasin, Bulungan and Berau.
Authority over land and forest governance is still chaotic because it is not balanced by effective monitoring. The authority over mining and plantation affairs has been transferred to regional governments. In general, this transfer of authority from the central government to regional governments has been responded to by an increase in the issuance of business permits for mining and plantations, particularly oil palm plantations. Meanwhile, the authority of the central government to monitor regional authority is inadequate. Although the exact number of mining inspectors and civil servant investigators (PPNS) both at the national and regional levels is not known, it can be assumed to be inadequate for the task of monitoring land and forests.11 The central government has not established any scheme to optimally monitor forest damage resulting 11 Jatam data (2013) suggests that the ratio of mining inspectors to the number of companies and areas under monitoring is very low. Samarinda municipality, for example, has only four mining inspectors with a ratio of monitoring around 1 : 26 companies and 1 : 12,500 Ha. This means that one mining inspector is responsible for monitoring about 26 companies operating over 12,500 Ha. Furthermore, monitoring can only be carried out once a year due to a limited budget. Meanwhile, in East Kutai, the ratio reach to 1 : 19 companies over 330,000 Ha, with only two mining inspectors. (KOMPPAK, 2013: Menyediakan Taring bagi Macan yang prompted the Regional Representatives Council (DPRD) to initiate the issuance of a regional regulation (Perda) on Conducting Reclamation and Post-Mining Operations. In this regulation, there is a mandate for provincial governments to form a Monitoring
from mining and plantation activities. The limited number of supervisory resources for mining activities has been a serious consideration of the provincial government of East Kalimantan as indicated by its action of issuing regional regulations (Perda) on reclamation and post-mining operations.12
Meanwhile, in forestry affairs, it is still the central government that controls forest resource management. The role played by regional governments is to execute the central government’s policies by maximising monitoring of forest utilisation, for which permits have been issued by the central government, as well as to help the central government in planning activities to demarcate forest land boundaries, including by settling disputes over these boundaries. The limited role of simply resolving problems arising from the central government's policies has led to less than optimal performance by regional governments in monitoring and dispute settlement duties, as in the cases of mining and plantation affairs.
2.2 Natural Resource-Based Regional Economic Structure
In general, governments in Indonesia are highly dependent on natural resources. The regional planning policies above reflect the dependence of regional governments on natural resources. A study by the World Bank has indicated that natural capital makes up one quarter of Indonesia’s total wealth, and that 45 percent of Indonesia’s wealth is derived from assets in the ground13
such as coal and other mining products.
Coal, petroleum and palm oil are the main basis of economic development in these research areas. As for the provincial governments of South Sumatra and East Kalimantan, their most important resources for development are coal and petroleum. Meanwhile, palm oil is a means of economic support for the provinces of West Kalimantan and South Sumatra. Coal production tends to be on the rise, compared to oil and natural gas. In the provinces of South Sumatra and East Kalimantan, coal production is growing steadily. The growth of oil and natural gas has been less impressive, even seeing a decrease over several years. Coal production in both provinces increased to 68 percent from 2009-2012. Petroleum, on the other hand, grew by 15 percent and natural gas grew by 1 percent during the same period. This decrease for oil and natural gas was due to limited development of new oil and natural gas fields. As a result, the focus of mining activities is massively shifting to coal mining. Coal is an abundant commodity in Indonesia. There is as much as 104.8 billion tons of coal resource reserves in Indonesia. From 1996 to 2010, Indonesia’s coal production witnessed an average growth rate of 14.8 percent14 per year, and there was an average export growth rate of 15.1 percent per year. The provinces of East Kalimantan and South Sumatra are the main actors in coal mining production.
12 A Perda was established in a DPRD plenary session of East Kalimantan Province at the beginning of November 2013. The Perda number is currently under preparation by their legal department.
13 World Bank, 2009: Investing in a more Sustainable Indonesia, Jakarta
Graphic 2.1 Production Growth of Petroleum, Natural Gas and Coal in South Sumatra and East Kalimantan Provinces, 2009-2012
Object 3
Source: Daerah Dalam Angka for each province in 2012
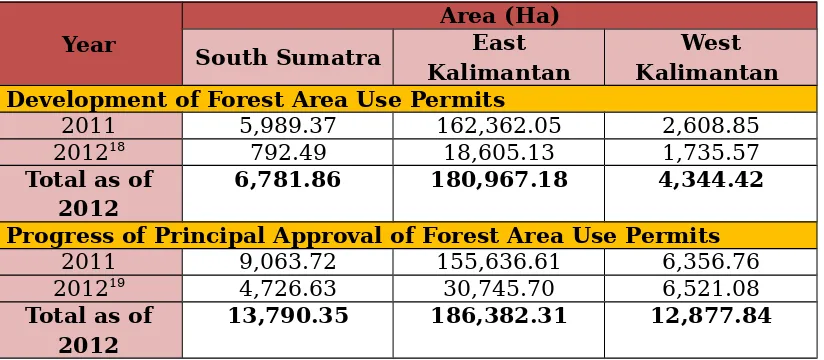
These three research provinces represent almost half of the forest land under use permits for mining activities15 on a national level, which covered more than 400,000 hectares as of 2012. Nationally, 857,977.56 hectares (Ha) of forest land are still under use permits.16 East Kalimantan contributes the greatest amount of this forest land under use permits, amounting to around 370,000 hectares, followed by South Sumatra province with 20,000 hectares and West Kalimantan province with 15,000 hectares. East Kalimantan province has more forest land under use permits for mining exploitation. As of 2011, the government had issued use permits for mining exploitation activities in more than 162,362.05 Ha of forestland, and in 2012, the government allowed another 18,605.13 Ha of land to be used for coal mining activities. Hence, up until 2012, 180,967.18 Ha of forestland had been transferred for use into mining areas. Worse still, as of 2012 up to 186,382.31 Ha of forestland had received principal approval for use permits. This expansion of forestland under use permits is expected to result in deforestation.
15 The amount of forestland under use permits for mining activities can be calculated by adding up the total area of forest use permits for mining exploitation and the total area of principal approval of use permits. The inclusion of principal approval in the calculation is based on the fact that in many cases, this principal approval is used by companies for mining exploitation: www.bpk.go.id/en/wp-content/uploads/2013/06/1.-hal-2-25.pdf
Table 2.3 Development of Forest Area Use Permits Development of Forest Area Use Permits
2011 5,989.37 162,362.05 2,608.85
201218 792.49 18,605.13 1,735.57
Total as of 2012
6,781.86 180,967.18 4,344.42
Progress of Principal Approval of Forest Area Use Permits
2011 9,063.72 155,636.61 6,356.76
201219 4,726.63 30,745.70 6,521.08
Total as of 2012
13,790.35 186,382.31 12,877.84
Source: Data from the Directorate General of Forestry Planning 2012, Directorate of Forest Area Use, data to December 2012
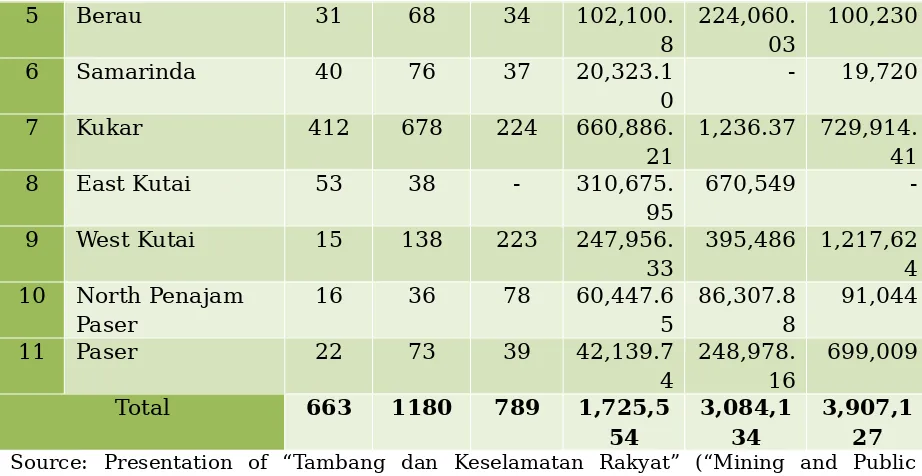
One quarter of the total land area in East Kalimantan is taken up by coal mines. Based on the data quoted by Jatam,20 as of December 2012 the number of coal mining business permits in East Kalimantan had reached 1,488, covering an area of 5,410,664 Ha. Meanwhile, the land area of this province is 19,844,117 Ha.21 These figures indicate an increase compared to those as of December 2009, with a total of 1,180 permits covering 3,084,134 Ha of land. In 2007, there were a total of 633 mining authorisation permits issued covering 1,725,554 Ha. This amount does not include the coal mining permits issued by the central government in the form of PKP2Bs, totaling 33 permits covering 1.3 million Ha of land. Below is a table of the development of Mining Business Permits in East Kalimantan.
Table 2.4 Development of Mining Business Permits in East Kalimantan
No Area Year
Number of KP/IUP Area of mining zone (Ha)
2007 2009 2011 2007 2009 2011
1 Malinau22 9 7 39 45,210 11,114 544,594
2 Nunukan 17 22 30 176,298 70,112 119,875.
47
3 Tana Tidung - 2 4 - 5,000 11,288
4 Bulungan 18 33 80 59,516 136,153.
31
373,827. 65
17 It should be noted that each government publication contains different forest area figures 18 The 2012 data includes the extension/revision of the previous permits
19 The 2012 data includes the extension/revision of the previous permits
20 Presentation of “Tambang dan Keselamatan Rakyat”, Jatam, 2012
21 Forestry Minitry, 2012: Forestry Profile in 33 provinces, Jakarta:
http://www.dephut.go.id/uploads/files/c61ee2b47b73147c42bf266ad0d556a5.pdf
22 Malinau, Nunukan, Tanah Tidung, Tarakan and Bulungan have been included as regencies of North Kalimantan Province
5 Berau 31 68 34 102,100. 8
224,060. 03
100,230
6 Samarinda 40 76 37 20,323.1
0
- 19,720
7 Kukar 412 678 224 660,886.
21
9 West Kutai 15 138 223 247,956.
33
11 Paser 22 73 39 42,139.7
4 Malaysia, the current number two. Oil palm plantations have expanded to almost all of Indonesia’s territories, especially on the two large islands of Sumatra and Kalimantan. In 2012, Sumatra hosted 62.5 percent of the oil palm plantation land in the nation with 5,913,585 Ha, contributing 73.6 percent of the total national production (17,317,295 tons). Meanwhile, Kalimantan hosts the second-largest area of plantation land, representing 31 percent or 2,814,782 Ha, contributing 23.5 percent of total production (5,520,207 tons).23 The progress of oil palm plantation expansion in the three provinces during 2009-2011 is indicated in the following table.
Table 2.5 Oil Palm Areas by Province, 2008-2012 (in Ha)
No Regions Year
2 Java 26,425 27,163 28,057 25,687 26,112
3 Kalimantan 2,070,16
6 Maluku-Papua 58,801 57,398 57,462 59,077 59,554
7 Indonesia 7,363,84
The increasing area of oil palm plantations has been triggered by the central government’s obsession with being the world’s greatest oil palm exporter. Regional government policies go hand-in-hand with the central government’s plan, as seen in the move by the East Kalimantan provincial government to create a “Program to Develop One Million Hectares of Land for Oil Palm Plantations”. In carrying out the program, the provincial government of East Kalimantan has been eager to facilitate the licensing process, hence, within a very short time about 18624 oil palm plantation business permits were issued covering 2.6 million Ha, or three times more than the area previously planned, which was 800,000 Ha. In many cases, once a permit has been issued, companies use oil palm plantation development as a pretext for logging via land clearing. After the permits have been obtained and all the timber has been taken, investment in the oil palm plantation sector may or may not actually be realised. In reality, the area of oil palm plantation areas on which palms were actually planted in 2012 was only 827,34725 Ha, and in 2012 the area of oil palm plantations was only 961,80226 Ha.
Table 2.6 Area of Oil Palm Plantations27
Type of Plantation
Plantation Area (Ha)
South Sumatra East Kalimantan West Kalimantan
2009 2010 2011 2009 2010 2011 2009 2010 2011
Major
Plantation 690,990 696,503 733,902 401,275 536,777 669,112 389,334 522,508 625,532 People's
Plantation 92,189 127,313 132,860 129,279 122,756 158,235 221,858 228,440 255,235 Total 783,179 823,816 866,762 530,55
4 659,533 827,347
611,19
2 750,948 880,767
Source: Regions in Figures, 2012, by province
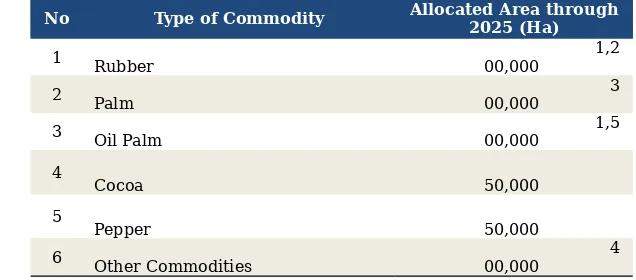
Meanwhile, in West Kalimantan, the provincial government had allocated 3.5 million Ha before 2025, from which 45 percent was allocated for oil palm plantations, amounting to 1.5 million Ha. In addition to oil palm, rubber plantations also serve as a main support for West Kalimantan, where around 1.2 million Ha of land has been set aside for rubber plantations through 2025.
Table 2.7 Plantation Development Plan for West Kalimantan28
No Type of Commodity Allocated Area through2025 (Ha)
1 Rubber 1,200,000
25 Provinsi Kalimantan Timur dalam angka tahun 2012
26 RKPD Pemerintah Provinsi Kalimantan Timur tahun 2013
27 It should be noted that each government publication contains different forest area figures.
28 Kajian Tata Kelola Hutan dan Lahan di Kalimantan Barat, Puska Antropologi UI – The Asia Foundation, 2013
Total 3,500,000
Source: Hendarto, 2012 in Puska Antropologi UI, and The Asia Foundation, 2013 unpublished
The expansion of mining and oil palm areas pose a threat of increased horizontal conflicts. The government’s commitment to promote economic growth through the mining and oil palm plantation sectors does not just threaten the existence of forests through the transfer of land and forest; it also puts pressure on the need to expand the land allocated for these two sectors. It is this need for land expansion that frequently results in land-based conflicts between local communities and companies. Additionally, some conflicts arise from land boundaries that have not been clearly demarcated by the government. Data from the Agrarian Renewal Consortium, for example, says that out of the designated area of forest, reaching 136.94 million Ha, or 69 percent of Indonesia’s total territory, only around 12-13 percent of the area has been demarcated by the government.29 It is this condition that triggers the relatively high number of land conflicts.
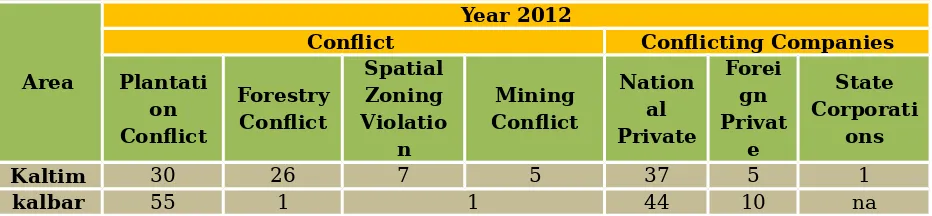
Conflicts over plantation areas are more common than other kinds of conflicts, as even more than two conflicts can arise in a given month. As of 2011, there were 30 recorded land conflicts in South Sumatra province, and this increased to 43 conflicts in 2013.30 West Kalimantan province had the highest number of plantation land conflicts, with 55 cases reported in 2012. From such data, it is found that there have been an average of two to five cases a month. Meanwhile, in East Kalimantan, plantations and forestry are the most common sources of conflict. Domestic private companies have caused the most conflict with society in terms of existing conflicts. There is also a good number of foreign private companies in West Kalimantan compared to those in East Kalimantan province. The following table shows the very high frequency of plantation conflicts in the provinces of both East and West Kalimantan.
Table 2.8 Conflicts and Conflicting Companies in 2012
Area
29 Sekolah Tinggi Pertanahan Nasional, April 2013, Bhumi Jurnal Ilmiah Tertanahan PPPM – STPN nomor 37 tahun 12, April 2013, Yogjakarta
2.3 Exploitative Planning Policies in the Absence of Adequate Recovery Programs
The area of critical land31 in the regions keeps increasing. Of the three provinces under review, the area of critical land is greatest in32 the provinces of West Kalimantan and South Sumatra, covering more than 30 percent of the total area of each. In East Kalimantan, the area of critical land covers only 14 percent of the total area. However, East Kalimantan has experienced the greatest growth in area of critical land, constituting more than 300,000 Ha per year from 2007-2011. In South Sumatra province, the area of critical land grew by 250,000 Ha per year during the same period.
Table 2.9 Critical Land Area Growth in Three Provinces, 2007-2011
Condition of Land
South Sumatra East Kalimantan West Kalimantan
2007 2011 2007 2011 2007 2011
Critical land 2,085,3
land 739,485 217,707 16,124 325,357 NA
3,648,7 94 Source: Processed from many sources by Seknas FITRA
The critical land rehabilitation program has not yet become a priority program at the regional level. There is minimal information available related to the area of critical land and regional governments’ programs to deal with it, except in the case of East Kalimantan. In its 2013 Regional Government Work Plan (RKPD), East Kalimantan announced its plans to rehabilitate 10,000 Ha of critical land33 and rehabilitation of 500 Ha of mangrove forest per year. Judging from the existing condition of critical land, the target for this critical land rehabilitation is actually less than optimal, considering that in 2011 there was still 4.6 million Ha of critical land. Using the yearly target of 10,000 Ha, the actual time needed by the East Kalimantan provincial government to nomalise the condition of critical land would be ± 462 years.
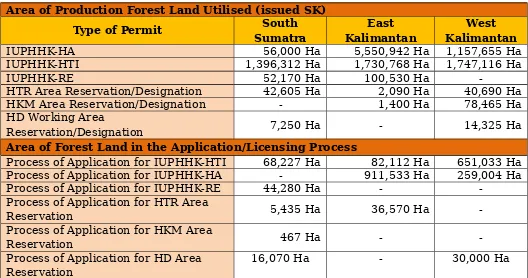
Public access to forest management covers less than 5 percent of the total forest area. Public access in the utilisation of forest resources and governance through community forest (HKm), village forest (HD) and community forest plantation (HTR) schemes has also been kept at a bare minimum compared to the area of Production Forest in its entirety. The percentage of HKm, HD and HTR area relative to the area of production forest used/utilised in West Kalimantan province is only 4.4 percent, while South Sumatra province allocates 2 percent. East Kalimantan’s HKm, HD and HTR area percentage relative to the production forest area under usage/utilisation is less than 1 percent, at only 0.04 percent. This minimum amount of forest area for HKm, HD and HTR indicates that the government still prioritises corporate
31 In these terms, critical land is a sum of the critical and very critical land data.
32 Based on the critical land data released by the government, the critical land identification includes residential and community agricultural lands.
and industrial interests over those of the local community in granting access to the utilisation and management of resources.
Table 2.10 Area of Production Forest Land Utilised
Area of Production Forest Land Utilised (issued SK)
Type of Permit South
Sumatra
East Kalimantan
West Kalimantan
IUPHHK-HA 56,000 Ha 5,550,942 Ha 1,157,655 Ha
IUPHHK-HTI 1,396,312 Ha 1,730,768 Ha 1,747,116 Ha
IUPHHK-RE 52,170 Ha 100,530 Ha
-HTR Area Reservation/Designation 42,605 Ha 2,090 Ha 40,690 Ha
HKM Area Reservation/Designation - 1,400 Ha 78,465 Ha
HD Working Area
Reservation/Designation 7,250 Ha - 14,325 Ha
Area of Forest Land in the Application/Licensing Process
Process of Application for IUPHHK-HTI 68,227 Ha 82,112 Ha 651,033 Ha
Process of Application for IUPHHK-HA - 911,533 Ha 259,004 Ha
Process of Application for IUPHHK-RE 44,280 Ha -
-Process of Application for HTR Area
Reservation 5,435 Ha 36,570 Ha
-Process of Application for HKM Area
Reservation 467 Ha -
-Process of Application for HD Area Reservation
16,070 Ha - 30,000 Ha
Source: Data and Information on Forest Use, 2011, Regional directorate for the management and preparation of forest use areas, Directorate General of Planning, Forestry Ministry
scheme has legalised deforestation and land and forest degradation in the regions, as illustrated in the division of corridors below:
- The Sumatra Economic Corridor has a development theme of "National Production and Processing Center for Agricultural Produce and Energy Storage”;
- The Java Economic Corridor has a development theme of “National Driver of Industry and Services”;
- The Kalimantan Economic Corridor has a development theme of “National Production and Processing Center for Mining Products and Energy Storage”;
- The Sulawesi Economic Corridor has a development theme of “National Production and Processing Center for Agricultural, Plantation, Fishery, Oil and Gas, and Mining Products”;
- The Bali- Nusa Tenggara Economic Corridor has a development theme of ‘’National Gateway to Tourism and Food Crop Support’’;
- The Papua-Maluku Islands Economic Corridor has a development theme of “National Center for the Development of Food Crops, Fisheries, Energy and Mining”.
As a planning policy, MP3EI does not just serve as a policy scheme for distribution of regional economic growth, it is also a blueprint for investors for exploitation of natural resources on a more massive scale. Despite the consideration of environment-based sustainable development under the MP3EI scheme, the government has failed to optimally fulfill this in practice. As found by Seknas FITRA34, the pro-poor, pro-job, pro-growth and pro-environment policies as pillars of development are considered less capable of balancing sustainable development.
The Long-Road Corridor (Corridor Permit) poses a threat of deforestation and degradation. In addition to policies supporting the transfer of land and forest function for mining and agricultural/plantation activities, forest land is also threatened by the issuance of corridor permits. In Forestry Minister’s Regulation No. P. 30/Menhut-Ii/2010 on the Amendment of Forestry Minister’s Regulation No. P.9/Menhut-Ii/2010 on Permits for Corridor Construction and Utilisation, Article 1, it is stated that:
“The corridor is a transportation pathway in the form of roadways, canals, dollies/railways or other pathways constructed and/or used mainly for transporting timber or non-timber forest products, or timber and non-timber primary industry products from IUPHHK areas to natural forests, or from IUPHHK areas to plantation forests, or from IPK or forest product primary industry areas to timber storage centers/log ponds at the edge of rivers or the sea, or other places via forest areas outside IUPHHK/BK areas to natural forest or plantation forest areas, IPK or the primary industrial area of the associated forest products.”
34 Seknas FITRA dan The Asia Foundation, 2013:Mengukur Komitmen: Analisis Kebijakan Perencanaan dan Anggaran Nasional terhadap Pengelolaan Hutan dan Lahan di Indonesia, Jakarta.
From this definition it is clearly seen that the objective of the corridor construction is to facilitate the flow and distribution of mining and forestry products.
In Article 17 of Forestry Minister’s Regulation No. P. 30/Menhut-Ii/2010 on the Amendment of Forestry Minister’s Regulation No. P.9/Menhut-Ii/2010 on Permits for Corridor Construction and Utilisation, it is stated that the provisions for constructing a corridor are as follows:
a. It should be managed so that the transportation route is as short as possible;
b. Non-forestry areas are preferred; c. No burning is allowed; and
d. The maximum corridor width is forty (40) meters, consisting of main road/road surfaces, right and left road shoulders, felling from the edges of the right and left shoulders of the road and so on.
What actually happens in the field is that the issuance of a corridor permit often poses a threat to forests. The provinces of South Sumatra (with an area of 52,170 Ha)35 and Jambi (46,385 Ha) have introduced a land allocation known as Hutan Harapan, or ‘Hope Forest’—an ecosystem restoration forest of 98,555 Ha, which was previously used as a production forest concession area, where the ecosystem is currently being recovered. The current Hutan Harapan has once again come under threat by plans to construct a corridor for transporting coal-mining products. The total area of this coal transport road will pass through a forest area for total length of 51.3 kilometers and width of ±30-50 meters. Thus, up to 154 Ha of forest land will being opened due to the construction of the road, with an affected area of ± 5,300 Ha.
Part III
Reviewing Regional Budgets:
Measuring Regional Government
Commitment and Partiality Toward
Land and Forest Governance
3.1 Overview of Regional Revenue
In a previous budget study conducted by Seknas FITRA, an analysis of regional revenue was needed to see where the revenue comes from and how great its fiscal capacity is in funding internal programs and personnel.
Regional revenue is obtained through locally generated revenue (PAD), balanced funds (daper) and a type called Miscellaneous Lawful Regional Revenue (LPDS). Law No. 33/2004 concerning fiscal balance for central and regional governments stipulates that there are three main sources of regional revenue:
Locally Generated Revenue (PAD), consisting of Regional Tax, Regional Fees and Charges, Results of Separated Regional Asset Management, and Lawful Miscellaneous PAD.
Balanced Funds, consisting of General Allocation Funds (DAU), Special Allocation Funds (DAK), and Profit-Sharing Funds (DBH).
Other Revenue (LPDS), consisting of Grant Funds, Emergency Funds, Profit-Sharing Funds, Tax from Other Provincial and Local Governments, Adjustment and Special Autonomy Funds, Financial Assistance from Other Provincial and Local Governments, and ‘Other’ Revenue.
District government revenue remains dependent on balanced funds, while its provincial counterpart is almost equally distributed between balanced funds and locally generated revenue (PAD). The average proportion of balanced funds making up regional revenue in the six district-level governments studied reached 83.5 percent in the period 2009-2012. This figure confirms FITRA’s previous findings, which suggested that there had been no significant change in regional governments’ dependence on balanced funds. Despite the increased contribution from Other Revenue (LPDS) in the last few years, balanced funds remain the greatest contributor to regional revenue. Regional governments fail to optimally manage locally generated revenue (PAD) as the base source of regional revenue.
The district with the greatest dependence on balanced funds is Musi Banyuasin, where for four consecutive years the dependence rate was over 90 percent. Berau district, on the other hand, had the lowest average dependence from 2009-2012, at 73 percent. PAD contributed only 5.9 percent of the revenue in the six regions for 2009-2012. This figure is still below the national average for PAD contribution during 2009-2012 of 6.6 percent. The highest PAD contribution was in Berau, with nearly 10 percent between 2009 and 2012. Musi Banyuasin district was only able to collect 4 percent during the same period, which is nearly stagnant.
Graphicic 3.1 - Revenue Composition by District, 2009-2012
Object 5
At the provincial level, findings indicated an average balanced fund contribution in the three provinces between 2009-2012 of 52.3 percent. This figure shows that the provincial financial independence level is improving, and the three provinces are even above the average of the 33 provinces in Indonesia. The average PAD of all provinces in Indonesia during 2009-2012 was 40 percent of regional revenue. Meanwhile, East Kalimantan and South Sumatra’s average PAD during 2009-2012 was 43.2 and 42.9 percent respectively, while West Kalimantan’s was 42.2 percent.
Graphicic. 3.2 - Revenue Composition by Province, 2009-2012
Object 7
Sumatra’s natural resources DBH contribution reached 66 percent during the same period. The districts in both provinces experienced the same. Musi Banyuasin, Bulungan and Berau obtained a fairly large DBH, at more than two-thirds of the balanced fund transfer. Musi Rawas’ DBH and DAU were in balance.
Graphicic 3.3 Balanced Funds Composition by Province
Object 9
West Kalimantan province and its districts remain dependent on General Allocation Funds (DAU) as a source of balanced funds. West Kalimantan province and two of its districts, Sintang and Kubu Raya, obtained more than 80 percent of DAU. DBH at the provincial level reached only 13 percent, while at the district level, the contribution of DBH was smaller than that of DAK.
Object 11
extraction. More than two-thirds of SDA DBH Is derived from oil and gas, followed by the general mining sector at 23 percent, including coal mining. The DBH per capita and ratio of DBH per capita to revenue for East Kalimantan is more than 100 percent of the national average. The forestry DBH revenue is only 1 percent of the total DBH of natural resources (SDA). Nominally, the forestry DBH revenue of East Kalimantan province is still seven times greater than that of West Kalimantan province, or, to be precise, amounting to Rp29 billion on average during 2009-2011. In East Kalimantan, the sources of DBH-SDA revenue are dominated by the general mining and forestry sectors.
West Kalimantan’s average DBH per capita from 2009-2012 was very low, below the national average, at Rp32,812, or only 7 percent of the total regional budget. Meanwhile, the national average DBH per capita in the same period was Rp501,573. By sector, realisation of DBH SDA for forestry was Rp2.7 billion in 2009 and increased to Rp6.9 billion by 2011. For the general mining sector, 2009 reached 78 percent or Rp9.5 billion and fell to 47 percent or Rp3.7 billion in 2010, before rising again to 75 percent or Rp20.3 billion in 2011. In the case of West Kalimantan, high DAU revenue in the regional budget was balanced by low DBH revenue, as intended by the
law on Balanced Funds introduced by the central government in the decentralisation era.
Most of South Sumatra’s DBH SDA revenue is derived from DBH in the oil and gas sector at 87.9 percent, while general mining contributes 11.7 percent and forestry only 0.4 percent. The oil and gas sector has made a significant contribution to the establishment of economic structures in this province. When correlated with the contribution of this primary sector to South Sumatra’s PDRB in 2011, it
would be about 22.31 percent and, at least for the last three years, the Graphic has showed a growing trend. However, if the calculation of PDRB excludes the oil and gas sector, then the greatest contributing business sector to PDRB is, surprisingly, the agriculture sector, while mining and excavation rank lower in their contribution to PDRB. After agriculture, the next in rank is trade and hospitality, followed by processing industries. Together, oil and gas, agriculture and hospitality make up the three greatest contributors to South Sumatra’s PDRB.36
36 Pusat Kajian Antropologi Universitas Indonesia, 2013 in a study report “Analisis Ekonomi Politik dan Agenda Perubahan Tata Kelola Hutan dan Lahan di Provinsi Sumatra Selatan.”
Box 3.1 Balanced Funds for Reducing Fiscal Gap
Law No. 33/2004 on Balanced Funds between the Central and Regional Governments Explains that Balanced Funds are funds sourced from APBN income which is allocated to the regions to fund local needs, in the context of implementing decentralization. The objective is to reduce the fscal gap between the central and regional governments, and among regional governments. Therefore, the increase of DBH is always accompanied by a reduction in DAU and vice versa.
Graphic 3.5 Composition of DBH-SDA by Province, 2009-2011
Object 13
The greatest oil and gas revenue shares among the study areas were found in Musi Banyuasin and Musi Rawas districts, at almost 95 percent. They were followed by Berau and Bulungan districts, which received over 50 percent, and Kubu Raya district with only 33 percent. Despite its fairly high percentage, nominally, the oil and gas revenue share in Kubu Raya is insignificant compared to the provinces of East Kalimantan and South Sumatra.
Graphic 3.6 Composition of Revenue from Natural Resources by Province, 2009-2012
Object 15
Differences appear in the records between APBN and APBD in terms of DBH-SDA Forestry. DBH-SDA Forestry is a kind of Profit-Sharing Fund (DBH)
in the balanced fund category, the source of which is APBN budget revenue, which is then distributed under a revenue-sharing scheme to regional governments by certain percentage points. In the APBN bookkeeping system, DBH forestry is classified as central transfer spending as a balanced fund group. In APBD bookkeeping, however, DBH forestry is recorded as regional revenue. Since this money leaves the pocket of the APBN and then enters the pocket of the APBD, the amount paid by APBN and received by APBD should be the same. However, this study found that there has been a difference in the number recorded in APBN and APBD bookkeepings. This discrepancy occurs only in DBH Forestry and not in other DBH-SDAs. This difference occurred in the 2009-2011 budget realisation. Graphic 3.7 below illustrates this finding.
Graphic 3.7 Transferred Budget and Realised Budget for Forest Resources, 2009-2011
Object 17
Berau district showed an extreme difference in recording in 2009, with almost Rp50 billion. Meanwhile, Musi Rawas district showed a difference of about Rp2 billion a year. This difference in recording indicates how weak the public financial management and financial accountability systems are at both the central and regional levels of government. These findings seemed to occur not only during the 2009-2011 period. The State Audit Agency’s (BPK) findings as contained in the 2008 review of audit fiscal transparency No. 25/05/LHP/XV/05/2009 dated May 20, 2009, identified the same during the 2008 budget year. In this report, it is stated that the exercise of the central government’s roles and responsibilities in fiscal management has many weaknesses, such as the absence of a consolidation mechanism for Regional Government Financial Statements (LKPD) and low fiscal transparency at the regional government level. For this reason, BPK recommended consolidation of the Regional Government Financial Statements (LKPD) and Regional Transfer Financial Statements (LKTD), with the aim of improving state financial management transparency and accountability.37 It seems that this recommendation made in 2009 has not yet received a response from the central government, causing this difference in recording to persist through 2011. Weak public financial management at both central and regional levels raises the
37 Konsolidasi laporan keuangan pemerintah daerah dengan laporan keuangan transfer ke daerah tahun anggaran 2008 & 2009, prepared by Direktorat Jenderal Perimbangan Keuangan, Kemenkeu RI.