This ar t icle was dow nloaded by: [ Univer sit as Dian Nuswant or o] , [ Rir ih Dian Prat iw i SE Msi] On: 01 Oct ober 2013, At : 01: 10
Publisher : Rout ledge
I nfor m a Lt d Regist er ed in England and Wales Regist er ed Num ber : 1072954 Regist er ed office: Mor t im er House, 37- 41 Mor t im er St r eet , London W1T 3JH, UK
Accounting and Business Research
Publ icat ion det ail s, incl uding inst ruct ions f or aut hors and subscript ion inf ormat ion: ht t p: / / www. t andf onl ine. com/ l oi/ rabr20
The effect of large audit firm mergers on audit pricing
in the UK
Kevin P. McMeeking a , Ken V. Peasnel l b & Pet er F. Pope b a
School of Business & Economics, Exet er Universit y, St reat ham Court , Exet er, EX4 4PU Phone: (0044) +1392 263206(0044) +1392 263201 Fax: (0044) +1392 263206(0044) +1392 263201 E-mail :
b
Lancast er Universit y
Publ ished onl ine: 04 Jan 2011.
To cite this article: Kevin P. McMeeking , Ken V. Peasnel l & Pet er F. Pope (2007) The ef f ect of l arge audit f irm mergers on
audit pricing in t he UK, Account ing and Business Research, 37: 4, 301-319, DOI: 10. 1080/ 00014788. 2007. 9663314
To link to this article: ht t p: / / dx. doi. org/ 10. 1080/ 00014788. 2007. 9663314
PLEASE SCROLL DOWN FOR ARTI CLE
Taylor & Francis m akes ever y effor t t o ensur e t he accuracy of all t he infor m at ion ( t he “ Cont ent ” ) cont ained in t he publicat ions on our plat for m . How ever, Taylor & Francis, our agent s, and our licensor s m ake no
r epr esent at ions or war rant ies w hat soever as t o t he accuracy, com plet eness, or suit abilit y for any pur pose of t he Cont ent . Any opinions and view s expr essed in t his publicat ion ar e t he opinions and view s of t he aut hor s, and ar e not t he view s of or endor sed by Taylor & Francis. The accuracy of t he Cont ent should not be r elied upon and should be independent ly ver ified w it h pr im ar y sour ces of infor m at ion. Taylor and Francis shall not be liable for any losses, act ions, claim s, pr oceedings, dem ands, cost s, expenses, dam ages, and ot her liabilit ies w hat soever or how soever caused ar ising dir ect ly or indir ect ly in connect ion w it h, in r elat ion t o or ar ising out of t he use of t he Cont ent .
This ar t icle m ay be used for r esear ch, t eaching, and pr ivat e st udy pur poses. Any subst ant ial or syst em at ic r epr oduct ion, r edist r ibut ion, r eselling, loan, sub- licensing, syst em at ic supply, or dist r ibut ion in any
1. Introduction
A large number of audit firms have combined in the UK since the 1980s. Table 1 shows that the various mergers and the demise of Andersen have reduced the number of first-tier accounting firms (hereafter Big Firms) from eight in 1985 to four in 2002. Industrial economists use the structure-con-duct-performance paradigm to urge regulators to be wary of reductions in the number of suppliers. Interesting research questions raised by this para-digm are how and to what extent have the structure of the audit market and the pricing policies of the major accounting firms been affected by the merg-ers and Andmerg-ersen transaction? We examine audit pricing in the context of the industry restructuring that occurred during the 1980–2003 period as a
re-sult of mergers between large audit firms and the disappearance of Andersen (hereinafter referred to as the ‘Andersen transaction’).
This study contributes to the literature by inves-tigating the effect of structural changes in the mar-ket for audit services on concentration and the pricing of the audits of UK listed companies. The UK provides an interesting empirical setting for a number of reasons. UK companies have long re-ported audit fee information in their annual finan-cial statements (Companies Act 1967), making it possible to carry out a longitudinal study that is not yet possible in the US.1 Furthermore, the London market is one of the world’s largest, making it eas-ier to test theories of audit pricing than in small markets like Hong Kong. We have exploited these institutional features to conduct a more compre-hensive study over a longer time frame than in the prior literature.
We find that the largest increases in concentra-tion ratios coincided with Big Firm mergers in 1989, 1990 and 1997. By 2002, concentration ra-tios reached levels that are consistent with a mar-ket structure of just over four equal sized firms, exceeding levels normally associated with a tight oligopoly. These structural changes appear to have had a variable effect on audit fees. There is some Accounting and Business Research,Vol. 37. No. 4. pp. 301-319. 2007 301
The effect of large audit firm mergers on
audit pricing in the UK
Kevin P. McMeeking, Ken V. Peasnell and Peter F. Pope*
Abstract—This paper examines the effects on UK audit market concentration and pricing of mergers between the large audit firms and the demise of Andersen. Based on data over the period 1985–2002, it appears that mergers contributed to a rise in concentration ratios to levels that suggest concern about the potential for monopoly pricing. The high concentration ratios have not improved the level of price competition in the UK audit market. Our pooled models suggest that concentration ratios are associated with higher audit fees. The evidence suggests that the ef-fects of mergers between big firms on brand name fee premium and on price competition vary depending on the particular circumstances. The brand name premium is strongest for the largest quartile of companies prior to the mergers. After the Big Six mergers, the premium increases for average-sized companies but falls for the smallest and largest companies. Following the PricewaterhouseCoopers merger, the premium increases for below median-sized clients but decreases for above-median median-sized clients. For the Deloitte-Andersen transaction, the premium falls for the smallest and largest companies but increases for those in the second quartile. Our results provide evidence that auditees are likely to pay higher fees if their auditor merges with a larger counterpart. We attribute merger-re-lated fee hikes to product differentiation, rather than anti-competitive pricing.
Key words: concentration, mergers, pricing, oligopoly, choice
*McMeeking is at Exeter University. Peasnell and Pope are at Lancaster University. This research benefited from the gen-erous financial support from the International Centre for Research in Accounting. Previous copies of the paper were presented at the 2005 British Accounting Association Auditing SIG conference and the 2005 EARNet conference. We are very grateful to Ashni Singh and Richard Patterson for re-search assistance and for the helpful comments of Peter Moizer, Ilias Basioudis, Vivien Beattie, David Citron, Terry Cooke, Paul Dunnmore, Aasmund Eilifsen, Jere Francis, David Gwilliam, Pelham Gore, Jonathan Hayward, Clive Lennox, Mark Tippett, Stuart Turley, Steven Young, the editor (Pauline Weetman) and two anonymous reviewers. Any re-maining errors are the sole responsibility of the authors. Address for correspondence: Kevin McMeeking, School of Business & Economics, Streatham Court, Exeter University, Exeter, EX4 4PU, email: [email protected], Tel: (0044) +1392 263206 (direct line), (0044) +1392 263201 (sec-retary), Fax: (0044) +1392 263210
This paper was accepted for publication in August 2007.
1US firms have only been required to disclose the fees paid
to auditors in statements filed on or after 5 February 2001 (Securities and Exchange Commission, 2000). Researchers using US data have therefore had to focus on measures like the number of audits, clients’ turnover or clients’ asset values as the measurement base because of the lack of available audit fee data (Moizer and Turley, 1989: 42).
302 ACCOUNTING AND BUSINESS RESEARCH
Table 1
History of mergers and other transactions involving first-tier accounting firms since 1984
Date Country Attempted merger D-A transaction Failure/Success
1984 US and UK PW and DH Failure
1986 US and UK PM and KMG Success
1989 US and UK EW and AY Success
1989 US and UK PW and AA Failure
1989 US DH and TR Success
1989 UK DH and TR Failure
1990 UK DH and CL Success
1990 UK TR and SP Mainly success
1994 US and UK AA and BH Mixed
1997 US and UK CL and PW Success
1997 US and UK EY and KPMG Failure
2002 UK D-A Success
Audit partnerships are named as follows: AA = Arthur Andersen; A = Andersen; AY = Arthur Young; BH = Binder Hamlyn; CL = Coopers and Lybrand; D = Deloitte; DH = Deloitte Haskins and Sells; EW = Ernst and Whinney; EY = Ernst and Young; KMG = KMG Thomson McLintock; KPMG = KPMG; PM = Peat Marwick; PW = Price Waterhouse; SP = Spicer and Pegler and TR = Touche Ross.
evidence to suggest that the high concentration ra-tios have reduced the level of price competition, an effect that may be attributed to product differenti-ation. The ability of large audit firms to charge a brand premium might be a function of willingness to pay. This might be expected to be stronger for larger clients, and this is what we observe in the 1985–1988 period before the mergers. However, the pattern is more complex in the later part of our sample period. Our findings indicate that the brand name premium increased for average-sized com-panies (i.e. those in the second and third size quar-tiles) after the Big Six mergers but fell for the smallest and the largest companies. Following the PricewaterhouseCoopers merger, the brand name premium increased (decreased) for clients whose
size is below the median (above the median). The picture is even more complex following the Andersen transaction – the premium fell for the smallest and largest client quartiles but increased for those in the second quartile. We attribute these findings to the Big Firms engaging in a product differentiation strategy. Our findings using nomi-nal prices indicate that the 1989 merger raised the audit fees of Arthur Young clients relative to the same clients previously audited by Ernst and Whinney2 and the 1990 merger increased the Coopers and Lybrand fee premium over Deloitte.3 The 1997 merger reduced the size of the nominal fee discount offered by Price Waterhouse relative to Coopers and Lybrand. Up to the end of our sam-ple period the 2002 transaction had no material ef-fect on the nominal audit fees of Deloitte and Andersen former clients. Using inflation adjusted audit fees, we find that Coopers and Lybrand and Ernst and Young clients paid higher real audit fees relative to clients of the benchmark firm (KPMG). On the other hand, Andersen clients paid lower real audit fees in the run up to being forced out of business. This audit firm transaction is significant-ly different from the others because the Enron de-bacle left a stigma not present in other mergers.
The remainder of this paper is organised as fol-lows. The next section reviews the extant literature. Section 3 outlines the research design. The data collection procedures are explained in Section 4. The results are presented in Section 5 and a sum-mary is provided in Section 6.
2. Prior research
Industrial economists argue that market structure is intrinsically linked to firm behaviour and
finan-2The UK combination between Arthur Young and Ernst and
Whinney on 1 September 1989 was officially a merger but was seen by some writers as a takeover by Ernst and Whinney because several of the previously high-ranking Arthur Young partners left the following year. This anecdotal evidence sug-gests that Ernst and Whinney had a stronger brand name rep-utation than Arthur Young (supporting the evidence of the fee regressions).
3The Deloitte case provides an exclusive opportunity to
ex-amine the effects of brand name. In July 1989, the US partners of Deloitte Haskins & Sells and those of Touche Ross suggest-ed a merger. Deloitte in the UK and Haskins & Sells in the US had very different attitudes to this proposal. The US Deloitte partners overwhelming voted to proceed with the merger whereas the UK Deloitte partners chose to merge with Coopers and Lybrand with the official fusion to Coopers and Lybrand Deloitte taking place on 29 April 1990. The potential for confusion caused by two firms signing off as Deloitte was eased on 1 June 1992 when Coopers and Lybrand Deloitte dropped the name Deloitte, becoming Coopers and Lybrand. Coopers allowed Touche Ross to acquire the name Deloitte in 1996 to form Deloitte and Touche (Moizer, 2005: 4).
cial performance (Scherer and Ross, 1990; Martin, 1994). Scholars urge regulators to be wary of the pricing effects of merger-induced increases in market concentration (Stigler, 1968: 30; Gist and Michaels, 1995: 233; Romeo, 1999: 62).4There is considerable evidence that audit market concentra-tion has increased over time in the UK (Briston and Kedslie, 1984; Moizer and Turley, 1989; Beattie and Fearnley, 1994; Pong, 1999) and in other countries (Zeff and Fossum, 1967; Rhode et al, 1974; Hermanson et al., 1987; Wolk et al., 2001). Beattie and Fearnley (1994: 308) contend that, ‘auditor concentration in the UK market for listed audit services has now almost reached the limit of a tight oligopoly, which is a market struc-ture characterised by few rivals, stable market shares and medium to high entry barriers’. Concentration levels increased further following the PricewaterhouseCoopers merger and the de-mise of Andersen. The Sarbanes-Oxley Act (2002), the recommendations of the Treasury Committee (2002) and the Coordinating Group on Audit and Accounting Issues (2003) indicate the extent of the concerns about the audit services market in both the US and UK (Beattie et al., 2003: 251).
The extant literature on the effect of mergers on the economy is mixed (Francis et al., 1999). Consumer welfare will increase if mergers reduce marginal costs, create efficiencies and enhance product differentiation but will decrease if mergers enable tacit collusion over prices or if unilateral anticompetitive effects arise from non-tacit price collusion (Sullivan, 2002: 381–384). Concerns about the welfare implications of the 1989–1990 mergers (Wootton et al. 1994: 58–59) were qui-etened by the lack of opposition from the Monopolies and Mergers Commission and the Office of Fair Trading in the UK and the Department of Justice in the USA, and by evi-dence that auditors significantly cut fees to win au-dits in the 1980s (Simunic, 1980; Francis and Simon, 1987; Simon and Francis, 1988; Pong and Whittington, 1994; Gregory and Collier, 1996).5 Although Pong (2004) documents a 17.5% reduc-tion in inflareduc-tion-adjusted UK audit fees from 1991 to 1995, there has been little recent work that
has addressed this issue. This lack of evidence, and the structural changes resulting from the PricewaterhouseCoopers merger and the demise of Andersen, have rekindled concerns about the com-petitiveness of the audit market (Hermanson et al., 1987; Gist and Michaels, 1995; Pong, 1998; Willekens and Achmadi, 2003) and worries that that consumer choice will be further impaired if further mergers or takeovers occur (Oxera Consulting Limited, 2006).
It is difficult to test the welfare effects of merg-ers because audit firms have traditionally been or-ganised as unlimited liability partnerships. This makes access to proprietary data on costs and prof-itability impossible. Researchers have tried to cir-cumvent this problem by examining audit fees before and after a combination, but the results have been mixed. Tai and Kwong (1997) analysed audit fees using Hong Kong data between 1988 and 1991. They found that real audit fees increased significantly over this period. Ivancevich and Zardkoohi (2000) compared accounting funda-mentals for four US audit firms involved in the 1989–1990 mergers against competitor firms that were not involved in mergers. Following the merg-ers, the market share and audit fees of the merged firms fell relative to their non-merging rivals. Menon and Williams (2001) examined US audit fees for international accounting firm clients be-tween 1980 and 1997. They document a signifi-cant positive effect on audit fees for three years after mergers (1991–1993), but this premium sub-sequently disappears. Iyer and Iyer (1996) com-pared the UK audit fees earned by Big Eight firms in 1987 with Big Six firms in 1991. Although con-centration levels increased over the period, there was no evidence of any associated significant in-crease in audit fees. Firth and Lau (2004) examine the effect of accounting firm mergers on audit fees using a sample of Hong Kong companies. Their paper investigates the effect of a merger on any audit fee premium that existed before the combina-tion. They find that the size of the premium earned by a brand name firm (Deloitte, Touche Tohmatsu) over a non-brand name firm (Kwan Wong Tan and Fong) fell from 55% before the merger to 34% shortly after the merger. In contrast, there was no change in the audit fee premium earned by two brand name firms (Price Waterhouse and Coopers and Lybrand) after the merger. These results sug-gest that pre-merger premiums of the brand name auditor pass to the other auditor after a merger but do not transfer for re-branding amongst interna-tional firms.
3. Research design
The present study contributes to this literature by investigating the effects of the 1989–1990 Big Six mergers, the 1997 merger between Price
Vol. 37 No. 4. 2007 303
4Moizer and Turley (1989: 41) define concentration as ‘the
extent to which a relatively small number of audit firms ac-count for a significant proportion of the total audit work car-ried out.’
5Opinion surveys have yielded results consistent with this
research. One survey by the City Research Group found that 81% of the financial executives surveyed by the City Research Group questioning the audit fee (Anonymous, December 1991: 11). Another survey showed that 61% of the accountant respondents thought that ‘discounting audit fees was wide-spread’ (Lea, 1991). The leaked Price Waterhouse tender that allegedly included a £900,000 discount was also the subject of press comment (Plender, 1991).
Waterhouse and Coopers and Lybrand and the 2002 Deloitte-Andersen transaction on audit pric-ing in the UK. We start our analysis by estimatpric-ing concentration ratios to assess the potential for mo-nopoly pricing in the audit market. Consistent with prior work, we define audit activity based on the number of audit clients each audit firm has and the firm’s audit fee revenue (Wootton et. al., 1994; Pong, 1998, 1999; Wolk et. al., 2001). We use the concentration ratio (CR) and Herfindahl Index (H)6 because these are widely used by academics and regulators such as the US Department of Justice (Utton, 1970; Briston and Kedslie, 1984; Moizer and Turley, 1989; Beattie and Fearnley, 1994; Pong, 1999). CR and H are descriptive sta-tistics that prima facie suggest whether one should be concerned about the potential for anti-competi-tive pricing in the audit market. A posianti-competi-tive result leads us to investigate whether the UK audit mar-ket has become more monopolistic following the accounting firm mergers. Our analysis focuses on the mergers between international accounting firms because these combinations are fewer in number and are likely to have a larger impact on market structure and conduct than those taking place between smaller firms.
3.1 Empirical questions
The central issue is the effect of the big firm mergers on audit pricing, which we sum up in the following question:
EQ1: What are the fee effects for clients of larg-er audit firms following mlarg-erglarg-ers?
Mergers can improve consumer welfare by cre-ating efficiencies or decrease consumer welfare by creating conditions conducive to monopoly pric-ing (Sullivan, 2002: 381–384). Simunic (1980) ar-gues that some segments of the market could be more competitive than others; this could have an impact on the effects of the mergers on audit pric-ing. We follow this line of thought by using the small client market as the competitive benchmark and investigating whether fees change around the time of the mergers. In other words, we test whether the mergers have enabled the brand name firms to pass on any cost savings associated with efficiencies to their clients in the form of a reduc-tion in the assumed audit fee premium or allowed the Big Firms to use their power or reputation to increase the audit fee premium. This empirical question is tested by running a quality differentia-tion regression across sub-samples of clients parti-tioned by total assets in the periods surrounding the combinations:7
LAFi= α1,0+ β1,1Controlsi+ β1,2Brandi+ ε1,i, (1) where LAF is the natural logarithm of total audit fees (£000); Brand, is an indicator variable set equal to one if the auditor is a brand name firm and
zero otherwise; Controls is a vector of control vari-ables capturing audit fee determinants identified in the prior literature (e.g. Francis and Simon, 1987; Simon and Francis, 1988; Beatty, 1993; Anderson and Zeghal, 1994) as follows: LTA = natural loga-rithm of total assets (£m); Sub = square root of the number of subsidiaries; Current = ratio of current assets to current liabilities; Loss = 1 if an operat-ing loss was reported in any 1 of the prior 3 years, 0 otherwise; Quick = ratio of current assets less stock to current liabilities; DTA = ratio of long-term debt to total assets; ROI = ratio of earnings before interest and tax to total assets; Foreign = proportion of subsidiaries that are foreign opera-tions; YE = 1 if the accounting year end is between December and March inclusive, 0 otherwise; and
ε1,iis the regression residual. The control variables are designed to capture effort-related variation in audit fees (LTA), litigation risk (DTA, ROI, Current and Quick) and complexity (Sub, Foreign).
The second issue we address concerns the ef-fects of a merger on audit fees charged by specific audit firms around the time of the merger. There is a considerable body of theory and evidence sug-gesting that the large accounting firms have differ-entiated themselves from smaller competitors on the basis of perceptions of quality and that they are able to attract premium fees for their investment in a brand name reputation (e.g. Francis and Simon, 1987; Simon and Francis, 1988; Beatty, 1993;
304 ACCOUNTING AND BUSINESS RESEARCH
6The CR measures the percentage of the total activity (e.g.
number of clients or size of audit fees) that is accounted for by the largest firms as follows:
where n is the number of large audit firms and Siis the size of
audit firm i as a percentage of the size of the market. This study uses the N-firm concentration ratio (CRn) to examine the
dominance of the eight (1985–1989), six (1990–1996), five (1997–1999) and four (2000–2002) largest accounting firms over medium and small firms. Consistent with prior studies (Briston and Kedslie, 1984; Moizer and Turley, 1989; Beattie and Fearnley, 1994; Pong, 1999), we also use the four-firm concentration ratio (CR4) to express the percentage of the total activity that is accounted for by the leading four firms in the market.
One limitation of these measures is that they pay little atten-tion to the number and size of other firms in the market. The Herfindahl Index (H) provides a more comprehensive measure (Utton, 1970: 35–51; Moizer and Turley, 1989: 44; Pong, 1999: 455):
where, M is the total number of (big and small) firms in the audit market and Siis the size of audit firm i as a percentage
of the size of the entire market.
7The first subscript, 1, in equation (1) signifies that the
re-gression is based on equation (1), the second subscript, i, refers to firm-year.
McMeeking et al., 2006). A possible motive for smaller accounting firms to merge with larger ones is that it is expected that the clients of the smaller partner will be willing to pay more because of per-ceptions that the quality of the service provided will have increased as a result of the merger. This is most likely to take place when the disparity in size is marked. However, an interesting question is whether it also arises when both merger parties are large. In such circumstances, fees may rise due to market forces or product differentiation or fall due to economies of scale and/or scope (Francis, et. al., 1999). This leads us to our second research ques-tion:
EQ2: What are the fee effects for clients of audit firms merging with larger audit firms?
We test EQ2 in two ways. First, we run panel audit fee regressions for the sub-sample of compa-nies whose auditors were involved in mergers. Following Firth and Lau (2004), we examine audit pricing over three time intervals: three years be-fore the merger; the year of the merger, and three years subsequent to the merger. For the first three mergers, we also examine pricing over different event windows because the choice of appropriate window is not obvious, a priori. For the Deloitte-Andersen transaction, in 2002 we use only one post-transaction observation because of the lack of available data at the time of collection. Audit fee differences between the combining firms are cap-tured using a series of dummy variables.
To capture audit fee variation for the Arthur Young and Ernst and Whinney merger in 1989, we restrict our sample to Arthur Young, Ernst and Whinney, and Ernst and Young clients. In other words, an auditee must have been both a post-merger client of Ernst and Young and also a pre-merger client of eitherArthur Young or Ernst and Whinney.8Similarly, to model audit fee variation for the Coopers and Lybrand and Deloitte, Haskins and Sells 1990 merger, we restrict our sample to Coopers and Lybrand, Deloitte, Haskins and Sells and Coopers and Lybrand Deloitte clients. To be included in the sample, a company must have been both a pre-merger client of Deloitte, Haskins and Sells or Coopers and Lybrand and a post-merger client of Coopers and Lybrand Deloitte. To capture audit fee variation for the Price Waterhouse and Coopers and Lybrand 1997 merger, we restrict our
sample to Price Waterhouse, Coopers and Lybrand and PricewaterhouseCoopers clients, with sample firms having to be both pre- and post-merger clients of these firms. Finally, for the Deloitte-Andersen 2002 transaction, we restrict our sample to clients that before the transaction were audited by either Deloitte and Touche or Andersen and afterwards by the new Deloitte firm.
Based on the research design in Firth and Lau (2004), we use the following generic regression model to test how audit prices were affected by merger activity:
As before, LAF is the natural logarithm of total audit fees (£000) and includes both pre- and post-merger observations; EWpre, PostEY, EYmerge, CLpre, PostCLD, CLDmerge, PWpre, PostPWC, PWCmerge, DTpre, PostD and Dmerge are di-chotomous treatment variables. EWpre is set equal to 1 if the observation is prior to the merger and the auditor is Ernst and Whinney; if the auditor prior to the merger is Arthur Young or the observation is after the merger then EWpre is 0. PostEY is set equal to 1 for a post-merger observation and 0 oth-erwise. EYmerge is set equal to 1 for a post-merg-er obspost-merg-ervation whpost-merg-ere the client was originally audited by Ernst and Whinney and 0 otherwise. CLpre is set equal to 1 if the observation is prior to the merger and the auditor at that time is Coopers and Lybrand and 0 otherwise. PostCLD is set equal to 1 for a post-merger observation and 0 oth-erwise. CLDmerge is set equal to 1 if the observa-tion is after the merger and the original auditor was Coopers and Lybrand and zero otherwise. PWpre is set equal to 1 if the observation is prior to the merger and the auditor at that time is Price Waterhouse and 0 otherwise. PostPWC is set equal to 1 for a post-merger observation and 0 otherwise. PWCmerge is set equal to 1 if the observation is after the merger and the original auditor was Price Waterhouse and zero otherwise. DTpre is set equal to 1 if the observation is prior to the transaction and the auditor at that time is Deloitte and Touche and 0 otherwise. PostD is set equal to 1 for a post-transaction observation and 0 otherwise. Finally, Dmerge is set equal to 1 if the observation is after the transaction and the original auditor was Deloitte and Touche and zero otherwise. The first subscript, 2, signifies that the regression is based on equation (2), the second subscript, i, refers to firm-year, ε2,i is the regression residual and
Controls is the vector of the same control variables
Vol. 37 No. 4. 2007 305
8We exclude clients of other auditors who switched to the
combined Ernst and Young firm after the merger and pre-merger clients of either Arthur Young or Ernst and Whinney who defected to other audit firms. A problem with this design is that we might observe fee cutting by the non-defecting clients caused by their demanding a reward for staying loyal. This does not, however, affect what is of primary interest in our study, namely, the relative changes in the fees of clients of the combining audit firms. As we explain later, our models es-timated across the full sample of audit clients circumvent the latter problem.
as specified for model 1.
The logic underlying this research design is as follows. A positive β2,1coefficient captures any pre-mium that Ernst and Whinney earned over Arthur Young prior to the merger. A positive β2,2 coeffi-cient indicates the increase in fees experienced by Arthur Young clients following the merger and β2,2
+β2,3 is the corresponding increase for Ernst and Whinney clients. Thus a positive β2,3 coefficient captures the additional post-merger premium paid by clients originally audited by Ernst and Whinney. Similarly, a positive β2,4 coefficient captures any premium that Coopers and Lybrand earned prior to the merger, a positive β2,5coefficient estimates the post-merger premium paid by continuing Deloitte, Haskins and Sells clients and a positive β2,6 coeffi-cient measures any incremental post-merger premi-um of the Coopers and Lybrand clients. β2,7
captures any premium that Price Waterhouse earned prior to the merger, β2,8 the post-merger premium paid by continuing Coopers and Lybrand clients
and β2,9 any incremental post-merger premium of the Price Waterhouse clients. β2,10 captures any premium that Deloitte and Touche earned prior to the transaction, β2,11 the post-transaction premium paid by continuing Andersen clients and β2,12any incremental post-transaction premium of the Deloitte and Touche clients.
One limitation of the Firth and Lau (2004) methodology is that merger-induced audit fee changes cannot be distinguished from fee varia-tions across the entire audit market. We circumvent this problem by investigating audit pricing for the clients of the firms involved in the four mergers andthose that were excluded from merger activity. We do this by running a pooled model that contains the previous control variables, a non-brand name firm dummy and dichotomous variables indicating whether the observations relate to a firm that was involved in the mergers. The advantages of this de-sign is that it controls for omitted factors that might confound the results and allows one to see how any merger-related premium varies vis-à-vis the firm
306 ACCOUNTING AND BUSINESS RESEARCH
Table 2
Definitions of the variables used in the real audit-pricing model (4)
Variable Definition
EWpre 1 if the observation is prior to the merger and Ernst and Whinney are the auditors and Ernst and Young audit the client after the merger, 0 otherwise.
AYpre 1 if the observation is prior to the merger and Arthur Young are the auditors and Ernst and Young audit the client after the merger, 0 otherwise.
EYpost 1 if the auditor prior to the merger is Ernst and Whinney, the observation is after the merger and Ernst and Young audit the client, 0 otherwise.
CLpre 1 if the observation is prior to the merger and Coopers and Lybrand are the auditors and Coopers and Lybrand Deloitte audit the client after the merger, 0 otherwise.
DHSpre 1 if the observation is prior to the merger and Deloitte, Haskins and Sells are the auditors and Coopers and Lybrand Deloitte audit the client after the merger, 0 otherwise.
CLpost 1 if the auditor prior to the merger is Coopers and Lybrand, the observation is after the merger and Coopers and Lybrand Deloitte audit the client, 0 otherwise.
PWpre 1 if the observation is prior to the merger and Price Waterhouse are the auditors and PricewaterhouseCoopers audit the client after the merger, 0 otherwise.
Cpre 1 if the observation is prior to the merger and Coopers and Lybrand are the auditors and PricewaterhouseCoopers audit the client after the merger, 0 otherwise.
PWCpost 1 if the auditor prior to the merger is Price Waterhouse, the observation is after the merger and PricewaterhouseCoopers audit the client, 0 otherwise.
Dpre 1 if the observation is prior to the transaction and Deloitte and Touche are the auditors and Deloitte audit the client after the transaction, 0 otherwise.
Apre 1 if the observation is prior to the transaction and Andersen are the auditors and Deloitte audit the client after the transaction, 0 otherwise.
Dpost 1 if the auditor prior to the transaction is Deloitte and Touche, the observation is after the trans-action and Deloitte audits the client, 0 otherwise.
NBF 1 if a non brand-name firm audits the client, 0 otherwise.
that was not involved in merger activity with one of its international counterparts (KPMG). One prob-lem with running a pooled estimation across the ex-tended (1985–2002) time frame is that audit fees may increase significantly due to the effects of gen-eral price inflation. Following Pong (2004), we ac-count for inflationary driven audit fee changes using measures of the retail price index to adjust the nominal audit fees into real audit fees based on the month of the company’s financial year-end. Differences in real audit fees are captured using the following model:
LRAF is the natural logarithm of real (inflation adjusted) audit fees (£000) and other variables are as defined before (see Table 2).
4. Data collection
The data were taken from a population of 1,596 UK companies listed on both the London Stock Exchange and the Standard and Poor’s Global Vantage database. Our final sample consists of a wide range of clients that reported data on the Global Vantage, Thomson Analytics Worldscope Datastream International, Extel Company Research databases and the International Stock Exchange Yearbook. Data on total assets, debt, earnings be-fore interest and tax, financial year-end, quick ratio, current ratio, operating profit and industry listing code data were collected for the period 1985–2002 from the Global Vantage and Thomson Analytics Worldscope databases. Audit data were collated from the Datastream International, Extel Company Research and Thomson Analytics Worldscope databases. Subsidiary and auditor identity data were hand collected from hard copies of the International Stock Exchange Yearbook and published annual reports. We eliminated financial firms from the analysis because of lack of compa-rability with non-financial firms’ financial state-ments and because the cost structure of audits in financial firms differs significantly from those of industrials. Extreme observations in the top and bottom percentiles of total assets, total debt, oper-ating profit, pre-tax profits, earnings before inter-est and tax and audit fees were eliminated from the sample.9The final sample comprises 7,255 firm-year observations covering the period 1985–2002. Consistent with other studies, the models in-clude logarithmic or square root transformations of the value of audit fees, total assets and
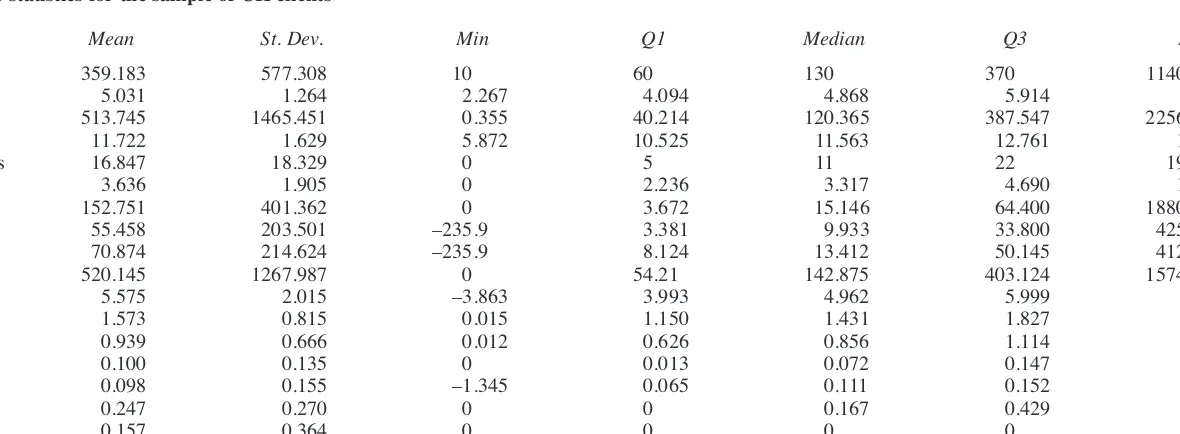
sub-sidiaries variables, as appropriate. This mitigates the possibility that large auditees will dominate the results. Table 3 presents descriptive statistics and shows how these transformation procedures re-duced the extent of skewness in the distribution of the assets, debt and earnings variables.
Untabulated Pearson correlation coefficients are mostly insignificant. In relation to the explanatory variables, the correlation coefficients between Current and Quick (0.69) and between LTA and Sub (0.59) are the only ones of any magnitude. However, untabulated variance inflation factors were all lower than the conventional cut-off point of 10, suggesting that it is unlikely that multi-collinearity materially affects our findings.
5. Results
5.1. Descriptive statistics
Market share estimates based on the number of audit clients (CRn, CR4 and H) from 1985 to 2002 are reported in Table 4. Between 1985 and 2002, CRn increased from 65% to 83%, CR4 from 45% to 80% and H from 13% to 22% based on the num-ber of audit clients. Using the audit fee as a meas-urement basis, CRn increased from 77% to 95%, CR4 from 59% to 88% and H from 13% to 23% over the same period.
As a basis of comparison, the Herfindahl find-ings for 2002 are equivalent to a market of just over four firms of equal size and are even larger than the levels identified in the prior UK literature (9.6%, Moizer and Turley, 1989: 45; 16.97%, Pong, 1999: 472) as signifying a tight oligopolistic market structure.10 Concentration ratios increased rapidly around the time of the Big Firm mergers and reached levels in 2002 that suggest that that the potential for price collusion is high. Unreported auditor market shares across four quartiles defined by client size indicate that con-centration is an increasing function of client size. The high and increasing levels of concentration based on numbers of audit clients and on fee rev-enues suggest that that the potential for price col-lusion is particularly high in the largest client segment. The issue we turn to next is the impact this industry consolidation had on the relative rankings of audit firms.
Rankings of the audit firms based on estimated
Vol. 37 No. 4. 2007 307
9However, the key results are not materially different
re-gardless of whether the extreme observations are Winsorised or included in the sample.
10We use the Parker (1991) methodology to compare the
observed concentration ratios with their corresponding critical concentration ratios. Consistent with Willekens and Achmadi (2003: 441), we compute the 5% critical levels to determine whether the market is significantly concentrated. We find that statistically significant concentration ratios are observed for CRnin 1988 and from 1992–1998 and for CR4 in 1985, 1986,
1988 and 1999–2000.
308
A
CCO
U
N
T
IN
G
A
N
D
BU
S
IN
E
S
S
RE
S
E
A
RCH
Table 3
Descriptive statistics for the sample of UK clients
Variable Mean St. Dev. Min Q1 Median Q3 Max
Audit fee 359.183 577.308 10 60 130 370 11400
LAF 5.031 1.264 2.267 4.094 4.868 5.914 9.341
Total assets 513.745 1465.451 0.355 40.214 120.365 387.547 22565
LTA 11.722 1.629 5.872 10.525 11.563 12.761 18.846
Subsidiaries 16.847 18.329 0 5 11 22 196
Sub 3.636 1.905 0 2.236 3.317 4.690 14
Total debt 152.751 401.362 0 3.672 15.146 64.400 18800
Op. profit 55.458 203.501 –235.9 3.381 9.933 33.800 4252.000
EBIT 70.874 214.624 –235.9 8.124 13.412 50.145 4120
Revenue 520.145 1267.987 0 54.21 142.875 403.124 15742
LREV 5.575 2.015 –3.863 3.993 4.962 5.999 9.664
Current 1.573 0.815 0.015 1.150 1.431 1.827 8.987
Quick 0.939 0.666 0.012 0.626 0.856 1.114 8.864
DTA 0.100 0.135 0 0.013 0.072 0.147 3.612
ROI 0.098 0.155 –1.345 0.065 0.111 0.152 0.692
Foreign 0.247 0.270 0 0 0.167 0.429 1
Loss 0.157 0.364 0 0 0 0 1
YE 0.691 0.472 0 0 1 1 1
Audit Fee = Fee relating to the audit (£000); LAF = natural logarithm of the audit fee (£000); Total Assets = Total assets (£m); LTA = natural logarithm of total assets (£m); Subsidiaries = Number of domestic subsidiaries; Sub = square root of the number of subsidiaries; Total Debt = Total debt (£m); Op. profit = Operating profit (£m); EBIT = Earnings before interest and tax (£m); Revenue = Total sales revenue (£000); LREV = natural logarithm of total sales revenue (£000); Current = ratio of current assets to current liabilities; Quick = ratio of current assets less stock to current liabilities; DTA= ratio of long-term debt to total assets; ROI = ratio of earnings before in-terest and tax to total assets; Foreign = proportion of subsidiaries that are foreign operations; Loss = 1 if an operating loss was reported in any one of the prior three years, 0 otherwise; YE = 1 if the accounting year-end is between December and March, 0 otherwise.
V
ol
. 37 N
o. 4. 2007
309
Table 4
Auditor concentration ratios based on (a) the number of audit clients and (b) the fee
CRs based on number of audit clients CRs based on audit fee
Number of Number of
Year large firms observations CRn CR4 H CRn CR4 H
1985 8 225 0.65 0.45 0.13 0.77 0.59 0.13
1986 8 288 0.65 0.45 0.12 0.77 0.57 0.11
1987 8 358 0.66 0.44 0.11 0.81 0.59 0.13
1988 8 430 0.69 0.48 0.12 0.81 0.59 0.12
1989 7 446 0.71 0.49 0.12 0.81 0.57 0.12
1990 6 473 0.72 0.55 0.13 0.81 0.71 0.14
1991 6 496 0.73 0.56 0.13 0.82 0.72 0.16
1992 6 488 0.76 0.55 0.13 0.88 0.76 0.17
1993 6 488 0.77 0.56 0.14 0.89 0.79 0.18
1994 6 461 0.79 0.58 0.14 0.89 0.78 0.18
1995 6 485 0.80 0.61 0.14 0.90 0.80 0.18
1996 6 442 0.81 0.61 0.16 0.94 0.86 0.22
1997 5 421 0.84 0.61 0.16 0.93 0.86 0.23
1998 5 387 0.84 0.69 0.15 0.96 0.82 0.21
1999 5 361 0.84 0.79 0.21 0.95 0.88 0.28
2000 5 343 0.84 0.78 0.22 0.95 0.87 0.26
2001 5 354 0.83 0.76 0.20 0.94 0.85 0.24
2002 4 309 0.83 0.80 0.22 0.95 0.88 0.23
The table shows the number of large accounting firms and the mean values of the n firm concentration ratio, the four firm concentration ratio and Herfindahl index based on the number of audit clients and the fees relating to the audit of the accounting firms. The table documents concentration ratios from 1985 to 2002 (7,255 observations). The concentration ratio is defined as
,
and the Herfindahl Index as
where n is the number of large audit firms, M is the total number of firms in the market and Siis the size of audit firm i as a percentage of the size of the market.
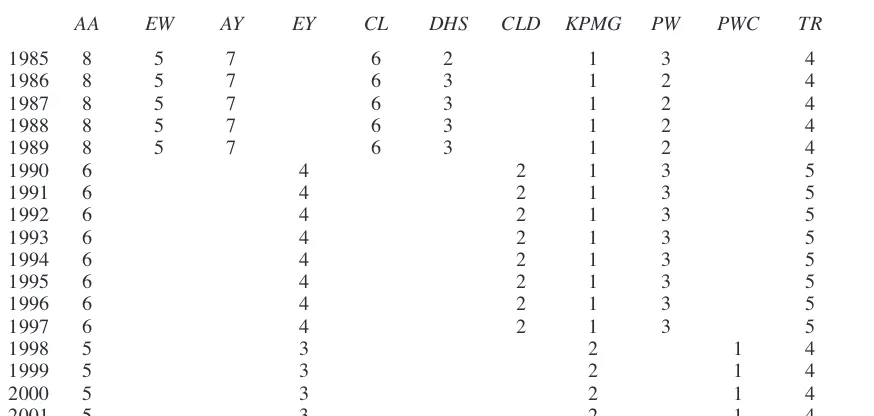
market share of audit fees are reported in Table 5. The leading four firms in 1985 were Peat Marwick, Deloitte Haskins and Sells, Price Waterhouse and Touche Ross. Consistent with Moizer (2005), we find that Deloitte Haskins and Sells and Ernst and Whinney had larger market shares than Coopers and Lybrand and Arthur Young respectively in 1987 and the Big Six mergers increased the market share of the merging firms to produce a new top four of KPMG, Coopers and Lybrand, Price Waterhouse and Ernst and Young. A substantial in-crease in market share of PricewaterhouseCoopers following the 1997 merger helped that firm to be-come the leading audit firm. The Andersen transac-tion resulted in a revised top four comprising PricewaterhouseCoopers, KPMG, Deloitte and Ernst and Young.
5.2 Monopolistic or competitive pricing
We now turn our attention to the effect industry restructuring had on the pricing of audit services.
The mean parameter estimates and t-statistics taken from the cross-section regressions are docu-mented in the following tables for the areas of in-terest. The t-statistics are estimated using the White (1980) procedure because there is some ev-idence of heteroskedasticity. We show in bold type the coefficients that are significant at the 5% level or better. In all of the regressions, the models are significant at the p<0.01 level, exhibit strong ex-planatory power (R2 generally around 70%), and the control variables possess the anticipated signs and are significant at the p<0.05 level (except Loss and ROI, which are sometimes insignificant).
Since concentration levels appear to have reached record levels by the end of the sample pe-riod, we investigate whether the mergers resulted in the Big Firms charging higher audit fees than their smaller counterparts and if so whether this is due to product differentiation or monopolistic pric-ing. Evidence that the audit firms were charging
310 ACCOUNTING AND BUSINESS RESEARCH
Table 5
Audit firm rankings based on UK fees relating to the audit
AA EW AY EY CL DHS CLD KPMG PW PWC TR D
1985 8 5 7 6 2 1 3 4
1986 8 5 7 6 3 1 2 4
1987 8 5 7 6 3 1 2 4
1988 8 5 7 6 3 1 2 4
1989 8 5 7 6 3 1 2 4
1990 6 4 2 1 3 5
1991 6 4 2 1 3 5
1992 6 4 2 1 3 5
1993 6 4 2 1 3 5
1994 6 4 2 1 3 5
1995 6 4 2 1 3 5
1996 6 4 2 1 3 5
1997 6 4 2 1 3 5
1998 5 3 2 1 4
1999 5 3 2 1 4
2000 5 3 2 1 4
2001 5 3 2 1 4
2002 4 2 1 3
The table shows the rankings of the large accounting firms based on the fees relating to the audit from 1985 to 2002. Firms are defined using their UK names in the year in question.
AA: Andersen (including its previous depiction of Arthur Andersen). EW: Ernst and Whinney.
AY: Arthur Young.
EY: Ernst and Young (created by the merger of Arthur Young and Ernst and Whinney). CL: Coopers and Lybrand.
DHS: Deloitte Haskins and Sells.
CLD: Coopers and Lybrand (created by the merger of Coopers and Lybrand with Deloitte Haskins and Sells). KPMG: KPMG (including its previous depictions such as Peat Marwick).
PW: Price Waterhouse.
PWC: PricewaterhouseCoopers (created by the merger of Price Waterhouse with Coopers and Lybrand). TR: Touche Ross.
D: Deloitte (created when the majority of Andersen’s clients were subsumed into the firm Deloitte and Touche).
premium fees in a saturated market segment would be of interest to regulators, because this might be a sign of anti-competitive pricing policies. We first address this possibility by running model 1 across sub-samples partitioned across the quartile values of the size of the client for the years of the Big Firm mergers and each of the sub-periods where there were eight, six, five and four dominant ac-counting firms. The results of these estimations are presented in Table 6.
The brand name premium is statistically signifi-cant in 1985–1988 for most partitions and bigger for the two largest audit client quartiles, consistent with larger clients being willing to pay more for auditor reputation in this period. This pattern breaks down following the mergers in subsequent periods. The brand name premium is statistically significant for clients in the smallest quartile (the competitive benchmark) in 1985–1989 (17.4%) 1991–1996 (8.8%) and 1998–2001 (29.7%). The brand name premium is insignificant for clients in the smallest quartile in 1989–1990 and 1997 and is significant and negative in 2002 (consistent with a highly competitive market). Similarly, for compa-nies in the second largest quartile, significant brand name returns are observed in 1985–1988 (11.5%), 1989–1990 (23.0%), 1991–1996 (22.2%), 1998–2001 (39.8%) and 2002 (87.8%). Significant brand name returns are observed for the subsample of companies in the third largest quartile in 1985–1988 (20.8%) and 1991–1996 (25.8%). For the largest quartile of companies, the brand name premium is statistically significant for 1985–1988 (37.1%) and 1991–1996 (32.6%). The statistically significant negative coefficients on Brand indicate that the audit fees paid to the Big Firms by the largest quartile of clients were signif-icantly lower than those paid to their smaller coun-terparts in 1998–2001 (37.3%) and 2002 (53.6%). If audit firms were engaging in anti-competitive pricing strategies, we would expect to see the strongest growth in brand name premia following mergers amongst client groups most willing to pay for reputation. Our mixed results in relation to client size suggest that willingness to pay a brand premium is not an increasing function of client size. Our findings indicate that subsequent to the Big Six mergers, the brand name premium increas-es for mid-sized clients (i.e. those in the second and third size quartiles) but falls in the quartiles containing the smallest (competitive benchmark) and largest companies. The brand name premium also increases for clients of below median size and falls for above-average sized clients following the PricewaterhouseCoopers merger. The picture is even more complex following the Deloitte-Andersen transaction, where the premium falls for the smallest and largest client quartiles but increas-es for those in the second quartile. Following the
combinations, the brand name premium increases for companies in the second quartile but is volatile for all other quartiles. This pattern of results ap-pears to be more consistent with the explanation that audit firms engage in product differentiation rather than anti-competitive pricing strategies. In other words, price increases occurred only where the mergers enabled the Big Firms to create new products or services that were more appealing to particular segments of the audit market. Our re-sults suggest that such market segmentation is only loosely related to the size of the client.
5.3 The effect of mergers on audit fees
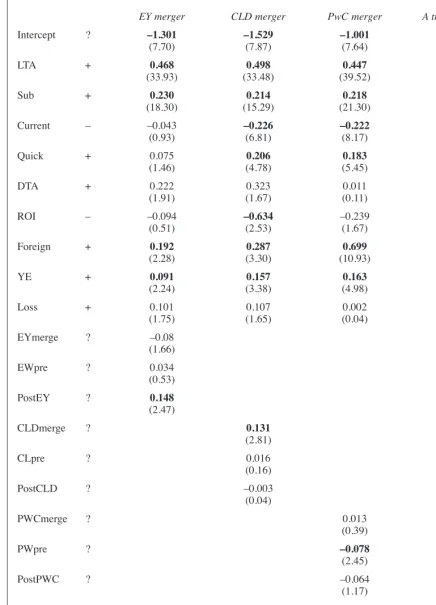
The results obtained by estimating equation (2) for the restricted sample of audit clients of firms involved in mergers three years before, the year of and three years11 subsequent to the combinations are documented in Table 7. These regressions are all significant at p<0.01, have strong explanatory power (R2of 81%–85%) and the control variables exhibit the expected signs. The results reported in the third column of Table 7 are estimated using the sub-sample of 350 client-year observations relat-ing to audits conducted by either Arthur Young or Ernst and Whinney before the merger, and by the new Ernst and Young firm after the merger. The coefficient of 0.148 on PostEY is positive and sig-nificant (p<0.05), consistent with Arthur Young clients paying a fee increase of the order of 16% after the merger. EYmerge is negative but insignif-icant, suggesting little or no change in the audit fees of former Ernst and Whinney clients after the merger. EWpre is positive but not statistically sig-nificant, suggesting no systematic difference in audit fees paid by Ernst and Whinney clients from those paid by the clients of Arthur Young prior to the merger. These findings suggest that the merger eliminated the audit fee premium of Ernst and Whinney over Arthur Young. The results are con-sistent with Baskerville and Hay’s (2006) argu-ment that the combination was effectively a takeover by the larger firm (Ernst and Whinney in the UK), and with the proposition that the merger improved the reputation of Arthur Young based on the rankings reported in Table 5 and in Moizer (2005).
The results reported in the fourth column of Table 7 are estimated using the sub-sample of 532 client-year observations relating to audits conduct-ed by Coopers and Lybrand or Deloitte, Haskins and Sells before the merger, and by the new Coopers and Lybrand Deloitte firm after the merg-er. The coefficient on CLpre is not statistically sig-nificant, a finding consistent with Cooper and Lybrand clients and Deloitte, Haskins and Sells
Vol. 37 No. 4. 2007 311
11One year for the Deloitte combination, due to a lack of
data.
312
A
CCO
U
N
T
IN
G
A
N
D
BU
S
IN
E
S
S
RE
S
E
A
RCH
Table 6
OLS regression models of log fees against brand name dummies for sub samples partitioned by client size in the pre- and post-merger periods surrounding the mergers
LAF= α1,0+ β1,1Controls +β1,2Brand + ε1,i (1)
Years / State of market 1985–1988 / Eight Big Firms
Sub-sample Smallest Second Third Largest
LTA LTA<10.525 10.524<LTA<=11.563 11.563<LTA<=12.761 LTA>12.761
Brand 0.160 0.109 0.189 0.315
(2.66) (1.73) (2.22) (2.49)
Premium 0.174 0.115 0.208 0.371
N 325 325 325 326
F 25.53a 31.84a 20.66a 14.01a
Adj R2 0.70 0.71 0.70 0.69
Years / State of market 1989–1990 / Big Six Mergers
Sub-sample Smallest Second Third Largest
LTA LTA<10.525 10.524<LTA<=11.563 11.563<LTA<=12.761 LTA>12.761
Brand 0.084 0.206 0.091 0.289
(1.21) (2.91) (0.80) (1.77)
Premium 0.088 0.230 0.095 0.335
N 229 230 230 230
F 23.57a 26.90a 11.50a 10.34a
Adj R2 0.75 0.82 0.58 0.61
Years / State of market 1991–1996 / Six Big Firms
Sub-sample Smallest Second Third Largest
LTA LTA<10.525 10.524<LTA<=11.563 11.563<LTA<=12.761 LTA>12.761
Brand 0.084 0.206 0.229 0.282
(2.24) (4.39) (3.50) (2.69)
Premium 0.088 0.222 0.258 0.326
N 715 715 715 715
F 88.69a 66.64a 48.71a 47.65a
Adj R2 0.81 0.80 0.72 0.73
asignificant at the 1% level. The coefficients shown in bold are significant at the 5% level or lower.
The dependent variable is the natural logarithm of audit fees.
The first row shows the parameter estimate and the second row the t-statistic (two-tailed) for each variable. The expected sign is positive. Brand = 1 if Big Firm auditor, 0 otherwise.
V
ol
. 37 N
o. 4. 2007
313
Table 6
OLS regression models of log fees against brand name dummies for sub samples partitioned by client size in the pre- and post-merger periods surrounding the mergers (continued)
LAF= α1,0+ β1,1Controls +β1,2Brand + ε1,i (1)
Year / State of market 1997 / PwC Merger
Sub-sample Smallest Second Third Largest
LTA LTA<10.525 10.524<LTA<=11.563 11.563<LTA<=12.761 LTA>12.761
Brand 0.115 0.002 0.175 0.097
(0.86) (0.01) (0.65) (0.27)
Premium 0.123 0.012 0.192 0.102
N 105 105 106 105
F 19.54a 12.57a 28.71a 13.51a
Adj R2 0.88 0.70 0.72 0.84
Years / State of market 1998–2001 / Five Big Firms
Sub-sample Smallest Second Third Largest
LTA LTA<10.525 10.524<LTA<=11.563 11.563<LTA<=12.761 LTA>12.761
Brand 0.260 0.334 0.053 –0.467
(3.14) (3.63) (0.49) (2.60)
Premium 0.297 0.398 0.055 –0.373
N 361 361 361 362
F 13.99a 17.14a 20.01a 56.12a
Adj R2 0.67 0.74 0.76 0.86
Year / State of market 2002 / Andersen transaction
Sub-sample Smallest Second Third Largest
LTA LTA<10.525 10.524<LTA<=11.563 11.563<LTA<=12.761 LTA>12.761
Brand –0.383 0.761 0.515 –0.768
(1.01) (2.50) (0.88) (2.55)
Premium –0.318 0.878 0.674 –0.536
N 77 77 77 78
F 13.19a 16.41a 11.71a 16.65a
Adj R2 0.88 0.83 0.74 0.88
asignificant at the 1% level. The coefficients shown in bold are significant at the 5% level or lower.
The dependent variable is the natural logarithm of audit fees.
The first row shows the parameter estimate and the second row the t-statistic (two-tailed) for each variable. The expected sign is positive. Brand = 1 if Big Firm auditor, 0 otherwise.
clients paying similar fees before the merger. The coefficient on PostCLD is also not statistically sig-nificant, implying that the clients of Deloitte, Haskins and Sells did not suffer a fee increase after the merger. However, the coefficient for CLDmerge is positive and significant (p<0.01) and converts to a 14% post-merger premium paid by Cooper and Lybrand clients. We interpret this as evidence that the brand name reputation of Coopers and Lybrand increased after the merger. This interpretation is consistent with Table 5 and the Moizer (2005) rankings of Deloitte, Haskins and Sells and Coopers and Lybrand.
The results documented in the fifth column of Table 7 are estimated using the sub-sample of 978 client-year observations relating to audits con-ducted by Price Waterhouse or Coopers and Lybrand before the merger and by the new PricewaterhouseCoopers firm after the merger. PWpre is negative and significant at p<0.05, sug-gesting that Price Waterhouse clients paid less for audit services than clients of Coopers and Lybrand before the merger. The coefficient of –0.078 corre-sponds to a 7.8% discount. The coefficient on PostPWC is not significant, indicating that Coopers and Lybrand clients did not suffer a post-merger fee increase. PWCmerge is not statistically significant, consistent with Price Waterhouse clients not paying more than did Coopers and Lybrand clients after the merger. These results sug-gest that the merger eliminated the significant dis-count offered to Price Waterhouse clients relative to Coopers and Lybrand clients. Consistent with the rankings documented in Moizer (2005) and Table 5, these findings suggest that the reputation of Price Waterhouse increased relative to Coopers and Lybrand when Price Waterhouse merged with the larger firm.
The results presented in the final column of Table 7 are estimated using a sub-sample of 117 client-year observations relating to audits conduct-ed by Deloitte and Touche or Andersen before the transaction and by the new Deloitte firm after the transaction. For this combination, we modelled audit fees one year preceding and one year after the transaction because of the lack of availability of more recent data at the time of collection. Dmerge, DTpre and PostD are not significantly different from zero. Subject to the aforementioned caveat, this transaction does not seem to have had any material audit pricing effects. The two firms seem to have been on a similar footing prior to the transaction. The finding that the Dmerge coeffi-cient is also insignificant suggests that Deloitte and Touche’s reputation did not suffer as a result of the Andersen transaction.
Finally, the results of our OLS merger estimation using inflation adjusted variables for the full sam-ple of audit clients (model 3) are documented
in Table 8. This regression is highly significant (p<0.01), has strong explanatory power (adjusted R2 of 80%) and the control variables exhibit the expected signs. The coefficient of –0.165 for the NBF variable is significant at p<0.05, consistent with audit clients receiving a 15% discount rela-tive to the benchmark firm (KPMG). The coeffi-cient of 0.125 for the EYpost variable is statistically significant at p<0.05, consistent with Ernst and Young clients accepting a 13% increase in fees after the merger vis-à-vis the benchmark firm. The coefficient of 0.143 for the CLpost vari-able is statistically significant (p<0.01), implying that the clients of Coopers and Lybrand accepted a 15% fee increase after the merger. The coefficient of –0.108 for the Apre variable is significant at p<0.05, suggesting that Andersen clients paid 10% less for audit services than the benchmark firm. These results are consistent with our earlier find-ings of product differentiation amongst the inter-national accounting firms. The coefficients for the EWpre, AYpre, CLpre, DHSpre, PWpre, Cpre, PWCpost, Dpost and Dpre variables are all in-significant, suggesting that they paid similar audit fees to the benchmark firm.
5.4. Sensitivity checks
A series of sensitivity checks were performed to test the robustness of our findings. The results are not sensitive to the number of accounting firms used to measure concentration or the number of client size partitions created. Estimating model (1) across loss making and non-loss-making sub-sam-ples provides a means of testing the sensitivity of the fee discounting findings to the financial per-formance of clients. We also sequentially excluded firms from model 1 to test whether one or a group of accounting firms might drive the results. Untabulated results indicate that the findings are not sensitive to client profitability or auditor size. We also varied the event window for model (3) using data for one, two, three and four years before and after the mergers, but results were not materi-ally different. We tested the robustness of our find-ings to model specification by running the alternative estimations suggested by Firth and Lau (2004). Finally we ran two sets of regressions for the clients of merging firms before the mergers and for the same clients after the mergers. The general finding of these sensitivity checks is that our results are not materially affected by model specification.
6. Summary and conclusions
This paper contributes to the literature by investi-gating the relationship between market concentra-tion, accounting firm mergers and audit fee levels. We find that concentration ratios increased be-tween 1985 and 2002 to levels that exceed those
314 ACCOUNTING AND BUSINESS RESEARCH
Vol. 37 No. 4. 2007 315
Table 7
OLS Audit fee regression models of log fees against dummies for clients of audit firms that have merged over the sub-periods pre- and post- each merger
EY merger CLD merger PwC merger A transaction
Intercept ? –1.301 –1.529 –1.001 –1.493
(7.70) (7.87) (7.64) (6.76)
LTA + 0.468 0.498 0.447 0.512
(33.93) (33.48) (39.52) (25.40)
Sub + 0.230 0.214 0.218 0.187
(18.30) (15.29) (21.30) (12.53)
Current – –0.043 –0.226 –0.222 –0.303
(0.93) (6.81) (8.17) (5.95)
Quick + 0.075 0.206 0.183 0.363
(1.46) (4.78) (5.45) (5.12)
DTA + 0.222 0.323 0.011 0.093
(1.91) (1.67) (0.11) (0.38)
ROI – –0.094 –0.634 –0.239 –1.085
(0.51) (2.53) (1.67) (5.60)
Foreign + 0.192 0.287 0.699 0.534
(2.28) (3.30) (10.93) (7.16)
YE + 0.091 0.157 0.163 0.038
(2.24) (3.38) (4.98) (0.74)
Loss + 0.101 0.107 0.002 0.108
(1.75) (1.65) (0.04) (1.62)
EYmerge ? –0.08
(1.66)
EWpre ? 0.034
(0.53)
PostEY ? 0.148
(2.47)
CLDmerge ? 0.131
(2.81)
CLpre ? 0.016
(0.16)
PostCLD ? –0.003
(0.04)
PWCmerge ? 0.013
(0.39)
PWpre ? –0.078
(2.45)
PostPWC ? –0.064
(1.17)
Dmerge ? 0.015
(0.32)
DTpre ? 0.027
(0.52)
PostD ? –0.02
(0.39)
observed in the prior literature to form a tight oligopoly market structure. Increased levels of concentration seem to have reduced price compe-tition and our client-size-parcompe-titioned results sug-gest that this is due to product differentiation rather than anti-competitive pricing. The reduction in the number of top-tier audit firms has undoubt-edly reduced auditee choice and increased the po-tential for conflicts of interest. The international firms have shown little signs of a willingness to de-merge their audit activities and many multina-tional companies do not see the mid-tier firms as a viable auditor because of their limited resources. We believe that regulators should carefully consid-er what they would do in the event that one of the
Big Firms failed and a large corporation was forced to retain an audit firm because of the lack of available alternatives.
We also examine whether audit fee premiums or discounts are offered by international audit firms over their rivals and whether the pre-merger fee premiums of the stronger brand name auditor spread to the other auditor after a combination. Our results indicate that there are differences both within individual firms and across different firms in the pre- and post-merger levels of real and nom-inal audit fees. Looking first at nomnom-inal audit fees, we find that the Coopers and Lybrand Deloitte merger increased the audit fee premium of Coopers and Lybrand over the clients formerly
316 ACCOUNTING AND BUSINESS RESEARCH
Table 7
OLS Audit fee regression models of log fees against dummies for clients of audit firms that have merged over the sub-periods pre- and post- each merger(continued)
EY merger CLD merger PwC merger A transaction
N 350 532 978 117
F 304a 293a 533a 254a
R2 0.85 0.83 0.81 0.84
Model (2 EY merger):
LAFi= α2,0+ β2,1 EWprei+ β2,2 PostEYi+β2,3 EYmergei+β2,13 Controlsi+ ε2,i
Model (2 CLD merger):
LAFi= α2,0+ β2,4 CLprei+ β2,5 PostCLDi+β2,6 CLDmergei+β2,13 Controlsi+ ε2,i
Model (2 PwC merger):
LAFi= α2,0+ β2,7 PWprei+ β2,8 PostPWCi+β2,9 PWCmergei+β2,13 Controlsi+ ε2,i Model (2 D-A transaction):
LAFi= α2,0+ β2,10 DTprei+ β2,11 PostDi+β2,12 Dmergei+β2,13 Controlsi+ ε2,i
asignificant at the 1% level. The coefficients shown in bold are significant at the 5% level. The first figure in each panel shows the parameter estimate and the second figure the t-statistic (two-tailed) for each variable. The dependent variable is the natural logarithm of the audit fee. LTA= natural logarithm of total assets (£m); Sub = square root of the number of subsidiaries; Current = ratio of current assets to current liabilities; Quick = ratio of current assets less stock to current liabilities; DTA= ratio of long-term debt to total assets; ROI= ratio of earnings before interest and tax to total assets; Foreign = proportion of subsidiaries that are foreign operations; YE= 1 if the fiscal year-end is between December and March inclusive, 0 otherwise; Loss = 1 if an operating loss was reported in any of the prior three years, 0 otherwise;
EWpre = 1 if the observation is prior to the merger and the auditor is Ernst and Whinney, if the auditor prior to the merger is Arthur Young or the observation is after the merger then EWpre is 0; PostEY = 1 for a post-merger observation, 0 otherwise; EYmerge = 1 for a post-post-merger observation where the client was originally audited by Ernst and Whinney, 0 otherwise; CLpre = 1 if the observation is prior to the merger and the auditor at that time is Coopers and Lybrand, 0 otherwise; PostCLD = 1 for a post-merger observation, 0 otherwise; CLDmerge = 1 if the observation is after the merger and the original auditor was Coopers and Lybrand, 0 oth-erwise; PWpre = 1 if the observation is prior to the merger and the auditor at that time is Price Waterhouse, 0 otherwise; PostPWC = 1 for a post-merger observation, 0 otherwise; PWCmerge = 1 if the observation is after the merger and the original auditor was Price Waterhouse, 0 otherwise; DTpre = 1 if the observation is prior to the transaction and the auditor at that time is Deloitte and Touche, 0 otherwise; PostD = 1 for a post-transac-tion observapost-transac-tion, 0 otherwise; Dmerge = 1 if the observapost-transac-tion is after the transacpost-transac-tion and the original auditor was Deloitte and Touche, 0 otherwise.
audited by Deloitte. The Ernst and Young merger significantly increased the audit fees of former Arthur Young clients relative to those of Ernst and Whinney. The PricewaterhouseCoopers merger eliminated the discount offered by Price Waterhouse relative to Coopers and Lybrand clients. Finally, the Andersen transaction seems to have had no materi-al effect to date. These results are consistent with
the proposition that the brand name reputation of the smaller firms improved following the mergers with their larger counterparts. Finally, looking at real audit fees, we find that the Coopers and Lybrand Deloitte, Ernst and Young mergers and the Andersen transaction increased the audit fee premi-ums of Coopers and Lybrand and Ernst and Young and reduced the reputation problem associated with
Vol. 37 No. 4. 2007 317
Table 8
OLS Audit fee regression models of log real audit fees against audit-time identity dummies for all clients over the period 1985–2002
coefficient t-statistics
Intercept ? –1.286 (17.37)
EWpre ? –0.019 (0.23)
AYpre ? –0.038 (0.44)
EYpost ? 0.125 (2.06)
CLpre ? –0.099 (1.14)
DHSpre ? 0.039 (0.45)
CLpost ? 0.143 (2.74)
PWpre ? 0.057 (1.87)
Cpre ? 0.064 (1.70)
PWCpost ? 0.02 (0.68)
Dpre ? –0.057 (1.66)
Apre ? –0.108 (2.27)
Dpost ? –0.007 (0.22)
NBF – –0.165 (7.31)
N 7255
F 816a
R2 0.805
Model 3:
LRAFi= α3,0+ β3,1EWprei+ β3,2AYprei+ β3,3EYposti+ β3,4CLprei+ β3,5DHSprei+ β3,6CLposti + β3,7PWpre+ β3,8Cprei+ β3,9PWCposti+ β3,10Dprei+ β3,11Aprei+ β3,12Dposti+ β3,13NBFi + β3,14Controlsi+ ε3,i
asignificant at the 1% level. The coefficients shown in bold are significant at the 5% level. The first figure in each panel shows the parameter estimate and the second figure the t-statistic (two-tailed) for each variable. The dependent variable is the natural logarithm of the inflation adjusted (real) audit fee.
EWpre takes the value of 1 if the observation is prior to the merger and Ernst and Whinney are the auditors and Ernst and Young audit the client after the merger. AYpre takes the value of 1 if the observation is prior to the merger and Arthur Young are the auditors and Ernst and Young audit the client after the merger. EYpost takes the value of 1 if the auditor prior to the merger is Ernst and Whinney and Ernst and Young audit the client after the merger. CLpre takes the value of 1 if the observation is prior to the merger and Coopers and Lybrand are the auditors and Coopers and Lybrand Deloitte audit the client after the merger. DHSpre takes the value of 1 if the observation is prior to the merger and Deloitte, Haskins and Sells are the auditors and Coopers and Lybrand Deloitte audit the client after the merger. CLpost takes the value of 1 if the auditor prior to the merger is Coopers and Lybrand and Coopers and Lybrand Deloitte audit the client after the merger. PWpre takes the value of 1 if the observation is prior to the merger and Price Waterhouse are the auditors and PricewaterhouseCoopers audit the client after the merger. Cpre takes the value of 1 if the observation is prior to the merger and Coopers and Lybrand are the auditors and PricewaterhouseCoopers audit the client after the merger. PWCpost takes the value of 1 if the auditor prior to the merger is Price Waterhouse and PricewaterhouseCoopers audit the client after the merger. Dpre takes the value of 1 if the observation is prior to the transaction and Deloitte and Touche are the auditors and Deloitte audit the client after the transaction. Apre takes the value of 1 if the observation is prior to the transaction and Andersen are the auditors and Deloitte audit the client after the transaction. Dpost takes the value of 1 if the auditor prior to the transaction is Deloitte and Touche and Deloitte now audits the client. NBF takes the value of 1 if a non brand-name firm audits the client.