e-Journal of English Language Teaching Society (ELTS) Vol. 2 No. 1 2014 – ISSN 2331-1841 Page 1 SMA Negeri 5 Palu in writing simple cause and effect sentences through flow chart. The research usedtrue experimental research design. The population was the eleventh grade science major students and the sample was two parallel classes consisting 52 students. The data were collected through observation and tests: pre test and post test. The observation was conducted to get a picture of teaching and learning process in the classroom while the pre test and post test were used to find out the improvement of the students’ writing ability before and after the treatment. Based on the result of pre test and post test, the research found that the t-counted was 5.967. By applying 0.05 level of significance and the 27+25-2=50 degree of freedom through interpolation formula, it was found that t-table was 0.01. It showed that t-counted was higher than the t-table. In the other words, flow chart is effective to improve the ability of the eleventh grade students in writing simple cause and effect sentences.
Keywords: Improving; Writing Ability; Sentence; Cause effect; Flow Chart.
INTRODUCTION
Writing is a skill to express ideas, thoughts, and memories into written form, either in
the form of sentence, paragraph, or essay which needs some practice done step by step. As a
language skill, writing requires knowledge on language components such as vocabulary,
grammar, and other language skills. Writing can be done effectively through writing sentences,
paragraphs, or essay. The writing is also done by any student who learns English at some levels
of school in Indonesia. Galko (2002) asserts that writing is a lifelong skill used in school, at
1
Prodi Pendidikan Bahasa Inggris FKIP Universitas Tadulako - email: [email protected]
2
email: [email protected]
3
e-Journal of English Language Teaching Society (ELTS) Vol. 2 No. 1 2014 – ISSN 2331-1841 Page 2
work, and in our personal life. By writing, the students learn the process of expressing ideas,
opinions, feelings, and organize them in simple sentences or paragraphs as well.
In the context of learning English, writing seems to be more difficult for the students to
acquire than those of other language skills. Writing is a complex process of transferring ideas,
feelings, and thoughts into written form by giving more attention on the use of language as
correctly as possible. Writing is an essential tool for learning a discipline and helping students
improve their writing skill. Dietsch (2009) states that writing is the art of discovery. Rhetoric,
the art of writing effectively implies study and practice. For many students, getting started is
the hardest part in writing. They have to maintain ideas concerning with their writing task. For
example in writing sentence, the students need to get ideas before starting to write. Also, they
need to get concerned with making an effective sentence.
In the fact, most students who are considered in the eleventh grade ofSenior High
School still have problem in writing especially in getting the ideas and writing it into effective
sentences. They get lack of idea or limited knowledge about something that they want to write.
They do not know how to start the sentences. These problems may stop their desire and even
their enthusiasm to keep trying in writing. One way to develop effective sentences is by stating
an effect or cause and reasoning how or why the effect or the cause occurs (Karim and
Rachmadie, 1996). The details of cause and effect sentences explain or demonstrate how one
event or set of circumstances leads to, or causes, another event. Therefore, the ideas in writing
cause and effect sentences must flow in logical sentence that link up so the readers are not
conscious of gaps.
In relation to these, some strategies may be used for the students to quickly get many
ideas as they can and save their time for the later stages in the process of writing. Students may
use brainstorming, mapping, listing, or flow chart. These strategies include as graphic
organizers. Thompson (2004) explains that graphic organizers help students comprehend
information through visual representation of ideas or relationships. Graphic organizers turn the
abstract concepts into concrete visual representation.
One possible strategy that can be chosen to activate the students’ ideas or their prior
knowledge before writing sentences is by using chart. Galko (2002) confirms that using chart is
e-Journal of English Language Teaching Society (ELTS) Vol. 2 No. 1 2014 – ISSN 2331-1841 Page 3
group students’ ideas visually. There are five types of charts the students may use. Those are
pro and con chart, five sense chart, comparison and contrast charts, time line, and flow chart.
Flow chart is a part of writing process that can help the students to write. Flow charting
aims at getting out students’ ideas or thought and feeling relates to the topic by drawing it into
flow chart diagram. Flow chart is similar to cluster mapping in which shows relationships
between ideas. However, flow chart is most effective in examining cause and effect
relationships. Flow chart is to show the steps in a process (Galko, 2002). Flow chart is a type of
diagram that represents process or situation. The flow chart symbols linked together with
arrows in which showing the process of flow direction. The flow chart should be neat, clear,
and easy to follow. There should not be any room for ambiguity in understanding the flow
chart.
The idea that one action causes another event to happen is one of the crucial thing for
the students to learn. The ability to relate causes to effects enable them to understand what
happened and why it happened, and also to analyze what is happening in the world around
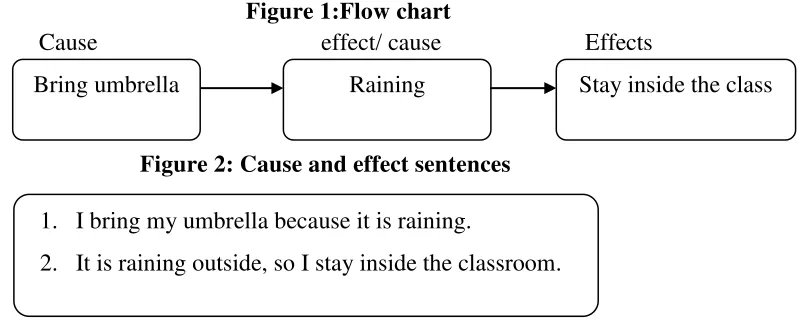
them. The example of how flow chart technique can help students to understand and write
cause and effect sentences has seen in Figure 1 and Figure 2.
Figure 1:Flow chart
Cause effect/ cause Effects
Figure 2: Cause and effect sentences
Based on the statements above, this research was conducted on improving the ability of
the eleventh grade students of SMA Negeri 5 Palu in writing simple cause and effect sentences
through flow chart. Flow chart can be an effective technique for the students to get many ideas
as it can help the students become easier in writing cause and effect sentences. Moreover, flow
chart provides not only new way in writing the sentences but also in making the students feel
interested and enjoyable during the English teaching and learning process. Raining
Bring umbrella Stay inside the class
1. I bring my umbrella because it is raining.
e-Journal of English Language Teaching Society (ELTS) Vol. 2 No. 1 2014 – ISSN 2331-1841 Page 4 METHODOLOGY
True experimental research design was used in this research. In this case, there were
two groups involved; experimental group and control group. The treatment was administered
only for the experimental group while the control group was not. The same pre test and post
test were distributed to these both groups. The design of the true experimental research was
presented below (Avy, Chester, and Razaveh, 2002).
Group Pretest Treatment Posttest
Exp. Group Y1 X Y2
Contr. Group Y1 Y2
Where: Y1: pretest
X: treatment Y2: posttest
The population of this research was the eleventh grade science major students of SMA
Negeri 5 Palu. Cresswell (2002) states that population is a group of individuals who have the
same characteristics.The population consisted of four parallel classes. The total numbers were
105 students.By applying cluster random sampling to decide the sample of this research, it was
found that the first dropped out paper was XI IPA 2 as the experimental group and the second
dropped out paper was XI IPA 4 as the control group.
This research has two variables;independent and dependent. The independent variable
was flow chart, while the dependent variable was improving the ability of the eleventh grade
students in writing simple cause and effect sentences.
In relation to these, there were two kinds of research instruments to collect the data,
they were observation and test. The observation was used to describe the condition in the
classroom during the teaching and learning process. Then the test was used to measure the
students’ ability in writing simple cause and effect sentences before and after the treatment. As stated earlier, the tests;pretest and posttest were distributed in this research. The
pre-test was given to the students to find out how far the students’ writing ability when the
treatment had not been given yet. The treatment was given in eight meetings. In each meeting,
the students were taught how to apply flow chart and write simple cause and effect sentences.
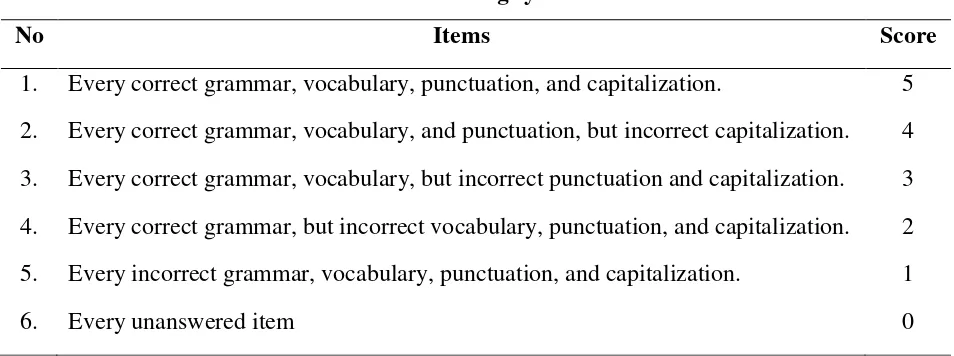
In scoring the sentences, this research used scoring system adapted from KTSP (2006) as in
e-Journal of English Language Teaching Society (ELTS) Vol. 2 No. 1 2014 – ISSN 2331-1841 Page 5
Every correct grammar, vocabulary, and punctuation, but incorrect capitalization.
Every correct grammar, vocabulary, but incorrect punctuation and capitalization.
Every correct grammar, but incorrect vocabulary, punctuation, and capitalization.
Every incorrect grammar, vocabulary, punctuation, and capitalization.
treatment. In addition, it was given to know the effectiveness of the technique in the treatment.
Next, the individual score was computed by using formula designed by Purwanto
Then, the students’ mean score was calculated by using formula as proposed by Sukardi
e-Journal of English Language Teaching Society (ELTS) Vol. 2 No. 1 2014 – ISSN 2331-1841 Page 6
where:
t = the value of the test
Mx = the mean of experimental group My = the mean of control group
x = square deviation score of x2 and x1
y = square deviation score of y2 and y1
Nx = the number of subject of experimental group Ny = the number of subject of control group
FINDINGS
In this research, the data were analyzed descriptively and statistically. The observation
was analyzed descriptivelywhile the data from the pretest and posttest were analyzed
statistically.The observation was done in the experimental group (XI IPA 2) to get the picture
of the condition of the class during the teaching and learning process. It included the students’ responses and the teacher’s way in presenting the teaching materials. Based on the observation,
generally the pre activities run very well. It was depicted from the students’ enthusiasm, attention, and interest in answering the teacher’s preview questions.
Next, in while activities, it was found that the students’ behavior was interfered by the situation in the class because both experimental and control group started the English lesson at
12.30 p.m. and finished at 02.00 p.m. That was the last lesson they had to take in that day. The
students’ behavior of taking too noisy, discussing the task loudly, and often walking around the class, indicated that at noon the students started to get tired and sleepy. They wanted the teacher
to finish the class soon. Teaching English at noon or almost at the end of their day time school
was a big challenge for the teacher. The teacher needed an extra creativity to create an
interesting class so the students could keep their enthusiasm during the while activities.
Last, in post activities, it was concluded that even though the students were too noisy
but at the end of the class they could complete and submit their task to the teacher.
Furthermore, the students could conclude the material given clearly. It showed that during the
lesson, they have a good attention in understanding the material. To sum up, the teacher who
motivated the students and they prayed together before going home confirmed that there was a
e-Journal of English Language Teaching Society (ELTS) Vol. 2 No. 1 2014 – ISSN 2331-1841 Page 7
After conducting the observation, the pretest was administered to know the students’
ability in writing simple cause and effect sentences and posttest was given after the treatment to
know the students’ achievement after getting the treatment.
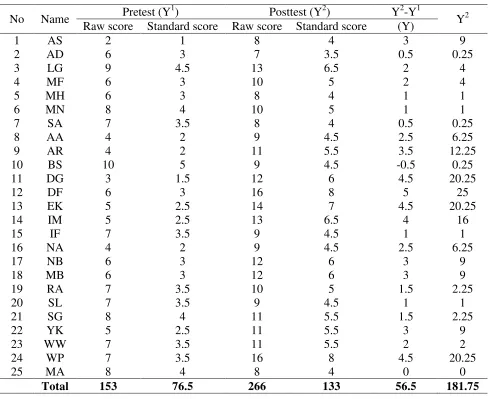
The pretest in the control group was administered to the students on November 7th 2013.
The students’ mean score of control group in pretest was calculated by dividing the sum of students’ standard score (76.5) with the total number of the students (25). In the result, the
mean score of the control group in pretest was 3.06.
Then, the posttest in control group was given to the students on November 30th 2013.
By dividing the sum of students’ standard score (133) with the number of students (25), it was
found that the mean score of the control group in posttest was 5.32.
Furthermore, the deviation and the square deviation of the control group were
computed. After getting the deviation and the square deviation of the control group, the mean
deviation of control group was calculated. By dividing the sum of deviation score (56.5) with
the total number of the students (25), the mean deviation of control group was 2.26. After that,
the sum of squared deviation was computed. After calculated the sum of squared deviation
around the mean deviation score of the control group, it was found that the sum of squared
deviation in control group was 54.06. The result of pretest standard score, posttest standard
e-Journal of English Language Teaching Society (ELTS) Vol. 2 No. 1 2014 – ISSN 2331-1841 Page 8 Table 2: The Deviation and The Square Deviation of Pretest and Posttest of The Control
Group
No Name Pretest (Y
1
) Posttest (Y2) Y2-Y1
Y2 Raw score Standard score Raw score Standard score (Y)
1 AS 2 1 8 4 3 9
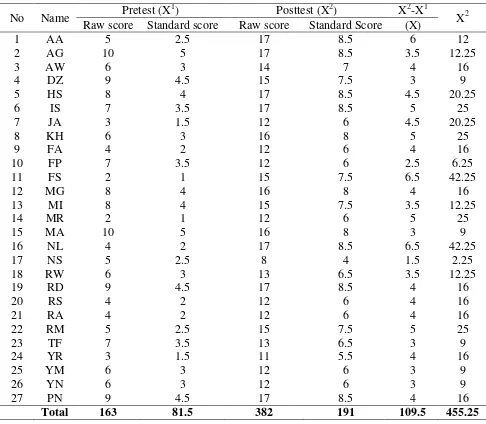
getting the total standard score of the students, the students’ mean score of the experimental group in the pretest was computed. To gather the mean score, the sum of the students’ standard
score (81.5) was divided by the total number of the students (27). In the result the mean score
of the experimental group in pretest was 3.01.
Then, the posttest in experimental group was conducted on December 3rd 2013. By
applying the same formula, the mean score of the experimental group in posttest was gathered.
The sum of students’ standard score (191) was divided by the total number of the students (27).
e-Journal of English Language Teaching Society (ELTS) Vol. 2 No. 1 2014 – ISSN 2331-1841 Page 9
Furthermore, the deviation and the square deviation of the experimental group were
calculated in this research. After getting the deviation and the square deviation of the
experimental group, then the mean deviation of experimental group was computed. To gather
the mean deviation of the experimental group, the sum of deviation score (109.5) was divided
by the total number of the students (27). Thus, the mean deviation of experimental group was
4.05.
After that, the sum of squared deviation in experimental group was calculated. After
calculated the sum of squared deviation around the mean deviation score of the experimental
group, it was found that the sum of squared deviation in experimental group was 11.17. The
result of pretest standard score, posttest standard score, deviation, and the square deviation of
e-Journal of English Language Teaching Society (ELTS) Vol. 2 No. 1 2014 – ISSN 2331-1841 Page 10 Table 3: The Deviation and The Square Deviation of Pretest and Posttest of The
Experimental Group
No Name Pretest (X
1
) Posttest (X2) X2-X1
X2 Raw score Standard score Raw score Standard Score (X)
1 AA 5 2.5 17 8.5 6 12
The last step, the data was analyzed statistically in order to see the significant difference
between the pretest and posttest by using t-test formula. Finally, it was found that the t-counted
was 5.967. By applying 0.05 level of significance and the 27+25-2=50 degree of freedom
through interpolation formula, it was found that t-table was 0.01. Based on these computations,
itshowed that t-counted was higher than the t-table. In the other words, flow chart is effective to
e-Journal of English Language Teaching Society (ELTS) Vol. 2 No. 1 2014 – ISSN 2331-1841 Page 11 DISCUSSION
The research was conducted in SMA Negeri 5 Palu. In collecting the data, observation
and test were used. In this part, the students’ ability before treatment was compared with their
ability after getting the treatment by using flow chart as a technique to guide them in writing
simple cause and effect sentences.
First of all, the observation was done in experimental class before conducting the test.
Based on the observation result, it was pointed out that the whole activities starting from pre,
while, and post activities run very well. It was described from the students’ interest, attention,
and enthusiasm in starting the English lesson. In while activities, although the students got
many obstacles in doing the task, but at the end of the class the students could finish and submit
their task to the teacher. In post activities, the students could conclude the material clearly. It
showed that they had a good understanding about the material during the teaching and learning
process. Also the teacher who motivated the students and they prayed together before going
home confirmed that there was a good character building created in the teaching and learning
process.
After doing the observation, the pretest was distributed to the both groups in
experimental and control group. The standard at school was 70. Based on the pretest result in
experimental group, none of the students could get equal or higher score than the standard
score. The result of the pretest in experimental and control group had the same ability in cause
and effect sentence. That was shown by mean scores of each group. The experimental group
got 3.01 and the control one obtained 3.06. Both of the groups made many mistakes in writing
cause effect sentences before treatment. In addition, some grammatical errors were also found
in their cause effect sentences. For instance in pretest, they wrote my favorite food is manisan
because it taste sweet.
Next, the treatment then was administered to the experimental group by using flow
chart technique. In applying the treatment the students were explained what flow chart was and
how this technique was applied. When the example was given in flow chart, the students were
so interested and enthusiastic in learning process. They were so enthusiastic to mention words
or phrases coming from their mind. Then the students were asked to make cause effect sentence
by using words or phrases from the flow chart. In the process, the students were so active to
e-Journal of English Language Teaching Society (ELTS) Vol. 2 No. 1 2014 – ISSN 2331-1841 Page 12
the material, and walked around the class to borrow dictionary. After finishing the task, the
students then submitted it to the writer.
Posttest was conducted after the treatment given to show progress in writing. Based on
the posttest result in experimental group, there were 15 students who got the equal or higher
score than the standard score. In other words, the improvement of the percentage in posttest
was 55.55%. When the students tried to write sentence in pretest, they have lack of idea to
write. However, in posttest, they wrote some ideas that related to the topic. In addition, they
had lack of knowledge and vocabulary in pretest. While in posttest, they wrote some related
words in writing cause and effect sentence.
The effectiveness of flow chart has been proved by many studies. The first study from
Hadi (2009) showed that the use of the combination between VCD media and flow chart had a
significant effectiveness to improve the students’ performance in SMP. Also, a study from Santoso (2011) found that ‘media gambar seri (Flow Chart)’ improved the students’ writing
skill in each cycle of classroom action research in SD. In relation to these, it was stated that the
result in this research supported the result from relevant studies. It asserted that flow chart
could improve students’ performance in learning by turned abstract concept into concrete visual representation. In this research, the students would have a chance to get many ideas before
starting to write sentence. Flow chart produced learning effects that were substantial and long
lasting.
Moreover, it was found that the students are motivated to improve their knowledge in
learning English. They finished their task faster and they looked more confident in doing
writing than before. It was proved by their participation and activeness during the treatment. It
became one of important facts that were influenced the success of this research. Also, the
students were interested in filling the flow chart. Finally, it was concluded that through flow
chart technique, the students’ abilities in writing simple cause and effect sentence were
improved. The flow chart technique guided them to get many ideas about the topic.
CONCLUSIONS AND SUGGESTIONS
Based on the research result, the value of tcounted (5.967) is higher than the value of ttable
e-Journal of English Language Teaching Society (ELTS) Vol. 2 No. 1 2014 – ISSN 2331-1841 Page 13
grade students of SMA Negeri 5 Palu in writing simple cause and effect sentence can be
improved through flow chart.
Flow chart technique can motivate them in learning English well, especially in writing
simple cause and effect sentence. It is proved by looking at their participation and enthusiastic
during the treatment conducted. Flow chart technique helps the students to get many ideas and
find the appropriate vocabulary.
Based on the conclusions above, suggestions were given for the improvement of
teaching and learning writing especially writing simple cause and effect sentences for the
students, the English teacher, and other researchers.
First, the students should be given more exercise concerning about writing material
especially about learning the grammar, vocabulary, mechanic, and punctuation. Furthermore,
they will have more chance in practicing their ability to write well. Also, the students need to
learn how to use flow chart technique in learning English. It would help them to get many ideas
and motivate them in learning English as well.
Next, it is suggested for the English teacher to provide an interesting learning process
especially in writing, so that the students can feel more enjoyable during the teaching and
learning process. Moreover, the English teacher can useflow chart as one of the alternative
technique in getting many ideas before the students starting to write.
Last, for the other researchers, initially they are suggested to observe the students’
difficulties in learning English before doing the research in the school.It will help them to find
out the appropriate technique to help the students in solving their problem.
REFERENCES
Arikunto, S. (2006). Prosedur Penelitian: Suatu Pendekatan Praktik. Jakarta: PT. Rineka Cipta.
Avy, D., Cheser, L., & Razaveh, A. (2002). Introduction to Research in Education. New York: Wadsworth Group.
Cresswell, J.W. (2002). Educational Research (Planning, Conducting, and Evaluating Quantitative and Qualitative Research). New Jersey: Pearson Prentice Hall.
Depdiknas. (2006). Petunjuk Teknis Pengembangan Silabus dan Contoh/Model Silabus SMA/MA: Mata Pelajaran Bahasa Inggris. Jakarta: Badan Standar Nasional Pendidikan.
e-Journal of English Language Teaching Society (ELTS) Vol. 2 No. 1 2014 – ISSN 2331-1841 Page 14
Galko, F.D. (2002). Better Writing Now: Using Words to Your Advantage. New York: Learning Express.
Hadi, S. (2009). Efektifitas Penggunaan Kombinasi Media VCD Pembelajaran dan Flow Chart Terhadap Peningkatan Hasil Belajar Matematika Siswa di Kelas VIII SMPN 2 Gunung Jati.
EduMa Online.Vol.1(1).13pages.Retrieved:http://www.greenebookshop.net/get_book. php?file=8. 1 Januari 2014 .
Karim. & Rachmadie. (1996). Writing: Depdikbud Direktoral Jenderal Pendidikan Tinggi. Jakarta: Jalan Pintu Satu.
Purwanto, M.V. (1991). Prinsip-Prinsip dan Teknik Evaluasi Pengajaran. Bandung: Remaja Rosdakarya.
Santoso, W. (2011). Penggunaan Media Gambar Seri (Flow Chart) dalam Peningkatan Mengarang Bahasa Indonesia Siswa Kelas IV SD Negeri Brengkol. Online .Retrieved:http://fkip.uns.ac.id/index.php/pgsdkebumen.html
9 Januari 2014 .
Sukardi. (2009). Metodologi Penelitian Pendidikan (Kompetensi dan Prakteknya). Jakarta: PT. Bumi Aksara.