COMPROMISE EFFECT ON CONSUMERS’ BEHAVIOR
Markus Surkamta Eric Santosa
Faculty of Economics and Business, Universitas Stikubank, Indonesia ([email protected])
ABSTRACT
The way consumers think about the products they will buy determines their buying behavior. The decision to buy a particular product is obviously in accordance with the buyer’s attitude. The buyers will also feel more comfortable if their behavior meets with the approval and expectations of the people close to them. While the development of a certain attitude has no effect on subjective judgment, the effect of compromise is likely to make a contribution to its development. Since it is still unclear, this study’s main purposed is to clarify this. In addition, while an attitude is theorized as being a predictor of behavior, through behavioral intention, the study’s secondary purpose is to boost the earlier findings. Likewise, in accordance with the theory of planned behavior, the study will also examine the other predictors of behavioral intention, in relation to the behavioral intention itself. A sample consisting of a 100 respondents was compiled by using the convenience and judgment technique. The data were analyzed using Amos 16.0 and SPSS 16.0. As expected, the compromise effect had a significant influence on whether the customers’ attitude or the subjective norm was the main determinant. Likewise, the customers’ attitude, the subjective norm and perceived behavioral control were confirmed as good predictors of customers’ behavioral intentions.
Keywords: compromise effect, attitude, subjective norm, perceived behavioral control, behavioral intention.
INTRODUCTION
Itamar Simonson is a professor of the Graduate School of Business, Stanford University. He proposed a new finding, which has been labelled as the ‘compromise effect’ (1989). This can be illustrated as follows: Suppose there are only two products in the market, A and B. Since A has more superior attributes than B, it is understandable that A is more appealing than B. When product C appears, whose attributes are inferior to those of B, a change occurs. Simonson proclaims that product B then becomes more appealing. This, in all likelihood, alters the old paradigm that a marketer could not enhance a product’s probability of being chosen by adding a new product to a set of products.
Other researchers investigated the same proposal, and their findings also supported Simonson’s study. Pan and Lehman (1993) and Lehman and Pan (1994) explored numerous occasions when an alternative entered into the set. Herne (1997) applied the middle option to
politics. Dhar and Simonson (2003) examined
the forced choices option in marketing. Pechtl (2009) explored the compromise effect in decision making. Santosa (2005a, 2005b, 2006) scrutinized all the possible entries when a lot of
alternatives came in. Lichters et al. (2016)
executed a study of consumers’ choices. Shideler and Pierce (2016) studied the choices of tourists
at a diving resort in Florida. Godinho et al.
(2016) studied time-pressure. Pinger et al.
(2016) related their study to a restaurant’s customers. Bhatia and Mullet (2016) carried out a study related to postponed decisions.
them. As a consequent, a favorable attitude develops.
While this favorable attitude will push the consumers’ behavior to buy the products, through the consumers’ intentions to buy (Fishbein and Ajzen, 1975; Ajzen, 1991), the behavior is apparently in accordance with the consumers’ decisions to buy. In addition, the way the consumers think also reflects the way they behave. Consequently, figuring out the consumers’ behavior also means understanding the way they make a decision to buy.
It is stated that consumers’ behavior can be predicted by their attitude and the subjective norms (social pressure). This approach is popularly labelled as the theory of reasoned action (Fishbein and Ajzen, 1975) and the theory of planned behavior (Ajzen, 1991). The latter is an improvement of the first, because its efficacy was dubious. The theory of planned behavior determines that an attitude is provoked by behavioral beliefs and outcome evaluations. Likewise, subjective norms are excited by normative beliefs and the motivation to comply. However, no further explanation is offered concerning the arising of behavioral and normative beliefs. While both are primarily influenced by the salient belief to behave, they are actually developed by subjective judgment (Peter and Olson, 2002). Since the compromise effect is a result of subjective judgment, it is assumed that this will affect the creation of people’s attitudes and subjective norms.
Therefore, the purpose of this study is firstly to examine the influence of these effects on the attitude and subjective norms’ creation. Secondly, to investigate the influence of the attitude and subjective norm on the customer’s intention to buy, after they are affected by the compromise effect. In addition, the contribution of perceived behavioral control in supporting the customer’s intention to buy is also explored.
Literature Review
a. Compromise Effect
The compromise effect is an effect resulting from the middle position between two existing
products (Lehmann and Pan, 1994). The justification of the position is based on the attributes of the products. For example, two particular products’ positions are justified by their price and quality. If the first one’s quality is superior to that of the second (the target product), it is understandable that the first is more appealing to consumers than the second. To enhance the appearance of the second, the compromise effects theory postulates that this can be achieved by means of adding another alternative product, which is inferior in quality to the second (target) one. Thus the target product, which now lies between the first and the new (third) product will become more appealing.
The compromise effect was implicitly investigated by Simonson (1989). Firstly he examined the attraction effect, which had
initially been researched by Huber et al. (1982)
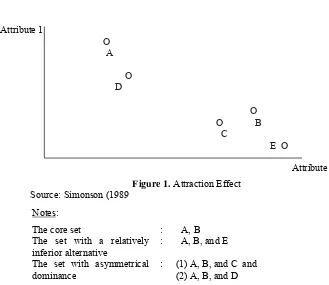
and Huber and Puto (1983). Their findings proposed that a product that met the criteria for an asymmetrically dominant position would be more attractive than before. Thereby, its opportunity of choice increased. The asymme-trically dominant position denotes a product which, in the perceptual space of two given attributes, has superiority, whether from one particular attribute or both, compared to the other products (Pan and Lehman, 1993). When Simonson (1989) explored further, he found that a product, though the superiority of just one of its atributes over that of an adjacent product, will benefit by becoming more appealing.
Figure 1. Attraction Effect Source: Simonson (1989
Notes:
The core set : A, B
The set with a relatively inferior alternative
: A, B, and E
The set with asymmetrical dominance
: (1)A, B, and C and (2)A, B, and D
The greater appeal of B did not make Simonson happy. It was really not that dominant, just relatively dominant. While he tried to consider the matter from another perspective, he accidentally came across a remarkable finding, that brand B looked like a safe choice. Thereby, he later on proposed brand B as the compromise option.
The position of the middle option needed more exploration. In a fresh study, Simonson and Tversky (1992) explored this option further. They found that the compromise option was incorporated with an extremely strong reverse effect. It suggested that an alternative’s appeal was improved when its position was between two other alternatives. In particular, when a consumer considers three brands that differ in quality and price, he/she is likely to evaluate the advantages and disadvantages of the products in relation to each other. Suppose X has the highest quality and price, Z the lowest quality and price, and Y is intermediate for both attributes. The assumption that the disadvantages loom larger than the respective advantages tends to favor the intermediate option Y, because it has only a few small disadvantages in relation to the other options.
Pan and Lehmann (1993) observed two
effects, i.e. frequency and range effect. The
frequency effect postulates that if a new alternative enters between two existing products, and it increases the frequency between the two products, then the two existing products will be perceived as more dissimilar. This finding is in line with the compromise effect. Lehmann and Pan (1994) carried out another study. They investigated some positions when a new alternative came into the set of two existing products; They found the middle option became more appealing.
Herne (1997) introduced a decoy term. A decoy is an option which causes preference reversals between the two other options in a choice set. The decoy increases the popularity of the target option and decreases the popularity of its competitor. The study examined the political decision making process. The result showed that the outcomes of a political decision making process were affected by alternatives, which should have been irrelevant according to the standard approach.
that this option met the preference of consumers when they found it hard to make a choice. Santosa (2005a, 2005b, 2006) scrutinized not only the middle option, but also all the possible entries. He employed both within subject and between subject designs using nineteen product categories. He demonstrated that the probability of a compromise entry increased, based on customers’ choice.
Pechtl (2009) also discussed decoys. He looked at a third product which was inferior to one of the two existing products. Assuming one of them was a target and the other its competitor, the decoy influenced the cognitive evaluation of the target or the competitor, in terms of their perceived attributes’ values. It provided an incremental value for the target, because the presence of the decoy helps to justify the choice of the target over the competitor.
Lichters et al. (2016) demonstrated that the
effect of the compromise option was robust, in terms of durable goods. They employed real branded products, including real payments, the possibility of a pre-choice evaluation, and a no-buy option. When compared to fast-moving consumer goods, the amount of cognitive effort spent on decisions regarding durables fostered the compromise effect.
Other studies also boosted the earlier studies. Shideler and Pierce (2016) studied the choices of
tourists at a diving resort in Florida. Godinho et
al.’s study (2016) concerned itself with
time-pressure. Pinger et al. (2016) related their study
to a restaurant’s customers. Bhatia and Mullet (2016) carried out a study related to postponed decisions.
b. Attitude, Subjective Norm, Perceived Behavioral Control and Behavioral Intention
Understanding the four variables, i.e.
attitude, subjective norm, perceived behavioral control and behavioral intention, one needs to figure out the Theory of Planned Behavior (TPB) which was originally developed from the Theory of Reasoned Action (TRA). The TRA is the one that first proclaimed that the emergence of the behavioral intention can be predicted from
a person’s attitude and the subjective norm (Fishbein and Ajzen, 1975; Solomon, 2002). Jyh (1998) declared that the model’s usefulness was assured. Some studies also supported the theory
(Ryan, 1982; Sheppard et al., 1988). However,
some other studies believed that the TRA’s efficacy was in doubt. It needed such strict control of the possibility of certain behavior occurring (Ajzen, 1991; Taylor and Todd, 1995). The Theory of Planned Behavior (TPB) later on revised the first theory, to state that in fact an individual’s intention needs support to be realized. Therefore, in the TPB, not only do attitude and the subjective norm, but also the perceived behavioral control all belong to the predictor of behavioral intention.
Whether in the TRA or TPB, attitude refers towards behavior. It is commonly understood that a favorable attitude toward an object does not always lead to a buying behavior (La Pierre, 1934 in Armitage and Christian, 2003; Corey, 1937; Wicker, 1969). An attitude toward an object is obviously different from an attitude toward a behavior (Peter and Olson, 2002; Schiffman and Kanuk, 2000). Thereby, while the TPB barely mentions the term attitude, it apparently denotes the attitude toward behavior.
Attitude usually consists of two compo-nents: Outcome belief and outcome evaluation. The outcome belief relates to a tendency for one particular outcome. For instance, there is a tendency to believe that weight will be lessened by dieting. Likewise, there is a tendency to get cancer by smoking. The power of the outcome belief is magnified by the outcome evaluation, which significantly contributes to the form of the behavioral belief. It is understandable that only a significant outcome will affect an individual’s attitude.
The perceived behavioral control basically does not only influence the intention, but also the behavior itself. The rationale is that by holding the intention constant, the greater perceived control will increase the likelihood that the enactment of the behavior will be successful. Furthermore, to the extent to which perceived behavioral control reflects actual control, perceived behavioral control will directly influence behavior. Therefore, it acts as both a proxy measure of the actual control and a measure of the confidence in one’s ability.
As with the attitude and subjective norm constructs, Ajzen (1991) posited that control beliefs underpin perceived behavioral control. Control beliefs are the perceived frequency of facilitating or inhibiting factors, multiplied by the power of those factors to inhibit/facilitate the behavior in question. Congruent with the other belief components in the TPB, it is the control beliefs that are salient at any one time, and which determine global perceptions of control.
The five variables can be subsequently clarified as follows:
1) Behavior (B), is a certain action relating to a
certain object. A behavior usually always happens within a situational context and at a particular time.
2) Behavioral Intention (BI), is a want
correlating with self and action in the future. Some people may have an opinion that an intention is really a plan to do something concerning a certain objective. A behavioral intention is generated primarily by a decision making process, which integrates factors such as the attitude toward behavior and subjective norms, to evaluate alternatives and eventually choose one of them. The behavioral intention varies in its power, depending on the probability of doing something.
3) Attitude toward behavior or action (Ab or
Aact), illustrates one’s total evaluation to do something. The power and evaluation of a conspicuous conviction about a particular action’s consequences can be formulated as follows:
4) Subjective norm, exemplifying one’s
percep-tions about what the surrounding people think of what you should do. A normative belief is concerned with what other people want someone to do about something, and that person’s motivation to comply. The formula is as follows:
5) Perceived Behavioral Control (PBC), it refers
to the degree at which an individual considers that the creation of a particular behavior is under his/her control. He/she believes that a strong intention to behave will not arise when he/she is not sure that he/she has the facilities or opportunities to carry out a particular behavior, although his/her attitude is favorable to it and the important people around are also in favor of him/her doing that. The formula is:
c. Formulating Hypotheses
1) The relation between the Compromise Effect
(CE) with the Attitude (Ab) variable, and the Subjective Norm (SN) variable.
might have a different perception (Sciffman and Kanuk, 2000).
About the assessment itself, the consumer firstly classifies the information, incorporates it with their past experience, and later on comes to a conclusion which arises as a response (Peter and Olson, 2002). The subjective assessment occurs by means of a learning process related to the atribute’s dimensions, by comparing a brand with others, and even reducing the amount of the atribute’s dimensions which had previously just been perceived.
With the great quantity of brands available and the atributes of each product category, this makes it very difficult for consumers to integrate and analyze information, so they simplify their decision making process through subjective judgments, or a belief in a particular brand. The reason is the limitations of people’s cognitive capacity (Bettman, 1979; Newell and Simon, 1972). In some studies on prices, consumers compared one price with others, resulting a perception of price. The price perception inevitably affected the consumers’ comprehension of the quality and value of the products, and
hence the intention to buy (Dodds et al.,
1991; Monroe and Petroshius, 1981).
Consumers that become more interested in a product, which they view as a safe choice, when a relatively inferior product is offered (compromise effect), apparently demonstrate the subjective judgment of consumers. Since this subjective judgment will lead to the creation of an attitude, through an integration of belief and evaluation, a hypothesis can be formulated as follows:
H1: The Compromise Effect (CE) affects the Attitude’s creation (Ab).
The subjective norm, which is developed through a normative belief and the motivation to comply, is apparently subjective. The more favorable aspects of the subjective norm clearly are in accordance with the inner wants, which always cares for other people’s intentions. While the subjective judgment of
the compromise effect will also likely affect the subjective norm, when other people’s intentions arise from their subjective judgment of the compromise effect, a second hypothesis can be formed as follows:
H2: The Compromise Effect (CE) affects the Attitude’s creation (Ab).
2) The relation of Attitude toward behavior
(Ab), the Subjective Norm (SN), and Perceived Behavioral Control (PBC) with Behavioral Intention (BI).
While it is in accordance with the TPB that behavioral intentions can be predicted by the attitude toward behavior, the subjective norm and perceived behavioral control (Fishbein and Ajzen, 1975; Ajzen, 1991), some studies (e.g. Jyh, 1998; O k un and S lo an e , 20 02 ; Martin and Kulinna, 2004; Wiethoff, 2004; Marrone, 2005; Kouthouris and Spontis, 2005; Santosa, 2013; Santosa, 2015) are also in line with this theory. Thereby, the next hypotheses can be formulated as follows:
H3: The more favorable that the Attitude toward behavior (Ab) is, the greater the Behavioral Intention (BI) will be.
H4: The more favorable the Subjective Norm (SN) is, the greater the Behavioral Intention (BI) will be.
H5: The more favorable Perceived
Behavioral Control (PBC) is, the greater the Behavioral Intention (BI) will be.
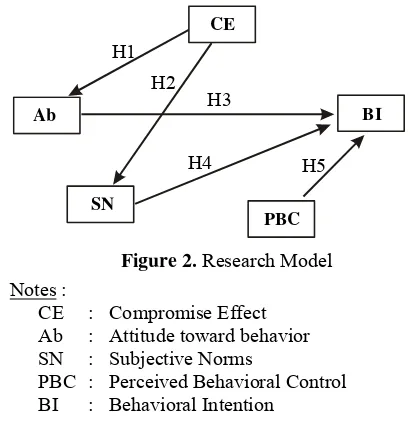
Research Model
Based on the hypotheses a research model can be developed as follows in figure 2.
Methods
(94.33 percent response rate), which satisfied the sample’s adequacy requirement (Ghozali, 2004;
Hair et al., 1995). A five-point Likert scale was
used, with a range from 1 (= completely disagree) to 5 (= completely agree). The instrument, which denoted the indicators, would be justified through a confirmatory factor analysis. Since the indicators are popularly in
use (e.g. see Hypotheses H3, H4, H5) where
they look like a part of the theory of planned behavior, an additional test for validity was not needed. Further, the data were analyzed by employing Structural Equation Modelling
(SEM) i.e. Amos16.0.
Figure 2. Research Model
Notes :
CE : Compromise Effect Ab : Attitude toward behavior SN : Subjective Norms
PBC : Perceived Behavioral Control BI : Behavioral Intention
Result and Discussion
a. Confirmatory Factor Analysis
First Phase CFA. The confirmatory factor analysis was not simultaneously carried out, but done in phases. The first phase contained two of
the independent variables, i.e. attitude toward
behavior and the subjective norms, which
produced χ2, cmin/df, GFI, AGFI, TLI and
RMSEA scores that were not in accordance with them being good indices. However, this probably indicated that there was no difference between the covariance sample matrix and the population covariance matrix estimates (Table 1).
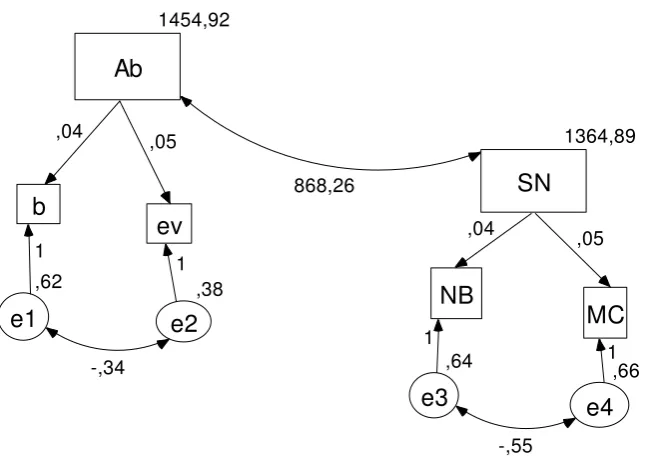
The initial 1st CFA scores, which did not meet the good criteria requirement, could be corrected. The modification indices produced by Amos’s output indicated that the scores would
be improved by connecting e1 ↔ e2 and e3 ↔
e4. As a result, the modified model yielded better scores (Table 1, Figure 3).
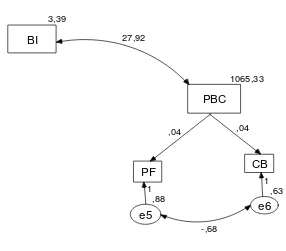
Second Phase CFA. The 2nd phase CFA contained 2 variables, the perceived behavioral control and behavioral intention. It also comprised of 2 stages. The first stage did not produce the expected scores (Table 2). It might
be improved by connecting e5 ↔ e6. As a
consequence, the second stage, which employed the modified model, produced scores that nearly all met the criteria (Table 2, Figure 4).
Standardized Regression Weight of Indicators. The modified model for both the 1st and 2nd phase CFA produced standardized regression weights for all the indicators of > 0.4, which denotes that the factor loading for the manifests were above the minimum requirement (Ferdinand, 2002) (Table 3). It also denotes that all the indicators of Ab (b, ev), SN (NB, MC) and PBC (PF, CB) were valid.
Table 1. First Phase Confirmatory Factor Analysis of Ab and SN
Indicators 1st CFA 2nd CFA Threshold
Chi-square/Prob 219.519/0.000 26.264/0.001 29.588/p>0.05
Cmin/df 21.952 3.283 ≤ 5
GFI 0.671 0.927 High
AGFI 0.308 0.808 ≥ 0,9
TLI 0.680 0.965 ≥ 0,9
RMSEA 0.460 0.152 0.05 s.d0.08
Source: data analysis H1
H2 H3
H4 H5
CE
Ab BI
SN
Figure 3. Modification Model of the 1st Phase CFA
Table 2.
Second Phase Confirmatory Factor Analysis of PBC and BI
Indicators 1st CFA 2nd CFA Threshold
Chi-square/Prob 180.870/0.000 2.696/0.260 22.458/p>0.05
Cmin/df 60.290 1.348 ≤ 5
GFI 0.699 0.987 High
AGFI 0.002 0.934 ≥ 0,9
TLI 0.232 0.995 ≥ 0,9
RMSEA 0.774 0.059 0.05 to0.08
Source: data analysis
Table 3. Standardized Regression Weights:
Estimate
b <--- Ab 0.908
ev <--- Ab 0.948
NB <--- SN 0.897
MC <--- SN 0.907
PF <--- PBC 0.835
CB <--- PBC 0.878
Source: Amos output
1454,92
Ab
1364,89
SN
b
ev
NB
MC
,62
e1
,38
e2
,64
e3
,66
e4
,04
,05
1
,04
,05
1
1
chi-square= 26,264 prob = ,001 cmin/df = 3,283 GFI = ,927 AGFI = ,808 TLI = ,965 RMSEA = ,152
868,26
-,34
Figure 4. Modification Model of the 2nd Phase CFA
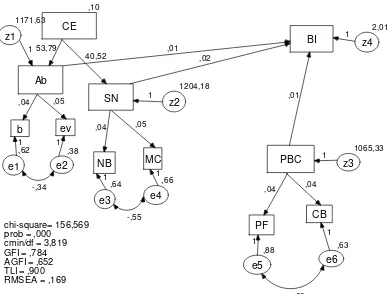
b. The Structural Equation Model.
The model had one initial independent variable (CE) and three dependent variables (Ab, SN, BI), although two of these dependent variables were treated, to some extent, as independent variables. Since the purpose of the study was to discover the relationship between the initial independent variable (CE) and the primary dependent variables (Ab, SN), as well as among the three dependent variables both separately and simultaneously, Structural Equation Modelling (SEM) was employed (Hair et al., 1995). In addition, the use of SEM had advantages; it is fast, accurate and provides greater detail. This was possible since the method chosen unified the factor analysis and path analysis (Ghozali 2004; 2008).
An initial SEM was created by connecting all the variables as hypothesized. This model was not thoroughly appropriate for the
expectancy, since all the indicators, i.e.
chi-square/prob, cmin/df, GFI, AGFI, TLI and RMSEA did not meet the criteria (Appendix A). Consequently, a modified model was produced
by connecting e1 ↔ e2, e3 ↔ e4, and e5 ↔ e6.
This modified model seemingly produced better scores than before (Table 4, Figure 5).
Table 4 denotes that although not all the model’s indicators met the criteria, some (cmin/df and TLI) equalled the requirements. It meant that the model’s data were in accordance with the structural parameters. As a consequence, the model was worthy of use.
Table 4. The Second Indicators Resulted from Modification
Indicators Initial Scores Second Scores Threshold Justification
Chi-square/Prob 527.999/p= 0.000 156.569/0.000 31.264/p>0.05 Not met the criterion
Cmin/df 12.000 3.819 ≤ 5 Met the criterion
GFI 0.621 0.784 High Not met the criterion
AGFI 0.431 0.652 ≥ 0.9 Not met the criterion
TLI 0.611 0.900 ≥ 0.9 Met the criterion
RMSEA 0.333 0.169 0.05 s.d 0.08 Not met the criterion
Source: Data Analisis
1065,33
PBC 3,39
BI
PF CB
,88 e5
,63 e6
,04 ,04
1
1
chi-square= 2,696 prob = ,260 cmin/df = 1,348 GFI = ,987 AGFI = ,934 TLI = ,995 RMSEA = ,059
Figure 5. Modified Model of the Initial Structural Equation Model
Evaluation of Normality. The evaluation of normality was carried out with a univariate test (Ferdinand, 2002; Ghozali, 2004). It was conducted by scrutinizing the skewness value to establish whether its critical ratio values were less than or equal to ± 2.58. As a matter of fact, there were three variables, CE, MC, and NB whose critical ratios for the skewness value were more than ± 2.58. As a consequence, this indicated that univariately the data’s distribution was not normal. To check further, a multivariate test was carried out. The result of the data’s analysis showed a multivariate critical value of 32,005. It is more than 2.58 as required (Appendix E). As a result, the normality test needed a bootstrap analysis.
Bootstrap Analysis. A bootstrap analysis was used to gain a fit model, since the normality test did not meet the pre-requisite. A Bollen-Stine’s bootstrap analysis illustrated the following: (a) The model was a better fit for the 429 bootstrap samples, (b) it fitteds equally well in 0 bootstrap samples, (c) it’s fit was worse or it failed to fit in 71 bootstrap samples, (d) when testing the null
hypothesis that the model was correct, p = 0.144. The probability resulted in p = 0.144, indicating that the model could not be rejected. Therefore, although multivariately the data’s distribution was abnormal, it was worthy of use.
Outliers. Evaluation of the outliers can be carried out by either a univariate test or a multivariate test (Ferdinand, 2002). The univariate test was successfully employed by firstly converting the data to Z-scores, which
should be less than ± 3.0 (Hair et al.,1995). The
result indicated that most of the variables’ Z-scores were less than ± 3.0, except Ev, PF1 and CB1 which had scores of more than ± 3.0 (Appendix C). Therefore, the existence of outliers was indicated.
To check further, a multivariate outliers test
was needed. It determined the chi-square value
which subsequently was used as the upper limit,
which could be calculated by searching on a
chi-square table whose degree of freedom was equal to the number of variables employed, which was 21, under the degree of significance (p) = 0.001. The chi-square value was found to be 46.797. In
fact, most of the scores for Mahalanobis’s dis-tance were less than 46.797, except observations number 6 and 79, which inevitably suggested outliers (Appendix B). However, because there was no specific reason to dismiss them, the outliers were worth being used (Ferdinand, 2002).
Multicollinearity and Singularity. According to the output from Amos, the determinant of the sample covariance matrix should be equal to 78,304.307. This value was far far above zero. As a consequence, it belonged to no multi-collinearity or singularity category (Appendix D).
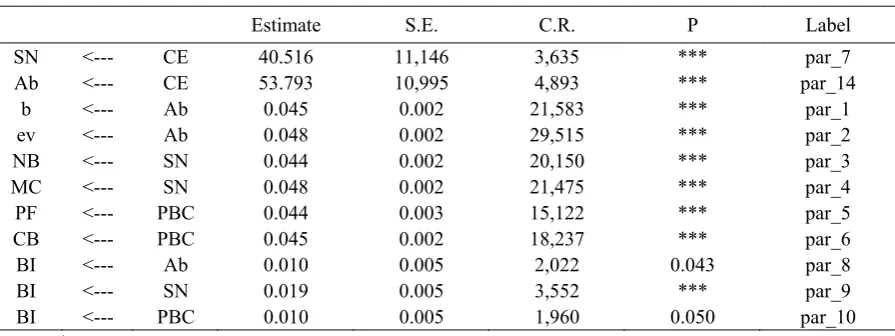
Test of Hypotheses. The regression weights output indicated that the influence of CE on Ab and SN was significant. Likewise, the influence of either SN or PBC on BI. In addition, the influence of Ab on BI was also significant (Table 5).
Discussion. Table 5 shows that both the influence of CE on Ab and CE on SN were significant, and denoted by p = 0.000. This led to
the consequence that the hypotheses i.e. ‘the
Compromise Effect (CE) affects the Attitude’s creation (Ab)’ and ‘the Compromise Effect (CE) affects the Subjective Norm (SN) creation’ were really empirically supported. While this corresponds with similar studies, or may even be an original/new finding, if no such exploration has been carried out previously, it should be appreciated as a significant new fact in the
theoretical development. The findings indicated that the compromise effect can develop a consumer’s subjective judgment, which through the integration of a consumer’s belief and evaluation can build up the consumer’s attitude. Meanwhile, the consumer’s subjective judgment leads to the consumers’s attitude, which is motivated by the need to comply with the desires of the people around him/her. However, this finding obviously needs further exploration and development.
In accordance with the theory of planned behavior, the three predictors of behavioral
intention i.e. attitude, the subjective norm and
perceived behavioral control work well. The results also support the studies of Jyh (1998), Ok un and Slo a n e (2 002 ), Martin and Kulinna (2004), Wiethoff (2004), Marrone (2005) Kouthouris and Spontis (2005), Santosa (2013), and Santosa (2015).
The findings of this study, particularly the influence of the compromise effect in developing consumers’ attitudes and social pressure, are supposed to contribute to a large extent in building up a new theory; or at least give further explanations about attitude’s determination in executing a particular behavior. For marketers, the findings should also be taken into account. When they market a particular product, which is an extension of their product line, and if such products within the same category are absent, they should refer to the
Table 5. Regression Weights: (Group number 1 - Default model)
Estimate S.E. C.R. P Label
SN <--- CE 40.516 11,146 3,635 *** par_7
Ab <--- CE 53.793 10,995 4,893 *** par_14
b <--- Ab 0.045 0.002 21,583 *** par_1
ev <--- Ab 0.048 0.002 29,515 *** par_2
NB <--- SN 0.044 0.002 20,150 *** par_3
MC <--- SN 0.048 0.002 21,475 *** par_4
PF <--- PBC 0.044 0.003 15,122 *** par_5
CB <--- PBC 0.045 0.002 18,237 *** par_6
BI <--- Ab 0.010 0.005 2,022 0.043 par_8
BI <--- SN 0.019 0.005 3,552 *** par_9
BI <--- PBC 0.010 0.005 1,960 0.050 par_10
existing products. Concerns about the quality and price of the particular product should cause it to be positioned as the middle option.
It will be easier when the particular product is a totally new innovation. In such a situation, marketers should cautiously define what/who their target market is, what kind of existing products are already available, and what their competitors are producing. The new innovation should be marketed as the compromise option.
REFERENCES
Ajzen, I. (1991). “The Theory of Planned
Behavior”. Organizational Behavior and
Human Decision Processes. 50. pp 179-211. Armitage, Christopher J. and Julie Christian.
(2003). “From Attitudes to Behavior: Basic and Applied Research on the Theory of
Planned Behavior”. Current Psychology:
Developmental, Personality, Social. Vol 22. No 3. Fall. pp. 187-195.
Bettman, James R. (1979). An Information
Processing Theory of Consumer Choice. Reading, MA: Addison-Wesley.
Bhatia, Sudeep and Timothy L. Mullett. (2016). “The dynamics of deferred decision.” Cognitive Psychology 86, 112-151.
Cooper, D.R. and Pamela S. Schindler. (2008). Business Reserch Methods. Boston: McGraw-Hill/Irwin.
Corey, SM. (1937). “Professed Attitudes and
Actual Behavior”. Journal of
Educa-tionalPsychology. 28. pp 271-280.
Dhar, Ravi. and Itamar Simonson. (2003). “The Effect of Forced Choice on Choice.” Journal of Marketing Research: May, Vol. 40, No. 2, pp. 146-160.
Dodds, William B, Kent B Monroe, and Dhruv Grewal. (1991). “Effect of Price, Brand, and Store Information on Buyer’s Product
Evaluations.” Journal of Consumer
Re-search. 5 (September). pp. 138-142.
Ferdinand, Augusty. (2002). Structural Equation
Modeling Dalam Penelitian Manajemen. Semarang: BP Undip.
Fishbein, M and I Azjen. (1975). Belief, Attitude,
Intention, and Behavior: An Introduction to Theory and Research. Reading, MA: Adisson-Wesley.
Ghozali, Imam. (2004). Model Persamaan
Struktural: Konsep dan Aplikasi dengan Program Amos Ver 5.0. Semarang: BP Undip.
---. (2008). Model Persamaan Struktural:
Konsep dan Aplikasi dengan Program Amos 16.0. Semarang: BP Undip.
Godinho, Sandra. Marília Prada and Margarida Vaz Garrido. (2016). “Under Pressure: An Integrative Perspective of Time Pressure Impact on Consumer Decision-Making.” Journal of International Consumer Marketing 28 (4), 251-273.
Hair, et al. (1995). Multivariate Data Analysis.
New Jersey: Prentice Hall.
Herne, Kaisa. (1997). “Decoy alternatives in policy choices: Asymmetric domination and
compromise effects.” European Journal of
Political Economy. volume 13, issue 3, September. pp 575-589.
Huber, Joel and Christopher Puto. (1983). “Market Boundaries and Product Choice: Illustrating Attraction and Substitution
Effects.” Journal of Consumer Research.
10. June. pp. 31-44.
Huber, Joel. John W. Payne and Christopher Puto. (1982). “Adding Asymmetrically Dominated Alternatives: Violations of Regularity and Similarity Hypothesis.” Journal of Consumer Research. 9. June. pp. 90-98.
Jyh-Shen Chiou, (1998). “The Effect of Attitude, Subjective Norm, and Perceived Behavioral Control on Consumers’ Purchasing Intentions: The Moderating Effects of Product Knowledge and Attention to Social
Comparison Information”. ProcNatl. Sci.
Counc. ROC (C). 9.2. pp 298-308.
Kouthouris, CH. dan A. Spontis. ( 2005). “Outdoor Recreation Participation: An Application of the Theory of Planned
Behavior”. The Sport Journal, Vol. 8,
Number 3, United States Sport Academy. Lehmann, Donald R. and Yigang Pan. (1994).
“Context Effects, New Brand Entry, and
Consideration Sets.” Journal of Marketing
Research. XXXI. August. pp. 364-374.
Lichters, Marcel. Holger Muller. Marko Starstedt. Bodo Vogt. (2016). “How
Durable are Compromise Effects.” Journal
Marrone, Stephen Richard. (2005). “Attitudes, Subjective Norms, and Perceived Beha-vioral Control: Critical Care Nurses' Intentions to Provide Culturally Congruent
Care to Arab Muslims". Research Report.
Columbia University Teachers College (unpublished).
Martin, Jeffrey J. and Pamela Hodges Kulinna. (2004). “Self-Efficacy Theory and Theory of Planned Behavior: Teaching Physically Active Physical Education Classes”. Research Quarterly for Exercise and Sport, Vol. 75 No. 3, 288 – 297.
Monroe, Kent B and Susan M Petroshius. (1981). “Buyer’s Perception of Price: An
Update of the Evidence.” In Perspectives in
Consumer Behavior. Ed Harold H Kassarjian and Thomas S Robertson, Glenview. IL: Scott, Foresman. pp. 43-55. Newell, Allen and Herbert A. Simon. (1972).
Human Problem Solving. Englewood Cliffs, NJ: Prentice-Hall.
Okun, Morris A. and Erin S Sloane. (2002). “Application of Planned Behavior Theory to Predicting Volunteer Enrollment by College Students in A Campus-Based Program”. Social Behavior and Personality. Tempe: Arizona State University.
Pan, Yigang and Donald R. Lehmann. (1993). “The Influence of New Brand Entry on
Subjective Brand Judgments.” Journal of
Consumer Research. 20. June. pp 76-86. Pechtl, Hans. (2009).”Value Structures in a
Decoy and Compromise Effect
Experi-ment.” Psychology and Marketing. 26.(8).
August. Pp. 736 – 759.
Peter, J.Paul. and Jerry C. Olson. (2002). Consumer Behavior and Marketing Strategy. 6th ed. New York: McGraw-Hill Book Company.
Pinger, Pia. Isabel Ruhmer-Krell and Heiner Schumacher. (2016). “The compromise effect in action: Lessons from a restaurant's
menu.” Journal of Economic Behavior and
Organization 128, 14-34.
Ryan, MJ. (1982). “Behavioral Intention Formation: The Interdependency of Attitudinal and Social Influence Variables.” Journal of Consumer Research. 9. pp 263-278.
Santosa, MS. Eric. (2005a). “The Effect of Relatively dominating Positions (When Number of New Alternatives Come around)
on Consumer Choice.” Jurnal Bisnis dan
Ekonomi. Vol 13. No 2. Sep 2005.
---. (2005b). “Effects of Compromise and Assimilated among New Alternatives on
Consumer Choice.” Kajian Bisnis. No. 33
Jan-April 2005.
---. (2006). “Contex Effect: A Number of New Alternatives on Consideration Set.” Optimal. Volume 3, No 2, 2006.
---. (2013). “Understanding Customers’ Behavior to Choicing ‘Lembah Ngosit’ Restaurant Using The Theory of Planned
Behavior.” Equilibrium. Vol V. Edisi 1.
Agustus.pp. 40-55.
---. (2015). “Attraction Effect on
Con-sumer’s Decision Making.” International
Journal of Applied Business and Economic Research.” Vol 13. Number 4. pp. 1759-1780.
Schiffman, Leon G. and Leslie Lazar Kanuk.
(2000). Consumer Behavior. 7th ed. London:
Prentice-Hall International Ltd.
Sheppard, BH. Hartwick, J. and Warshaw, PR. (1988). “The Theory of Reasoned Action: A Meta-analysis of Past Research with Recommendation for Modifications and
Future Research”. Journal of Consumer
Research. 15. pp 325-343.
Shideler, Geoffrey S. and Brett Pierce. (2016). “Recreational divers’ willingness to pay for goliath grouper encounters during the months of their spawning aggregation off
eastern Florida, USA.” Ocean and Coastal
Management 129, pp. 36-43.
Simonson, Itamar. (1989). “Choice Based on Reasons: The Case of Attraction and
Compromise Effects.” Journal of Consumer
Research”. 7. September. pp. 158-174. Simonson, I and Tversky, A. (1992). “Choice in
Context: Tradeoff Contrast and Extremeness
Aversion.” Journal of Marketing Research.
29. August. 281-295.
Solomon, Michael R. (2002). Consumer
Behavior. Upper Saddle River, NJ: Prentice Hall.
Adoption Intentions”. International Journal of Research in Marketing. 12. pp 137-156. Wicker, AW. (1969). “Attitudes Versus Action:
The Relationship of Verbal and Overt Behavioral Responses to Attitude Objects”. Journal of Social Issues. 25. Pp 41-78.
Wiethoff, Carolyn. (2004) “Motivation to Learn and Diversity Training: Application of the
Theory of Planned Behavior”. Human
APPENDIX A
The Initial Structural Equation Model
APPENDIX B
Observations farthest from the centroid (Mahalanobis distance) (Group number 1)
APPENDIX C
Z-Score
Descriptive Statistics
N Minimum Maximum Mean Std. Deviation
Zscore(EK) 100 -0.34980 2.83019 0.0000000 1.00000000
Zscore(b1) 100 -2.95701 1.83814 -8.1698107E-16 1.00000000
Zscore(b2) 100 -2.96367 2.03830 -1.2134823E-15 1.00000000
Zscore(b3) 100 -2.00557 1.41302 -2.5221168E-16 1.00000000
Zscore(b) 100 -3.18124 2.12968 -1.0173548E-15 1.00000000
Zscore(ev1) 100 -2.80593 1.79395 -1.1005944E-16 1.00000000
Zscore(ev2) 100 -2.73008 1.95675 0.0000000 1.00000000
Zscore(ev3) 100 -2.01863 1.56473 0.0000000 1.00000000
Zscore(ev) 100 -3.00712 2.15089 0.0000000 1.00000000
Zscore(Ab) 100 -2.52168 2.69541 -1.1409970E-15 1.00000000
Zscore(NB1) 100 -2.11200 1.63711 -4.8469936E-16 1.00000000 Zscore(NB2) 100 -2.24479 1.91223 -1.5499771E-16 1.00000000
Zscore(NB3) 100 -2.54600 1.86903 0.0000000 1.00000000
Zscore(NB) 100 -2.77508 2.20016 0.0000000 1.00000000
Zscore(MC1) 100 -2.26589 1.66340 -1.1403812E-15 1.00000000
Zscore(MC2) 100 -2.23854 1.75886 -7.6688669E-16 1.00000000
Zscore(MC3) 100 -2.14469 1.85163 -4.7229541E-16 1.00000000
Zscore(MC) 100 -2.58670 2.03241 -4.9708717E-16 1.00000000
Zscore(SN) 100 -2.63530 2.72418 -6.1419630E-16 1.00000000
Zscore(PF1) 100 -3.77258 1.19134 -1.8613922E-15 1.00000000
Zscore(PF2) 100 -2.61524 1.47107 0.0000000 1.00000000
Zscore(PF3) 100 -2.32545 1.73057 0.0000000 1.00000000
Zscore(PF) 100 -2.29419 1.79215 0.0000000 1.00000000
Zscore(CB1) 100 -3.35509 1.59707 0.0000000 1.00000000
Zscore(CB2) 100 -2.22598 1.92181 0.0000000 1.00000000
Zscore(CB3) 100 -2.34669 2.31561 0.0000000 1.00000000
Zscore(CB) 100 -2.88279 2.50001 0.0000000 1.00000000
Zscore(PBC) 100 -2.51434 2.88137 -5.3204003E-16 1.00000000 Zscore(BI1) 100 -2.41859 1.75139 -2.3118218E-16 1.00000000
Zscore(BI2) 100 -2.26175 1.70623 0.0000000 1.00000000
Zscore(BI3) 100 -1.93704 1.88607 -6.3916767E-16 1.00000000
Zscore(BI) 100 -2.68616 2.17811 -3.1774916E-16 1.00000000
Valid N
APPENDIX D
Sample Covariances (Group number 1)
CE PBC SN Ab BI CB PF MC NB ev b
CE 0.098
PBC 1.947 1,065.330
SN 3.966 629.362 1,364.888
Ab 5.266 551.928 868.260 1,454.921
BI 0.173 27.924 40.226 35.930 3.389
CB 0.040 47.666 21.893 20.911 1.075 2.768
PF 0.148 46.474 36.070 28.667 1.348 1.397 2.905
MC 0.156 29.781 64.986 42.223 1.741 1.117 1.623 3.758
NB 0.178 26.570 59.623 34.697 1.821 0.924 1.581 2.289 3.240
ev 0.239 23.032 43.724 69.724 1.785 0.869 1.228 2.237 1.663 3.721
b 0.221 27.155 35.749 64.897 1.530 1.118 1.329 1.620 1.600 2.768 3.510
Condition number = 68,507,779 Eigenvalues
2,716,661; 678,150; 508,010; 2,058; 1,421; 1,228; 0.647; 0.163; 0.078; 0.071; 0.040 Determinant of sample covariance matrix = 78,304.307
APPENDIX E
Assessment of normality (Group number 1)
Variable min max skew c.r. kurtosis c.r.
CE 4.000 5.000 2.493 10.177 4.215 8.603
PBC 48.000 225.000 0.378 1.542 0.995 2.032
SN 26.000 225.000 0.074 0.301 0.755 1.541
Ab 25.000 225.000 0.301 1.229 0.690 1.408
BI 6.000 15.000 -0.042 -0.173 0.373 0.761
CB 6.000 15.000 0.078 0.320 1.528 3.118
PF 8.000 15.000 0.012 0.050 -0.132 -0.270
MC 6.000 15.000 -0.666 -2.718 1.124 2.295
NB 6.000 15.000 -0.688 -2.811 1.180 2.409
ev 5.000 15.000 -0.402 -1.642 0.887 1.810
b 5.000 15.000 -0.560 -2.288 1.413 2.883
APPENDIX F
QUESTIONNAIRE
A. IDENTITY
Name : ... (may leave blank)
Address ; ...
...
Vacancy : ...
Age : ... yrs
Gender : M F
B. RESEARCH QUESTION Give sign √ or X for columns
CA For Completely Agree NA For Not Agree
A For Agree CNA For Completely Not Agree
N For Neutral
1. Compromise Effect Note
The consumer’s choice is between soft drinks and is based on 2 (two) attributes, i.e. their taste and price. Product A is tasty but it is expensive. Product B is less delicious than A, but its price is lower. If the consumer focuses on taste, product B is less appealing. Later on, product C appears. It tastes less delicious than B, but its price is higher than B’s price. Hence, product B is tastier and cheaper than C.
Question
Do you agree if the sales volume of B is higher than before?
CA A N NA CNA
2. Attitude
a. Outcome Belief
I am sure that by buying product B it will,
CA A N NA CNA
1 Meet my needs 2 Lead to pride 3 Lead to satisfaction
b. Outcome Evaluation By buying product B it will,
CA A N NA CNA
3. Subjective Norms
a. Normative Belief
I am sure they also suggest that I buy product B because of my, i.e.
CA A N NA CNA
1 Spouse/my girl friend/my boy friend
2 Families
3 Friends/colleagues
b. Motivation to Comply
My desire to buy product B is in accordance with a suggestion by:
CA A N NA CNA
1 Spouse/my girl friend/my boy friend
2 Families
3 Friends/colleagues
4. Perceived Behavioral Control
a. Control beliefs
I am sure I am able to execute what I need to do (buy product B), since
CA A N NA CNA
1 The price is achievable 2 The stores are obtainable 3 The store is adjacent
b. Perceived Facilities
It is possible to buy product B, since
CA A N NA CNA
1 The price is achievable 2 The stores are obtainable 3 The store is adjacent
5. Behavioral Intention
I have a plan to ...
CA A N NA CNA
1 Go to the store which sells product B as soon as I can
2 Buy product B when my spouse/my girl friend/my boy friend is at home
3 Buy product B soon before it is sold out
--- Thank You ---