COMMUNITY BASED APPROACH TO ASSESS FLOOD RISK
PERCEPTION
ALONG CODE RIVER
Diah Noor Heryanti
Ministry of Public Works
Nanette C. Kingma
Faculty of Geo-Information Science and Earth Observation, University of Twente
ABSTRACT
This p a p e r presents a flood risk perception and coping mechanism along Code River, Yogyakarta Municipality based on the community approach. A total of 90 households were interviewed. Data were analysed using Statistical Package for the Social Sciences (SPSS) Program. The result indicated that there are no differences of flood risk perception among the zones (p >.05). Perception of flood risk is influenced by several variables: gender, length of stay, RW’s risk level, distance between respondents’ house and river and impact level of flood. Whereas, all types of community’s coping mechanism (technological, social, and economical) are influenced by impact level of flood.
Keywords: Flood, Risk perception, Coping Mechanism, Mitigation Measurements
ABSTRAK
Tulisan ini memaparkan persepsi risiko dan mekanisme penanganan banjir di sepanjang Sungai Code, Kota Yogyakarta berdasarkan pendekatan masyarakat. Sebanyak 90 rumah tangga telah diwawancarai. Data dianalisis dengan menggunakan Statistical Package for the Social Sciences (SPSS) program. Hasil penelitian menunjukkan bahwa tidak ada perbedaan persepsi risiko banjir (p> .05). Persepsi risiko banjir dipengaruhi oleh beberapa variabel: jenis kelamin, lama tinggal, tingkat risiko RW, jarak antara rumah responden dan sungai dan tingkat dampak banjir.Sementara itu, semua jenis mekanisme penanganan berbasis masyarakat (teknologi, sosial, dan ekonomi) dipengaruhi oleh tingkat dampak banjir.
Kata Kunci: Banjir, Persepsi Risiko, Mekanisme penanganan, Pengukuran Mitigasi
INTRODUCTION
In order to improve the preparedness for natural disaster, a better contex-tualization of factors related to risk perception and coping mechanism associated with the hazards is necessary. They way people perceived and behave toward risk will give an important input when developing and applying disaster risk management.
Yogyakarta Municipality in Special Province of Yogyakarta is crossed by Code River which part of Boyong River flowing from the Merapi summit at the upper stream. Following the Mt. Merapi eruption in October – November 2010, lahar flood was struck several times in Code River. As reported by BNBP, [2010], the first lahar flood ISSN 0024-9521
happened on Monday, 29 November 2010. The flood was triggered by the heavy rains which happened all day long at the upper course of Code River. The floodwater reached 1.5 m in some parts of the riverbank (Fieldwork 2011) and inundated more than 300 houses [BNBP, 2010].
This research emphasizes on assessing flood risk perception and identifying the coping mechanism of people living in Code Riverbank in Yogyakarta Munici-pality. People’s perception and attitude to risk will be analyzed by exploring the combined effect of socio- economic status, location of the residents, people knowledge and experience and cognitive factors. The assessment is applied for both lahar and localized (urban) floods
which happened on Code River. The result of risk perception assessment and coping mechanism can be used as an input for improving the flood risk management in Yogyakarta Municipality.
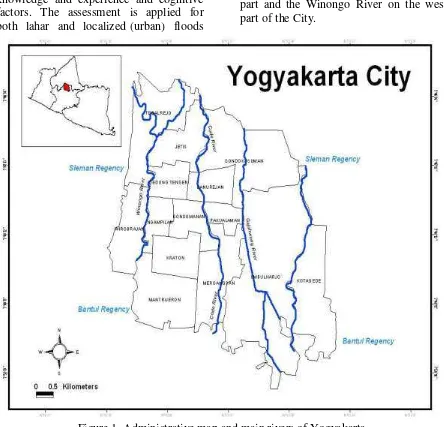
Yogyakarta Municipality is one of the five regencies of the Special Province of Yogyakarta. It is located between 10°24'19" - 110°28'53" E and 07°49'26" - 07°15'24" S with total area of 32,5
km2. Yogyakarta Municipality has a relatively flat area located on an average elevation of 114 m above the sea level. Three main rivers flow in this area (Figure 1). Gajahwong River on the east part, Code River on the middle part and the Winongo River on the west part of the City.
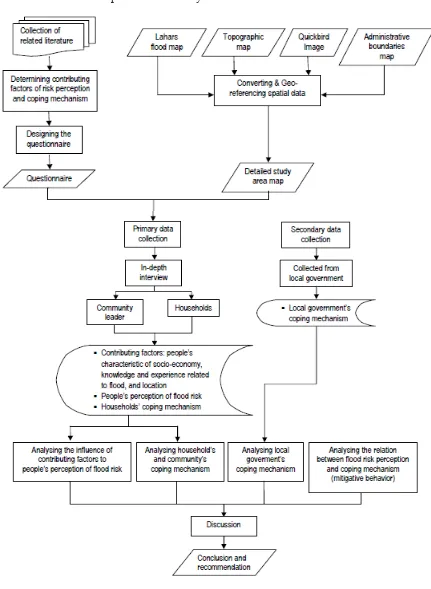
THE METHODS mechanism)of lay people, and identifying the local government strategy in order to reduce the impact of flood. All those objectives are accomplished through three different stages: (1) Pre-fieldwork, (2) Fieldwork, (3) Post-fieldwork. Figure 2. depict the process of the research.
Pre-fieldwork
The first activity of this stage was strengtening the concept and methodology which will be applied in this research through an intensive literature review from related books, journals, reports and previous studies. Identification of data needed and its conducted through in-depth interview with 90 households and community leaders by using questionnaires. Data related with socio-economic condition, flood experience including flood depth and the causal factors of flood, flood risk perception and co-mmunity coping mechanism were recorded from the lay people and the community.
2. Secondary data collection through collecting data and information from related local government offices such as village offices, fire and disaster management agency, and public works agency. the RW samples based on the level of risk. For each level of flood risk will be represented by 2 RW (Table 1).
Table 1. RW samples
Level of Risk Area
High RW 2, Tegal Panggung Seb-district RW 5, Prawirodirjan Sub-district Moderate RW 1, Suryatmajan Sub-district
RW 15, Prawirodirjan Sub-district
Low RW 5, Terban Sub-district RW 10, Gowongan Sub-district
From each RW sample, 15 households were randomly selected as the respondents. Total 90 respondents were selected as the household respondents.
Post-fieldwork
All data gathered from fieldwork were processed spatially and statistically using
mechanism analysis. All these three parts of analysis were done by using statistical
analysis in SPSS. Descriptive analysis
was used to describe the contributing factors such as: socio-economic profile and flood experience. Binary
logistic regression was used to analyze the relationship between
contributing factos and flood risk
perception and coping mechanism.
RESULT AND DISCUS SION
Characteristics of the situational and cognitive factors
Respondents of all ages (17 to 83 years) were represented, with the lowest age bracket was <31 years which accounted for 8 (9%) of the respondents. Most of respondents are at productive age with age bracket 31-45 and the 46-60 categories accounting for 31(34%) and 38 (42%) respectively. Only 2% of the respondents were having age bracket 76 and above years. The number of males interviewed was slightly bigger at 49 (54%) than females at 41 (46%). This can be understood that most male household members were having own business at their home whereas most females interviewed were worked as housewife who stand by at home.
Majority of the respondents graduated from the high school (43% from senior high and 29% from junior high), 21% respondents graduated from elementary school or less, and only 7 respondents obtained education up to university level. The biggest portion of the respondents’ occupation was an employee (34%). This consist of respondents who work as government officer or private worker such as lawyer and consultant. A further 25 (28%) were entrepreneur, 19 (21%) were housewife, 10 (11%) were
non-permanent job, while 5 (6%) were unemployed such as student and jobless.
Almost half of the respondents are having income less than Rp. 750.000 (43%) which is less than minimum wage for Yogyakarta Province. About 36% of the total respondents have income ranged from Rp. 750,000 – Rp. 1,500,000 and 21% of respondents have income more than Rp. 1,500,000.
Most of respondents in Code Area have their own houses (87%). House from their ancestral is included on this category. The figure indicates that only 13% of the total of 90 respondents is living in a rent house. Most of respondents has been living in Code Area for 31 – 45 years (30%), 46 – 60 years (23%), less than 15 years (20%), 15 – 30 years (19%) and over 60 years (8%).
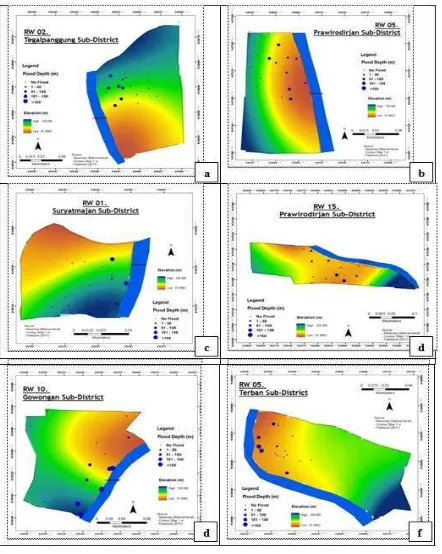
Figure 3. Spatial distribution of historical inundation at a). RW 2, Kel. Tegalpanggung, b). RW 5, Kel. Prawirodirjan, c). RW 1, Kel Suryatmajan, d). RW 15, Kel. Prawirodirjan, e).
RW 10, Kel. Gowongan, f). RW 5, Kel. Terban.
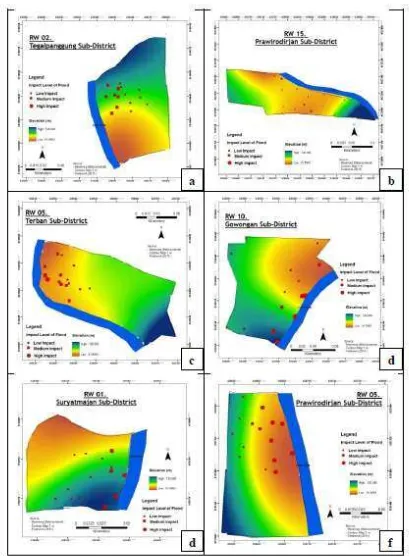
The classification of impact severity was based on flood depth and evacuation. Flood duration is not used as a factor to determine the level of impact severity because flood in this area
Figure 4. Spatial distribution of impact level of flood at a). RW 2, Kel. Tegalpanggung, b). RW 5, Kel. Prawirodirjan, c). RW 5, Kel. Terban, d). RW 10, Kel. Gowongan, e). RW
1, Kel Suryatmajan, f). RW 15, Kel. Prawirodirjan.
Cognitive factors was measured using people knowledge about factors believed to contribute to flooding at Code River. The answers of the questions than grouped into four categories of flood causal factor: excessive rainfall at the upper part of
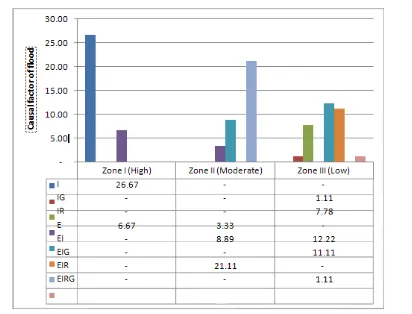
Figure 5. Causal factors of flood on Code River. I=Infrastructure, G=Garbage, R=River aggradation, E=Excessive rainfall at the upper course of Code River.
Infrastructure is considered to be the main factors causing the flood in Zone I (RW 2, Tegalpanggung and RW 5, Prawirodirjan Sub districts). Respondents at this area stated that bad drainage system gives prominent contribution of flooding event which happened at their environment.
People Perception Of Flood Risk
The flood risk perception were measured based on the perception of threat or perception of future flooding. Figure 6 indicates that 47% of the respondents living in Zone I (high risk) have high perception of threat. Meanwhile, most of the respondents in Zone II (moderate risk) perceive that their area is having low level of flood threat with 47% of the respondents. Interesting result is showed in Zone III (low risk), the percentage of respondents who have a perception of high level and low level of flood threat
is almost the same. As many as 50% of respondents have low perception of flood threat in the future, and 40 % of respondents stated that their area is having a high level of flood threat. Overall, the variation of flood risk perception for each level of risk (low risk, medium risk, high risk) among three zones is not too different. This analysis is reinforced through the chi-square test which showed that the difference in perception of threat within the zone categories was not statistically significant (X2=; 3.788 df =4;
Figure 6. Comparison of flood risk perception among different zones
The Relationship Between Contributing Factors and Flood Risk Perception To identify the relationship between contributing factors and flood risk
perception. Binary logistic regression was applied on flood risk perception for all samples. The results of the regression analysis are summarized in Table 2.
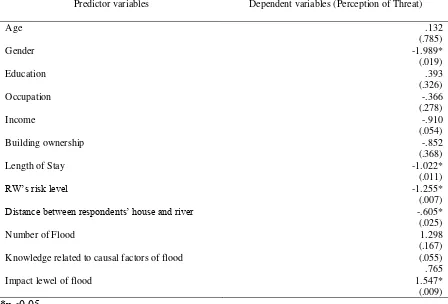
Table 2. Regression coeficients and p values (in parentheses). Asterisks indicate significance.
Predictor variables Dependent variables (Perception of Threat)
Age .132
(.785)
Gender -1.989*
(.019)
Education .393
(.326)
Occupation -.366
(.278)
Income -.910
(.054)
Building ownership -.852
(.368)
Length of Stay -1.022*
(.011)
RW’s risk level -1.255*
(.007)
Distance between respondents’ house and river -.605*
(.025)
Number of Flood 1.298
(.167)
Knowledge related to causal factors of flood (.055)
.765
Impact lewel of flood 1.547*
(.009)
*p≤0.05
Findings from this study indicated that five predictor variables have a relationship with the variation of flood risk perception (p<.05). Four of them
which has positively correlated with perception of threat.
Gender is shown to have a significant causal relationship with perception of threat. That is, the female respondents perceived a higher degree of threat perception in relation to flood rather than male respondents. Decreasing perception of risk with length of stay is arising. proved by the negative correlation
between RW’s risk level with the flood negative correlation with risk perception. The closer distance between house and between contributing factors and perception of threat described in Table 3.
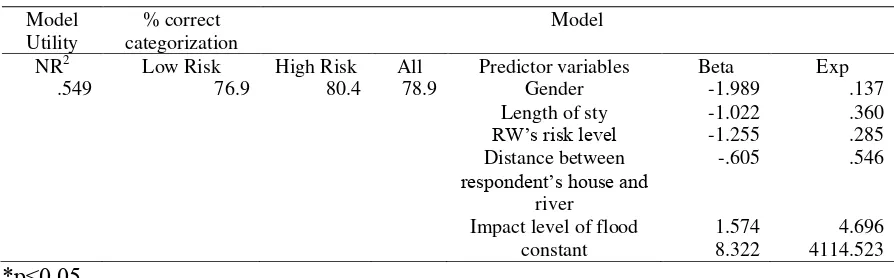
Tabel 3. Logistic Regression for Low-High Flood Risk
Model
constant 8.322 4114.523
*p≤0.05
The model shows Nagelkerke R Square was .549 for a whole sample. This means variabilit y of outcome variable, flood risk perception, which could be influenced by Meanwhile, 80.4% respondents with high risk perception of future were correctly classified.
Household and Community Coping Mechanism
The discussion of coping mechanism at the household and community levels will be separated into four types of
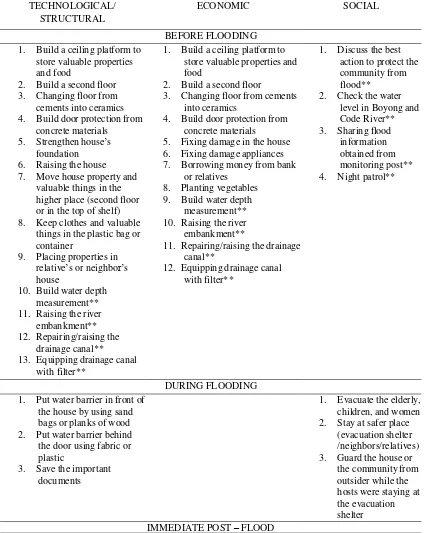
Table 4. Household and community coping mechanism
TECHNOLOGICAL/ STRUCTURAL
ECONOMIC SOCIAL
BEFORE FLOODING 1. Build a ceiling platform to
store valuable properties and food
2. Build a second floor 3. Changing floor from cements into ceramics 4. Build door protection from
concrete materials 5. Strengthen house’s
foundation 6. Raising the house 7. Move house property and
valuable things in the higher place (second floor or in the top of shelf) 8. Keep clothes and valuable
things in the plastic bag or container
1. Build a ceiling platform to store valuable properties and food
2. Build a second floor
3. Changing floor from cements into ceramics
4. Build door protection from concrete materials 5. Fixing damage in the house 6. Fixing damage appliances 7. Borrowing money from bank
or relatives 1. Put water barrier in front of
the house by using sand bags or planks of wood 2. Put water barrier behind
the door using fabric or plastic
1. Cleaning the house and the property
2. Fixing damage in the house
3. Fixing damage appliances 4. Built new MCK**
Table 5. Cross tabulation of zone (RW’s risk level) and type of coping mechanism
Zone Technology Economy Social
Yes (%) No (%) Yes (%) No (%) Yes (%) No (%) economical coping mechanism (35,6%) and social coping mechanism (47,8%). tend to employ technological coping mechanism such as strengtening or modifying the house. Of the total 35,6% of economical coping mechanism, 15,6% is people living in the low risk zone of flood, 12,2% of high risk zone of flood,
and 7,8% of people living in moderate risk zone of flood. Of the total of 47,8% of social coping mechanism, similar with economical coping mechanism, the highest proportion of people who applied mechanism before, during, and post-immediate flooding respectively.
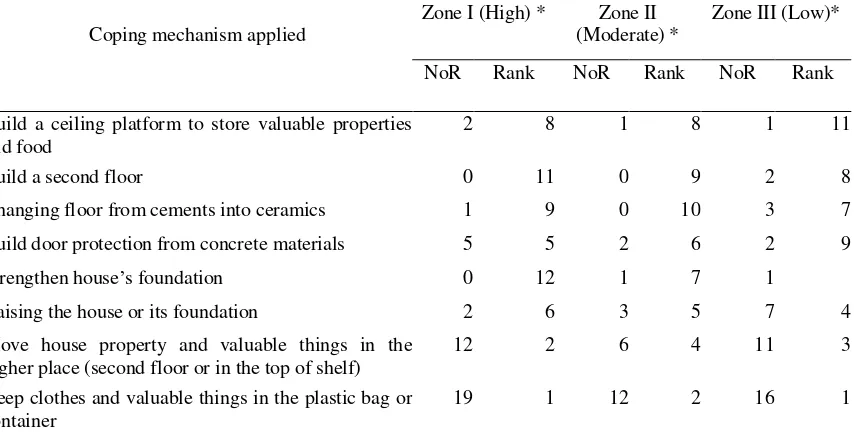
Table 6. Households’ coping mechanism before flooding
Coping mechanism applied higher place (second floor or in the top of shelf)
12 2 6 4 11 3
Keep clothes and valuable things in the plastic bag or container
Continue Table 6.
Placing properties in relative’s or neighbor’s house
7 4 8 3 4 6
Borrowing money from bank or relatives 2 7 0 12 5 5
Planting vegetables 0 10 0 11 1 10
Do nothing 11 3 18 1 14 2
NoR = Number of responses, * : (N = 30 Respondents)
The most common coping mechanism applied by the households living in the zone I and III before flooding is keep clothes and valuable things in the
plastic bags or container. Meanwhile, most of the households living in the zone II is done nothing in order to prepare themselves from flooding.
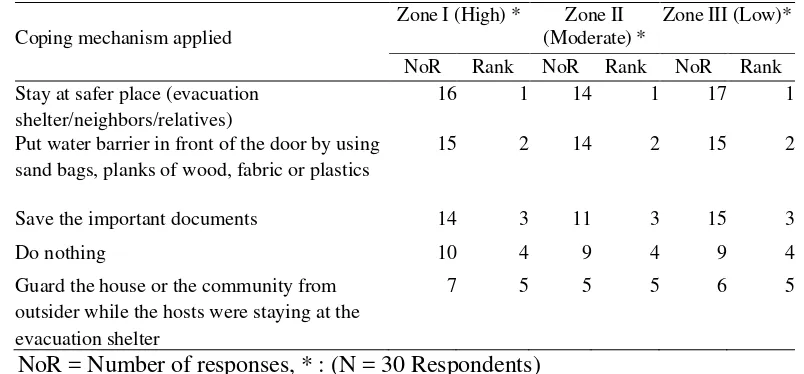
Table 7. Households’ coping mechanism during flooding
Coping mechanism applied
Zone I (High) * Zone II (Moderate) *
Zone III (Low)*
NoR Rank NoR Rank NoR Rank Stay at safer place (evacuation
shelter/neighbors/relatives)
16 1 14 1 17 1
Put water barrier in front of the door by using sand bags, planks of wood, fabric or plastics
15 2 14 2 15 2
Save the important documents 14 3 11 3 15 3
Do nothing 10 4 9 4 9 4
Guard the house or the community from outsider while the hosts were staying at the evacuation shelter
7 5 5 5 6 5
NoR = Number of responses, * : (N = 30 Respondents)
During flooding, the households at all zones prefered to stay at safer place such as evacuation shelter or relatives’ houses. To put the water barrier in front
of the door is the most common coping mechanism applied by the households living in all zones.
Table 8. Households’ coping mechanism post-immediate flooding
Coping mechanism applied
Zone I (High) * Zone II (Moderate) *
Zone III (Low)*
NoR Rank NoR Rank NoR Rank
Cleaning the house and the property 16 1 16 1 14 1
Fixing the damage (house and its appliances) 0 3 0 3 2 4
Rent a house or room 0 4 0 4 3 3
Do nothing 14 2 14 2 16 2
NoR = Number of responses, * : (N = 30 Respondents)
Cleaning the house and the property is the most common activities post-immediate flooding at all zones.
Contributing factors influence on coping mechanism
mechanism (technology, economy, social). Binary logistic regression was applied on coping mechanism behavior for all samples. Cultural coping mechanism
does not include in the analysis process. The results of the regression analysis are summarized in Table 9.
Table 9. Regression coeficients and p values (in parentheses). Asterisks indicate significance.
1. Technology
Predictor variables Dependent variables
(Perception of Threat)
Length of Stay -.860*
(.035)
Number of Flood 2.997*
(.014)
Impact level of flood 1.305*
(.020)
2. Ekonomi
Predictor variables Dependent variables
(Perception of Threat)
Distance between respondents house and river -.793*
(.014)
Impact level of flood 1.078*
(.026)
3. Social
Predictor variables Dependent variables
(Perception of Threat)
Impact level of flood (.000)
*p≤0.05
The result of the regressian analysis are shown as follows:
Technological coping mechanism is influenced by three variables: length of stay, number of flood, and impact level of flood.
Econonomical coping mechanism is influenced by distance between respondents’ house and river and the impact level of flood.
Social coping mechanism is only influenced by impact level of flood.
Relationship between risk perception and coping mechanism
In this research, it is assumed that risk perception influences people’s attitude’s to risk. To prove this, regression analysis between risk perception and coping mechanism was done. The results from regression analysis are described in Table 10.
Table 10. Regression coeficients and p values (in parentheses). Asterisks indicate significance.
Technology Economy Social
Perception of Threat 2.201* 2.035* 1.594*
The result above indicated that perception of threat has a significant correlation with all type of coping mechanism. In the case structural measurement as shown in Table 11.
Table 11. Strucutural and non structural measurement
CONCLUSION
1. There is no difference of risk perception among people within three different zones of flood risk in Code Riverbank. The result of Chi-square test was not statistically siginificant with (p)>0,05 which means there is no differences between the people risk perception in zone I (RW 2, Tegalpanggung and RW 5, Prawirodirjan Subdistricts) and people risk perception in zone II (RW1, Suryatmajan and RW 15, Prawirodirjan Subdistricts) and III (RW 5, Terban and RW 10, Gowongan Subdistricts).
2. The flood risk perceptions of people living in Code area are influenced by these factors: gender, length of stay, RW’s risk level, distance between respondents’ house and river and impact level of flood.
3. Most of the social-economic factors tested in this study show little to no significant influence on risk perception. Only gender and length of stay are the only variables of social-economic characteristic which play a role of the variability of people perception towards flood risk.
Economic factors do not seem to play a significant role in risk perception. Both income and home ownership have no influence on risk perception.
4. There are four type of coping mechanism employed by the local community at Code Area: technological, economical, social and cultural coping mechanism. Generally, all the six RW at three different zones applied the same coping strategy. In fact, technological coping mechanism is the most prominent among all RW at all zones.
5. Meanwhile, the influencing factors to select the coping mechanism at households level are explored through binary logistic regression. The result of the regressian analysis are shown as follows:
Technological coping mechanism is influenced by three variables: length of stay, number of flood, and impact level of flood. Econonomical coping mechanism is influenced by distance between respondents’ house and river and the impactlevel of flood.
Structural Reparing sabo dam
Raising river dike Strengtening river embakment
Non Struktural EWWS
Social coping mechanism flood threat in their area. To reduce the impact of measurements including the developing of early warning system called EWWS (early wireless teristics of lahars flood and loc 2. alized (urban) flood should be
more explored during the interview. This will give a chance to explore about the difference of people’s attitude when dealing between lahars flood and localized (urban) flood in Code Area.
3. People risk perception can be
assessed through many contributing factors. Trust with the institution or protective measurements can be used as
Thank to Muh Aris Marfai for the valuable comments and his support during the perception and communication of flood risk: Components and strategies. Theses and
Dissertations. Paper 623. http://-scholarcommons.usf.edu/etd/623
Tobin, G. A. and Montz, B. (1997), Natural Hazards: Explanation and Integration. New York: The Guilford Press.