March 2010
Consumer Confidence Index (CCI) in March 2010 strengthening
2.1 points to 107.4 against previous month. Relatively stable
economic condition, the downward trend of basic need price
(rice) and government
’
s plan to raise civil servant
’
s wages by
5% in 2010 were assumed as the key factors for the increasing
consumer
’
s optimism.
Pressure on prices in the next 3 months is predicted to go
down, as price expectation index slumped from 160.2 to 155.1.
Pressure on prices were reckoned to mount up in July 2010 and
touch its peak in August 2010 due to fasting month and Eid-ul
Fitr celebration, thus the price pressure will softly down in
farther.
Consumer Confidence Index
After dropped in February 2010, consumer confidence over
economic condition rebounded in March 2010.
This period consumer
survey confirmed the CCI expanded by 2.1 points to 107.4, after in February
CCI has tumbled down by 5.2 points over the previous month.
Consumer’s optimism both over current economic condition and the
expectation for the next 6 months were moved higher. In general, stability
economic condition, price on basic need (rice) that tended to decrease, and
government’s plan on hiking civil servant’s wages by 5% in April-May 2010
were apparently has bolstered household optimism.
Graph 1. Consumer Confidence Index
60.0 70.0 80.0 90.0 100.0 110.0 120.0 130.0 140.0
1 2 3 4 5 6 7 8 9 10 11 12 1 2 3 4 5 6 7 8 9 10 11 12 1 2 3
2008 2009 2010
(Index)
Current Economic Condition Index Consumer Expectation Index Consumer Confidence Index Optimistic
Pesimistic
CONSUMER SURVEY
Consumer Confidence Index
rebounded
Methodology
Consumer Survey-Bank Indonesia (CS-BI) is a monthly survey that has been conducted since October 1999. Since January
2007, the survey is done to moreless 4,600 households as respo ndents
(stratified
random sampling)
in 18 cities: Jakarta, Bandung,
Consumer inferred that current economic condition has expanded
over the same period in previous year,
as the CCI went up from 98.6
(March 2009) to 107.4. The strengthening consumer confidence was
substantially due to economic condition in current time that has been quite
stable compared to the same period in previous year, higher consumer’s
incomes, and increasing job availability.
Current Economic Condition Index
Compared to the previous month, consumers concluded that
economic condition has terraced up.
Current Economic Condition Index in
March 2010 rose 1.7 points to 96.4. Although consumers are still confined to
spend on durable goods, but rising income and widening job availability have
made consumers considered that current economic condition is better than
previous month.
Nevertheless, decreasing trend on basic need price (rice) that
started to be prevalent in several cities in March 2010 also heightening
consumer confidence over improving economic condition.
Compared to the same period in previous year, consumers
stated that current economic condition is going better.
In annual basis,
CECI grew significantly from 86.2 (in March 2009) to 96.4, particularly
triggered by rising income and increasing job availability.
Graph 2. Current Economic Condition Index (CECI)
0.0 20.0 40.0 60.0 80.0 100.0 120.0 140.0
1 2 3 4 5 6 7 8 9 10 11 12 1 2 3 4 5 6 7 8 9 10 11 12 1 2 3
2008 2009 2010
Current Economic Conditions Index Buying Durable Goods Conditions Job Availability Current Incomes
(Index)
Current economic condition
Consumer Expectation Index
Consumers are getting optimistic over economic condition in
the next 6 months.
This period survey emphasized that consumer
expectation index mounted 2.6 points to 118.5 against previous month.
Gaining consumer’s optimism was encouraged by consumer’s expectation on
lower pressure on prices in the next 6 months, higher expectation on income,
better economic condition, and increasing number of job availability.
Graph. 3
Consumer Expectation Index (CEI)
0.0 20.0 40.0 60.0 80.0 100.0 120.0 140.0 160.0
1 2 3 4 5 6 7 8 9 10 11 12 1 2 3 4 5 6 7 8 9 10 11 12 1 2 3
2008 2009 2010
Indeks
Consumer Expectation Index Incomes Expectation Economic Expectation Job Availability Expectation
Consumers expected that their income will arise in 6 months
ahead.
The escalating expectation was influenced by expectations on higher
income either from salary or from business profit, government’s plan to
increase civil servant’s wages by 5% in April-May 2010 and Eid-ul Fitr
allowance in August or September 2010. Based on respondent’s characteristic,
rising optimism over income come from those with senior high education
background. The reading added by 4.7 points.
Consumers also getting more optimistic on economic condition in
the next 6 months.
After declined in February 2010, economic expectation
index in March 2010 attained 3.30 points to 117.7. Consumers were confident
that this sanguine economic condition will continue until the next 6 months.
Escalating economic optimism was mainly obtained from respondents with
Income in the next 6
months was deemed
to increase
Consumers are getting more
optimistic over the next 6
months economic condition
month. Furthermore, that group also expected higher new job availability in
the next 6 months.
Price Expectations
Pressure on prices in the next 3 months are weakening,
as
reflected in price expectation index for the next 3 months which slump from
160.2 to 155.1. The downward will probably occurred in basic need
commodity (rice) due to harvesting time in March-May 2010. From 7 groups of
goods and services, rising price was only deemed would happen in education
sector related to new school year enrollment.
Pressure on prices is judged to going up in July 2010 and touches
its peak in August 2010
owing to fasting month and Eid-ul Fitr celebration,
and afterwards, the pressure will effortlessly down.
Graph 4.
Price Expectation Index for the next 3 and 6 months
‐2.0 0.0 2.0 4.0 6.0 8.0 10.0
140.0 150.0 160.0 170.0 180.0 190.0 200.0
4 5 6 7 8 9 101112 1 2 3 4 5 6 7 8 9 101112 1 2 3 4 5 6 7 8 9 101112 1 2 3 4 5 6 7 8 9
2007 2008 2009 2010
IE Harga 6 bln mendatang
Price Expectation Index for The
Next 6 Months
Cummulative Inflation for 3
Months
Cummulative Inflation for 6
Months
Index
Notes
: Index = 100 indicates that consumer expect prices will still be stable, index > 100 indicates
consumer expect prices will increase, and index < 100 indicates consumer expect prices will decrease
Expectations of Savings and Interest Rates
Consumer’s total savings and interest rates in the next 6 months
are predicted to climb.
Along with the improving expectation of economic
condition in the next 6 months, consumers considered a rising interest rates
which followed by mounting total savings. Moreover, increasing income both
from salary and business profit was envisaged to boost consumer’s total
savings in the next 6 months.
Prices on goods in the
next 3 months tend to
down
Prices on goods will arise
approaching fasting month
and Eid-ul Fitr
Graph. 5
Indexes on Interest Rates and Total Savings in the next 6 months
0
5
10
15
20
25
90
100
110
120
130
140
1 2 3 4 5 6 7 8 9 10 11 12 1 2 3 4 5 6 7 8 9 10 11 12 1 2 3 4 5 6 7 8 9
2008
2009
2010
Total Saving Growth for The Next
6 Months
Interest Rate
Expectation Index for The Next 6 Months
Total Saving Expectation Index for The Next
6 Months
Index
(%)
Table 1. Consumer Confidence, Price Expectations, Consumption Plans, and Economic Indicators (Index)
Jan Feb Mar Apr May Jun Jul Aug Sep Oct Nov Dec Jan Feb Mar
A Consumer Confidence Index 92.8 96.4 98.6 102.5 105.9 109.1 115.4 114.3 110.8 110.0 111.0 108.7 110.5 105.3 107.4
Present Situation 79.7 82.7 86.2 88.2 91.0 94.5 98.6 100.5 96.6 96.8 97.7 96.7 98.4 94.7 96.4
Expectations 105.9 110.0 111.0 116.8 120.9 123.7 132.3 128.2 125.1 123.2 124.3 120.7 122.6 115.9 118.5
Appraisal of Present Situation
Current Incomes 112.0 114.6 117.6 121.1 123.2 124.2 129.5 127.5 124.0 124.9 124.1 123.1 125.5 118.6 121.7 Buying durable goods Conditions 64.8 68.7 73.8 73.0 74.5 78.0 83.7 87.6 81.3 82.2 84.9 81.1 85.2 87.3 85.3 Employment Conditions 62.4 64.8 67.2 70.5 75.3 81.2 82.5 86.3 84.5 83.2 84.1 85.8 84.5 78.0 82.1 (before Oct 2004: Unemployment Condition)
Expectations for 6 Months Hence of
Incomes 130.3 131.3 131.2 130.9 136.4 135.2 142.9 138.3 138.5 137.3 139.3 136.8 141.1 132.5 135.3 Economic Conditions 107.9 113.6 112.6 120.7 126.6 130.5 138.9 135.4 130.4 127.3 128.8 122.1 122.7 114.4 117.7 Employment Conditions 79.4 85.2 89.1 98.7 99.7 105.2 115.1 110.7 106.4 105.1 104.8 103.1 103.9 100.8 102.4 (before Oct 2004: Unemployment Expectation)
B Price Expectations for 3 Months Hence of
Prices 143.8 140.9 150.9 148.1 150.5 154.5 154.8 163.8 165.2 158.8 159.9 161.0 160.6 160.2 155.1 Foodstuff 145.3 144.3 153.1 148.1 152.0 156.5 158.2 168.2 167.0 160.8 160.6 163.0 163.5 163.4 156.0 Food, beverages, cigarettes and tobacco 144.4 141.5 150.3 144.3 147.8 151.8 151.3 161.0 161.0 154.9 155.8 157.2 156.4 155.0 149.9 Housing, electricity, gas and fuel 126.4 122.4 133.1 136.2 141.0 141.5 141.6 148.8 155.2 156.0 156.6 156.3 152.0 151.5 148.1 Clothing 127.7 125.8 132.3 130.7 134.2 139.5 142.5 152.7 150.2 138.6 139.3 138.0 135.5 136.4 131.2 Health 131.3 127.9 133.0 132.0 134.0 135.5 132.1 139.6 140.6 135.4 136.6 137.9 135.9 136.1 133.9 Transportations, communications and financial services 116.4 108.3 122.4 126.9 132.3 135.5 136.7 145.6 146.9 142.6 142.2 141.4 137.5 137.9 134.3 Education, recreation, and sports 133.7 128.6 136.1 133.3 134.8 138.4 135.3 141.1 141.3 137.3 139.0 140.0 138.0 137.2 138.2
C Price Expectations for 6 Months Hence of
Prices 147.5 146.7 153.7 152.6 154.0 154.5 152.2 156.5 156.9 156.2 157.9 158.8 161.2 164.3 161.1 Foodstuff 146.5 148.9 155.3 151.9 155.9 154.9 154.2 160.0 158.2 158.4 158.4 160.5 162.1 166.0 161.7 Food, beverages, cigarettes and tobacco 144.8 145.7 151.7 149.4 152.3 152.1 149.9 155.0 153.4 154.3 154.4 154.9 156.9 158.9 156.7 Housing, electricity, gas and fuel 131.8 132.2 140.2 143.0 144.1 144.5 142.0 148.5 150.8 154.3 155.7 155.4 153.2 153.1 148.6 Clothing 129.5 130.9 137.9 136.6 140.8 141.9 139.0 144.0 141.7 137.4 140.5 139.9 140.1 144.4 143.1 Health 133.9 130.7 136.2 135.4 137.7 136.6 132.5 139.0 140.2 136.7 138.1 138.9 140.0 140.8 136.7 Transportations, communications and financial services 123.4 117.9 130.5 133.7 138.0 138.9 136.9 143.2 143.4 143.9 142.6 143.9 142.8 145.5 143.6 Education, recreation, and sports 138.7 136.4 141.0 139.0 139.0 139.8 134.9 139.8 141.0 138.6 143.1 144.7 146.2 147.7 145.3
D Economic Indicator within 6 Months
Avaibility of Goods & Services 116.1 121.2 120.4 123.7 130.9 134.0 137.2 140.0 138.6 136.4 132.7 133.5 138.3 134.2 135.5 Interest Rate 111.5 111.0 113.4 112.3 110.6 114.2 115.8 117.7 115.2 113.3 115.4 116.3 117.9 114.9 117.0 Current savings 89.2 93.1 93.1 98.1 101.0 103.0 107.5 107.8 104.4 104.7 106.6 105.9 106.4 105.2 106.9 Savings for 6 months hence 112.7 114.4 115.7 118.8 121.0 121.6 129.9 127.6 125.0 125.9 128.2 126.7 129.8 125.6 126.2
2010
Descriptions 2009
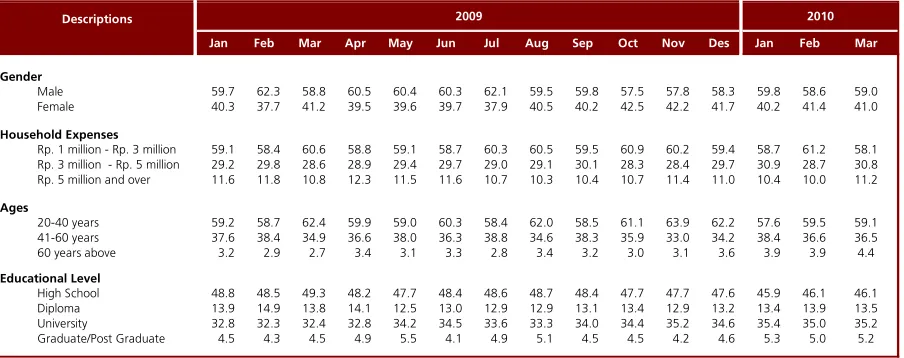
Table 2. Respondent Attributes (percentages)
Jan Feb Mar Apr May Jun Jul Aug Sep Oct Nov Des Jan Feb Mar
Gender
Male 59.7 62.3 58.8 60.5 60.4 60.3 62.1 59.5 59.8 57.5 57.8 58.3 59.8 58.6 59.0 Female 40.3 37.7 41.2 39.5 39.6 39.7 37.9 40.5 40.2 42.5 42.2 41.7 40.2 41.4 41.0
Household Expenses
Rp. 1 million - Rp. 3 million 59.1 58.4 60.6 58.8 59.1 58.7 60.3 60.5 59.5 60.9 60.2 59.4 58.7 61.2 58.1 Rp. 3 million - Rp. 5 million 29.2 29.8 28.6 28.9 29.4 29.7 29.0 29.1 30.1 28.3 28.4 29.7 30.9 28.7 30.8 Rp. 5 million and over 11.6 11.8 10.8 12.3 11.5 11.6 10.7 10.3 10.4 10.7 11.4 11.0 10.4 10.0 11.2
Ages
20-40 years 59.2 58.7 62.4 59.9 59.0 60.3 58.4 62.0 58.5 61.1 63.9 62.2 57.6 59.5 59.1 41-60 years 37.6 38.4 34.9 36.6 38.0 36.3 38.8 34.6 38.3 35.9 33.0 34.2 38.4 36.6 36.5 60 years above 3.2 2.9 2.7 3.4 3.1 3.3 2.8 3.4 3.2 3.0 3.1 3.6 3.9 3.9 4.4
Educational Level
High School 48.8 48.5 49.3 48.2 47.7 48.4 48.6 48.7 48.4 47.7 47.7 47.6 45.9 46.1 46.1 Diploma 13.9 14.9 13.8 14.1 12.5 13.0 12.9 12.9 13.1 13.4 12.9 13.2 13.4 13.9 13.5 University 32.8 32.3 32.4 32.8 34.2 34.5 33.6 33.3 34.0 34.4 35.2 34.6 35.4 35.0 35.2 Graduate/Post Graduate 4.5 4.3 4.5 4.9 5.5 4.1 4.9 5.1 4.5 4.5 4.2 4.6 5.3 5.0 5.2
2010
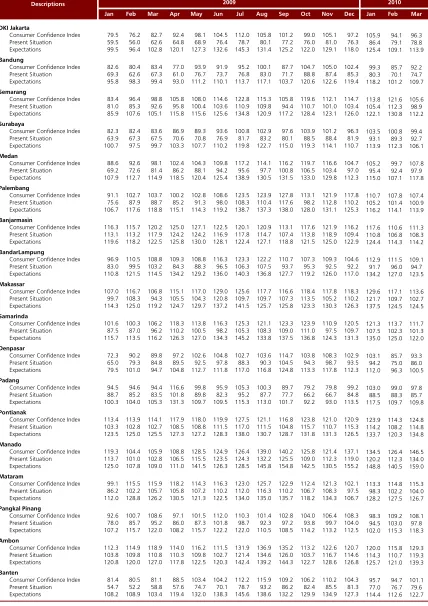
Table 3. Consumer Confidence Index by City
Jan Feb Mar Apr May Jun Jul Aug Sep Oct Nov Dec Jan Feb Mar
DKI Jakarta
Consumer Confidence Index 79.5 76.2 82.7 92.4 98.1 104.5 112.0 105.8 101.2 99.0 105.1 97.2 105.9 94.1 96.3
Present Situation 59.5 56.0 62.6 64.8 68.9 76.4 78.7 80.1 77.2 76.0 81.0 76.3 86.4 79.1 78.8
Expectations 99.5 96.4 102.8 120.1 127.3 132.6 145.3 131.4 125.2 122.0 129.1 118.0 125.4 109.1 113.9
Bandung
Consumer Confidence Index 82.6 80.4 83.4 77.0 93.9 91.9 95.2 100.1 87.7 104.7 105.0 102.4 99.3 85.7 92.2
Present Situation 69.3 62.6 67.3 61.0 76.7 73.7 76.8 83.0 71.7 88.8 87.4 85.3 80.3 70.1 74.7
Expectations 95.8 98.3 99.4 93.0 111.2 110.1 113.7 117.1 103.7 120.6 122.6 119.4 118.2 101.2 109.7
Semarang
Consumer Confidence Index 83.4 96.4 98.8 105.8 108.0 114.6 122.8 115.3 105.8 119.6 112.1 114.7 113.8 121.6 105.6 Present Situation 81.0 85.3 92.6 95.8 100.4 103.6 110.9 109.8 94.4 110.7 101.0 103.4 105.4 112.3 98.9 Expectations 85.9 107.6 105.1 115.8 115.6 125.6 134.8 120.9 117.2 128.4 123.1 126.0 122.1 130.8 112.2
Surabaya
Consumer Confidence Index 82.3 82.4 83.6 86.9 89.3 93.6 100.8 102.9 97.6 103.9 101.2 96.3 103.5 100.8 99.4
Present Situation 63.9 67.3 67.5 70.6 70.8 76.9 81.7 83.2 80.1 88.5 88.4 81.9 93.1 89.3 92.7
Expectations 100.7 97.5 99.7 103.3 107.7 110.2 119.8 122.7 115.0 119.3 114.1 110.7 113.9 112.3 106.1
Medan
Consumer Confidence Index 88.6 92.6 98.1 102.4 104.3 109.8 117.2 114.1 116.2 119.7 116.6 104.7 105.2 99.7 107.8
Present Situation 69.2 72.6 81.4 86.2 88.1 94.2 95.6 97.7 100.8 106.5 103.4 97.0 95.4 92.4 97.9
Expectations 107.9 112.7 114.9 118.5 120.4 125.4 138.9 130.5 131.5 133.0 129.8 112.3 115.0 107.1 117.8
Palembang
Consumer Confidence Index 91.1 102.7 103.7 100.2 102.8 108.6 123.5 123.9 127.8 113.1 121.9 117.8 110.7 107.8 107.4 Present Situation 75.6 87.9 88.7 85.2 91.3 98.0 108.3 110.4 117.6 98.2 112.8 110.2 105.2 101.4 100.9 Expectations 106.7 117.6 118.8 115.1 114.3 119.2 138.7 137.3 138.0 128.0 131.1 125.3 116.2 114.1 113.9
Banjarmasin
Consumer Confidence Index 116.3 115.7 120.2 125.0 127.1 122.5 120.1 120.9 113.1 117.6 121.9 116.2 117.6 110.6 111.3 Present Situation 113.1 113.2 117.9 124.2 124.2 116.9 117.8 114.7 107.4 113.8 118.9 109.4 110.8 106.8 108.3 Expectations 119.6 118.2 122.5 125.8 130.0 128.1 122.4 127.1 118.8 121.5 125.0 122.9 124.4 114.3 114.2
BandarLampung
Consumer Confidence Index 96.9 110.5 108.8 109.3 108.8 116.3 123.3 122.2 110.7 107.3 109.3 104.6 112.9 111.5 109.1
Present Situation 83.0 99.5 103.2 84.3 88.3 96.5 106.3 107.5 93.7 95.3 92.5 92.2 91.7 96.0 94.7
Expectations 110.8 121.5 114.5 134.2 129.2 136.0 140.3 136.8 127.7 119.2 126.0 117.0 134.2 127.0 123.5
Makassar
Consumer Confidence Index 107.0 116.7 106.8 115.1 117.0 129.0 125.6 117.7 116.6 118.4 117.8 118.3 129.6 117.1 113.6 Present Situation 99.7 108.3 94.3 105.5 104.3 120.8 109.7 109.7 107.3 113.5 105.2 110.2 121.7 109.7 102.7 Expectations 114.3 125.0 119.2 124.7 129.7 137.2 141.5 125.7 125.8 123.3 130.3 126.3 137.5 124.5 124.5
Samarinda
Consumer Confidence Index 101.6 100.3 106.2 118.3 113.8 116.3 125.3 121.1 123.3 123.9 110.9 120.5 121.3 113.7 111.7 Present Situation 87.5 87.0 96.2 110.2 100.5 98.2 105.3 108.3 109.0 111.0 97.5 109.7 107.5 102.3 101.3 Expectations 115.7 113.5 116.2 126.3 127.0 134.3 145.2 133.8 137.5 136.8 124.3 131.3 135.0 125.0 122.0
Denpasar
Consumer Confidence Index 72.3 90.2 89.8 97.2 102.6 104.8 102.7 103.6 114.7 103.8 108.3 102.9 103.1 85.7 93.3
Present Situation 65.0 79.3 84.8 89.5 92.5 97.8 88.3 90.3 104.5 94.3 98.7 93.5 94.2 75.0 86.0
Expectations 79.5 101.0 94.7 104.8 112.7 111.8 117.0 116.8 124.8 113.3 117.8 112.3 112.0 96.3 100.5
Padang
Consumer Confidence Index 94.5 94.6 94.4 116.6 99.8 95.9 105.3 100.3 89.7 79.2 79.8 99.2 103.0 99.0 97.8
Present Situation 88.7 85.2 83.5 101.8 89.8 82.3 95.2 87.7 77.7 66.2 66.7 84.8 88.5 88.3 85.7
Expectations 100.3 104.0 105.3 131.3 109.7 109.5 115.3 113.0 101.7 92.2 93.0 113.5 117.5 109.7 109.8
Pontianak
Consumer Confidence Index 113.4 113.9 114.1 117.9 118.0 119.9 127.5 121.1 116.8 123.8 121.0 120.9 123.9 114.3 124.8 Present Situation 103.3 102.8 102.7 108.5 108.8 111.5 117.0 111.5 104.8 115.7 110.7 115.3 114.2 108.2 114.8 Expectations 123.5 125.0 125.5 127.3 127.2 128.3 138.0 130.7 128.7 131.8 131.3 126.5 133.7 120.3 134.8
Manado
Consumer Confidence Index 119.3 104.4 105.9 108.8 128.5 124.9 126.4 139.0 140.2 125.8 121.4 137.1 134.5 126.4 146.5 Present Situation 113.7 101.0 102.8 106.5 115.5 123.5 124.3 132.2 125.5 109.0 112.3 119.0 120.2 112.3 134.0 Expectations 125.0 107.8 109.0 111.0 141.5 126.3 128.5 145.8 154.8 142.5 130.5 155.2 148.8 140.5 159.0
Mataram
Consumer Confidence Index 99.1 115.5 115.9 118.2 114.3 116.3 123.0 125.7 122.9 112.4 121.3 102.1 113.3 114.8 115.3 Present Situation 86.2 102.2 105.7 105.8 107.2 110.2 112.0 116.3 110.2 106.7 108.3 97.5 98.3 102.2 104.0 Expectations 112.0 128.8 126.2 130.5 121.3 122.5 134.0 135.0 135.7 118.2 134.3 106.7 128.2 127.5 126.7
Pangkal Pinang
Consumer Confidence Index 92.6 100.7 108.6 97.1 101.5 112.0 110.3 101.4 102.8 104.0 106.4 108.3 98.3 109.2 108.1
Present Situation 78.0 85.7 95.2 86.0 87.3 101.8 98.7 92.3 97.2 93.8 99.7 104.0 94.5 103.0 97.8
Expectations 107.2 115.7 122.0 108.2 115.7 122.2 122.0 110.5 108.5 114.2 113.2 112.5 102.0 115.3 118.3
Ambon
Consumer Confidence Index 112.3 114.9 118.9 114.0 116.2 111.5 131.9 136.9 135.2 113.2 122.6 120.7 120.0 115.8 129.3 Present Situation 103.8 109.8 110.8 110.3 109.8 102.7 121.4 134.6 126.0 103.7 116.7 114.6 114.3 110.7 119.3 Expectations 120.8 120.0 127.0 117.8 122.5 120.3 142.4 139.2 144.3 122.7 128.6 126.8 125.7 121.0 139.3
Banten
Consumer Confidence Index 81.4 80.5 81.1 88.5 103.4 104.2 112.2 115.9 109.2 106.2 110.2 104.3 95.7 94.7 101.1
Present Situation 54.7 52.2 58.8 57.6 74.7 70.1 78.7 93.2 86.2 82.4 85.5 81.3 77.0 76.7 79.6
Expectations 108.2 108.9 103.4 119.4 132.0 138.3 145.6 138.6 132.2 129.9 134.9 127.3 114.4 112.6 122.7
2010