Full Terms & Conditions of access and use can be found at
http://www.tandfonline.com/action/journalInformation?journalCode=vjeb20
Download by: [Universitas Maritim Raja Ali Haji] Date: 11 January 2016, At: 19:00
Journal of Education for Business
ISSN: 0883-2323 (Print) 1940-3356 (Online) Journal homepage: http://www.tandfonline.com/loi/vjeb20
Assessment of Student Memo Assignments in
Management Science
Julie Ann Stuart Williams, Claudia J. Stanny, Randall C. Reid, Christopher J.
Hill & Katie Martin Rosa
To cite this article: Julie Ann Stuart Williams, Claudia J. Stanny, Randall C. Reid, Christopher J. Hill & Katie Martin Rosa (2015) Assessment of Student Memo Assignments in Management Science, Journal of Education for Business, 90:1, 24-30, DOI: 10.1080/08832323.2014.968517 To link to this article: http://dx.doi.org/10.1080/08832323.2014.968517
Published online: 06 Nov 2014.
Submit your article to this journal
Article views: 56
View related articles
Assessment of Student Memo Assignments
in Management Science
Julie Ann Stuart Williams, Claudia J. Stanny, Randall C. Reid,
and Christopher J. Hill
University of West Florida, Pensacola, Florida, USA
Katie Martin Rosa
Studer Group LLC, Gulf Breeze, Florida, USA
Frequently in Management Science courses, instructors focus primarily on teaching students the mathematics of linear programming models. However, the ability to discuss mathematical expressions in business terms is an important professional skill. The authors present an analysis of student abilities to discuss management science concepts through memo homework assignments. The findings indicate that average student grades on homework problems for linear programming formulations were always higher than average student grades on homework memos in which they write about their formulations. These results suggest that teaching managerial writing about analytical work is an important area for future business education research.
Keywords: assessment, business education, management science, managerial writing, memos
Two important areas of learning in business education research include how to develop managerial communication skills (Alatawi, 2012; Grossman, Norback, Hardin, & Fore-hand, 2008; Williams & Reid, 2010) and how to improve stu-dent skills in problem solving (Aiken, Martin, & Paolillo, 1994; Anderson, Kimes, & Carroll, 2009; Boatwright & Stamps, 1988; Kimball, 1998). Our university chose to require all management and management information systems majors to complete a course in management sci-ence (among other courses) to ensure student learning for the 2013 Association to Advance Collegiate Schools of Business (AACSB) Standard 8, Curricula Manage-ment and Assurance of Learning (Standard 15 in 2003), and the 2013 AACSB Standard 9, Curriculum Content (Standard 16 in 2003), which includes expectations for knowledge in the areas of General Business and Man-agement (AACSB, 2013).
The management science course helps students learn how to describe the complexities and logic of real-world
business problems to improve decision making. In an intro-ductory undergraduate course in management science, stu-dents learn first how to identify decisions in a word problem and translate them into a legend with variable sym-bols. Using their legend, students learn how to translate the word descriptions for the objective and the constraints into an objective function and mathematical expressions, respectively (Anderson, Sweeney, Williams, Camm, & Martin, 2011). Words to numbers is a contemporary label for this important skill, which can also be described as level two (comprehension) in Bloom’s Taxonomy (Anderson & Krathwohl, 2001; Bloom, Engelhart, Furst, Hill, & Krathwohl, 1956; Krathwohl, 2002). When an assumption of linearity is appropriate, students are taught to use mathe-matical constructs to develop a linear program. Once stu-dents learn to use computer software to solve and interpret the relationship between the optimal solution and the con-straints, they learn to write a memo restating the problem and their recommendation based on the optimal solution from their model. This memo communication can be described as level 4 (analysis) or level 5 (synthesis: produc-tion of a unique communicaproduc-tion) in Bloom’s taxonomy (Anderson & Krathwohl, 2001; Bloom et al., 1956; Krath-wohl, 2002).
Correspondence should be addressed to Julie Ann Stuart Williams, University of West Florida, Department of Management/MIS, 11000 Uni-versity Parkway, Pensacola, FL 32514-5752, USA. E-mail: jawilliams@ uwf.edu
DOI: 10.1080/08832323.2014.968517
Most pedagogy related to linear programming focuses on teaching students the mathematics of linear program-ming (Liberatore & Nydick, 1999; Stevens & Palocsay, 2004). Research in the pedagogy of mathematics describes the strategies students must learn to use to translate word problems into mathematical expressions (Barnes, Perry, & Stigler 1989; Grinde & Kammer-meyer, 2003; Koedinger & Nathan, 2004; Rittle-Johnson & Koedinger, 2005, Williams & Reid, 2010). An impor-tant learning goal is that students will be able to articu-late their skills, discuss management science procedures, and translate the results into recommendations for busi-ness problems.
The development of expert skill requires multiple opportunities to practice a skill in which later practice is guided by and benefits from the formative feedback individuals receive on earlier performances (Ericsson, Krampe, & Tesch-R€omer, 1993). Designing multiple assignments enables students to practice key academic skills, receive formative feedback, and apply this feedback to improve their performance on subsequent assignments (Dunlosky, Rawson, Marsh, Nathan, & Willingham, 2013; Feser, Vasaly, & Herrera, 2013; Khan, Khalsa, Klose, & Cooksey, 2012; Stanny & Duer, 2013; Thompson, Nelson, Marbach-Ad, Keller, & Fagan, 2010).
Here we describe the development of student writing through practice with memo homework assignments and present data on student performance for both the model-ing and writmodel-ing portions. Business students may develop the skill labeled words to numbers when they define the problem in a business memo and build the model, whereas students may develop the skill labeled numbers to words when they write a business memo to communi-cate a recommendation based on their model. An added advantage of these assignments is that they motivate stu-dents to engage with important mathematical concepts and course writing outside class. These assignments pre-pare students for active, engaging discussions during class that clarify and deepen student mastery in these
areas to improve persistence and student learning (Braun & Sellers, 2012; Nelson Laird, Chen, & Kuh, 2008; Strangman & Knowles, 2012).
METHOD
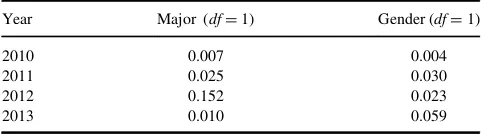
Participants in the study were students enrolled in the fall 2010, fall 2011, fall 2012, and fall 2013 undergraduate management science courses taught by Julie Ann Stuart Williams. The university Institutional Review Board approved data collection and analysis. The analysis is based on a total of 88 participants, where eight were juniors, dents with 60–89 semester hours, and 80 were seniors, stu-dents with 90 or more semester hours, including a minimum of 20 semester hours of course work at the junior/senior level. The sample size of juniors was too small each term to analyze data separately while protecting stu-dent anonymity. Stustu-dents were recruited for the study through an invitation to participate voluntarily, letters of invitation were distributed and informed consent forms were collected during the first and second class lectures. The total course enrollment each term and the number of students who consented to participate that term are shown in Table 1 along with descriptive data on the characteristics of students included in the data pool in terms of major and gender. Using the data from Table 1, chi-square tests were performed for each year with the enrollment and participant groups with respect to major and gender. The chi-square tests shown in Table 2 demonstrate that the variations in the distribution of numbers of majors and men and women
TABLE 1 Course Demographics
Total course enrollment (%) Participants (%)
2010 2011 2012 2013 2010 2011 2012 2013 Characteristic n % n % n % n % n % n % n % n % Major
Management 21 70 24 73 19 70 11 73 20 69 17 70 15 65 9 75 Other 9 30 9 27 8 30 4 27 9 31 7 30 8 35 3 25 Gender
Women 6 20 13 40 10 37 2 13 6 21 10 42 9 39 2 17 Men 24 80 20 60 17 63 13 87 23 79 14 58 14 61 10 83
Total 30 33 27 15 29 24 23 12
TABLE 2
Summary of the Calculated Chi-Square Values per Year
Year Major (dfD1) Gender (dfD1) 2010 0.007 0.004 2011 0.025 0.030 2012 0.152 0.023 2013 0.010 0.059
ASSESSMENT OF STUDENT MEMOS 25
enrolled in these classes each year represent the random variation expected from classes drawn from the same underlying population.
During the first week of the semester, students were introduced to the memo format for homework assignments in class discussions and a course packet that included com-plete examples of memo homework assignments and memo keys from previous semesters. The first author evaluated student performance on new memo homework assignments developed for that semester. Homework assignment perfor-mance was evaluated with a rubric, which evaluated student performance on several writing components, including the memo, legend, objective function, and identification of constraints. The memo section of the rubric included the student’s description of the problem including the decisions, the objective, and the constraints; their rec-ommendation; their response to sensitivity analysis questions; their professionalism including grammar and appearance of document pages; and the attachment of an appendix with supporting documentation. Other sec-tions of the rubric evaluated the mathematical aspects of linear programming such as the formal legend and the mathematical expression of the objective function and the constraints.
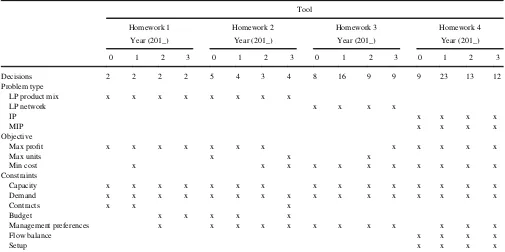
The homework assessment tools are summarized in Table 3. An x in Table 3 indicates that a homework assign-ment assessed that skill. Each of the four homework
assignments had two problems. The number of decisions in the assignments ranged from two to 23, as noted in Table 3. The objectives were not always financial. For example, in the second homework for fall 2010, one of the problems required students to maximize the units of product produced as a small business prepared to sell their product at a local festival. The types of constraints considered are summarized in Table 3 to demonstrate the variety of limits or requirements imposed by the business scenarios. The expected procedure for all home-work assignments was that students would use computer software to discover an optimal solution.
Homework solution key memos include the summary statement of the decisions, the objective, the constraints, the recommendation, and the objective function value for the recommended solution. An example of the first problem of the first homework memo and solution key for fall 2012 is given in Appendices A and B, respectively, to demon-strate the quality expected for student writing in the assign-ments. Examples of homework memo solution response keys for fall 2010 were presented in a conference paper (Williams, Stanny, Reid, Martin, & Mateeva, 2012). Solu-tion keys for homework assignments were distributed to the students in class on the day the assignment was due. The solution key then became the focus of the lecture discussion that day. Thus, the homework assignments prepared stu-dents for active discussion and elaboration of concepts in management science, representing an implementation of
TABLE 3
Summary of Elements Included in Homework Assignment Assessment Tools
Tool
Homework 1 Homework 2 Homework 3 Homework 4 Year (201_) Year (201_) Year (201_) Year (201_) 0 1 2 3 0 1 2 3 0 1 2 3 0 1 2 3 Decisions 2 2 2 2 5 4 3 4 8 16 9 9 9 23 13 12 Problem type
LP product mix x x x x x x x x
LP network x x x x
IP x x x x
MIP x x x x
Objective
Max profit x x x x x x x x x x x x
Max units x x x
Min cost x x x x x x x x x x x
Constraints
Capacity x x x x x x x x x x x x x x x Demand x x x x x x x x x x x x x x x x
Contracts x x x
Budget x x x x x
Management preferences x x x x x x x x x x x x
Flow balance x x x x
Setup x x x x
Note:There are three categories (problem type, objective, and constraints) with subcategories (3, 3, and 7 respectively) listed below each category. LPD
linear programming; IPDinteger programming; MIPDmixed integer programming.
flipped or inverted classroom pedagogy (Lage, Platt, & Tre-glia, 2000; Tucker, 2012; Wilson, 2013).
RESULTS
Average student performance for the homework model com-ponent (a mathematical linear programming formulation) and the homework memo component were tracked over time, as shown in Figure 1. Interestingly, average student scores were always higher for the formulation component than for the memo writing component. The formulation average evaluated the students’ abilities to build a linear pro-gramming model that included creating legends to define decision variables, objective functions, and constraints. Writing the memo required students to write about the deci-sions, objective, constraints, interpretation of their model, and their recommendation. Other test instruments that evalu-ated mathematical programming knowledge such as quizzes and exams are not included in the analysis in this article.
Statistical analyses were performed on the average stu-dent scores for each type of assessment, formulation versus writing, and over time for each fall semester class by year, using IBM SPSS Version 19. To compare the average stu-dent formulation assessment scores for different years, a one-way between-groups analysis of variance (ANOVA) was conducted. There was not a significant effect of year on the average student formulation assessment scores,F(3, 84)D.179,MSED51.658,pD.911. Likewise, to compare the average student writing assessment scores for different years, a one-way between-groups ANOVA was conducted. There was not a significant effect of year on the average student writing assessment scores,F(3, 84)D.530,MSED
178.875, p D.663. Thus, the four classes were combined for a paired-samplest-test to compare the performance for type of assessment, formulation versus memo writing. There was a significant difference in the average student scores for formulation (M D 77.1845, SD D 16.7609)
and writing (MD64.1458,SDD18.2199),t(87)D12.077,
p <.001. These statistical results for the average student
scores for the type of assessment are consistent with the dif-ferences between formulation grade and memo grade illus-trated in Figure 1.
Furthermore, when examining the performance per class, paired samples correlations between formulation and writing were high as shown in Table 4. Students with higher formulation averages had higher memo writing aver-ages. However, the memo writing averages were not as high as the formulation averages as discussed in a previous paragraph.
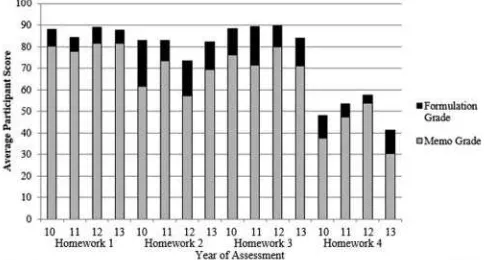
For further evaluation, the average scores for each of the four homework assignments for the model component (a mathematical linear programming formulation) and the memo component were tracked over time, as shown in Fig-ure 2. Each homework assignment had two problems with two memos, which are aggregated in Figure 2. Figure 2 is graphed to compare student memo writing versus student formulation of the mathematical model for the same assign-ment. For each homework assignment, average student scores were always higher for the formulation component than for the memo writing component. Because the lowest homework grade was dropped, the effect of earning a score of zero on one or more homework assignments greatly impacted the variability in Figure 2. The percentages of students earning a zero on the fourth homework were 45%, 38%, 35%, and 50% for the 2010, 2011, 2012, and 2013 classes, respectively. A potential source of variability for 2012 was that Hurricane Isaac caused the university to be closed for two days, which meant students in fall 2012 had one less class lecture from the unit before the second home-work assignment was due.
TABLE 4
Paired Samples Correlations Between Formulation and Writing Grades
Year n Correlation value Significance 2010 29 .838 .000 2011 24 .922 .000 2012 23 .666 .001 2013 12 .871 .000
FIGURE 1. Average scores earned on homework assignments (contribu-tions of formula(contribu-tions and memo writing about formulation components).
FIGURE 2. Average scores earned on individual homework assignments (contributions of formulations and memo writing about formulation components).
ASSESSMENT OF STUDENT MEMOS 27
Another source of variability is that the homework assignments became more challenging as the course pro-gressed. As shown in Table 3, the first homework assign-ment required students to model simple two-decision problems whereas subsequent homework assignments required the students to identify many more decision varia-bles. In Figure 2, the first homework assignment consis-tently had averages in the mid to high 80s. Figure 2 also shows that the third homework required the student to build clearly structured network models with capacity, demand, and management preference constraints. In Figure 2 the student performance on the LP Formulations for the third homework consistently had averages close to 90. For the simpler first and third homework assignments, there is little room for improvement on average student performance for the simpler formulations. However, there is more room for improvement for student performance for writing about their simpler formulations since Figure 2 shows lower aver-age scores on writing the memos for the first and third homework assignments.
Figure 2 illustrates that average performance was worst for writing about the more complex and less structured models in the second and fourth homework assignments. On the other hand, student performance was higher when they discussed the two-decision model in the first home-work assignment (a simpler problem) and the more struc-tured network flow models presented in the third homework assignment. Because mixed integer program-ming is the most challenging course concept, lower average performance for the fourth homework formulations and memo writing are evident in Figure 2, as anticipated. Thus, Figure 2 indicates an important area for future researchers to improve student learning about analytical communica-tion of simpler and more complex problems.
CONCLUSIONS AND FUTURE RESEARCH
In conclusion, these results show that average student per-formance with respect to writing business memos about even simple two-decision or highly structured network flow linear programming models can be improved. For more complex, less structured problems, average student perfor-mance for writing business memos can be improved signifi-cantly. Interestingly, Figure 2 shows that average student writing scores were always lower than average student for-mulation scores for the same problem scenarios in all four homework assignments. These results point to opportunities for further innovation to improve student writing in busi-ness memos.
As employers seek candidates who can perform and communicate analytical work, these results suggest that additional research is needed to develop and assess teaching methods that will help students write about their business analyses. Different types of business situations require
different types of business communication skills (Bean, 2011; Sigmar & Hynes, 2012; Zhu, 2004). Faculty may need assistance to improve their understanding of student backgrounds, including prior business course experiences and existing writing abilities to integrate writing across the curriculum (Bacon & Anderson, 2004; Bacon, Paul, John-son, & Conley, 2008; Bean, 2011; Plutsky & WilJohn-son, 2001; Sigmar & Hynes, 2012). Consistent with these results, busi-ness writing should be integrated into multiple busibusi-ness courses to teach students the business context, improve crit-ical thinking, and develop associated business writing skills necessary for success.
ACKNOWLEDGMENTS
The authors thank colleague Gayle Baugh for helpful dis-cussions regarding this project.
REFERENCES
Aiken, M. W., Martin, J. S., & Paolillo, J. G. P. (1994). Requisite skills of business school graduates: Perceptions of senior corporate executives.
Journal of Education for Business, 69, 59–162. doi:10.1080/ 08832323.1994.10117676
Alatawi, M. A. (2012). Writing effective business memos in Alawdah Company using action research. Australian Journal of Basic and Applied Sciences,6, 97–104.
Anderson, C. K., Kimes, S., & Carroll, B. (2009). Teaching revenue man-agement at the Cornell University School of Hotel Administration.
INFORMS Transactions on Education, 9, 109–116. doi:10.1287/ ited.1090.0024
Anderson, D. R., Sweeney, D. J., Williams, T. A., Camm, J. D., & Martin, K. (2011). An Introduction to management science: Quantitative approaches to decision making. Mason, OH: South-Western Cengage Learning.
Anderson, L. W., & Krathwohl, D. R. (Eds.) (2001).A taxonomy of learn-ing, teachlearn-ing, and assessment: A revision of Bloom’s taxonomy of edu-cational objectives. New York, NY: Longman.
Association to Advance Collegiate Schools of Business International (AACSB). (2004). Business accreditation standards: Standard 15. Retrieved from http://www.aacsb.edu/accreditation/business/standards/ aol/standard15.asp
Association to Advance Collegiate Schools of Business International (AACSB). (2013). AACSB white paper no. 3: AACSB assurance of learning standards: An interpretation. Retrieved from http://www. aacsb.edu/accreditation/standards/2013-standards/
Bacon, D. R., & Anderson, E. S. (2004). Assessing and enhancing the basic writing skills of marketing students.Business Communication Quar-terly,67, 443–454. doi:10.1177/10805699 04271083
Bacon, D. R., Paul, P., Johnson, C., & Conley, T. (2008). Improving writ-ing through the marketwrit-ing curriculum a longitudinal study.Journal of Marketing Education,30, 217–225. doi:10.1177/0273475308322643. Barnes, R., Perry, M., & Stigler, J. W. (1989). Activation of real-world
knowledge in the solution of word problems.Cognition and Learning,6, 287–318. doi:10.1207/s153269 0xci0604_1
Bean, J. (2011). Backward design: Towards an effective model of staff development in writing in the disciplines. In M. Deane & P. O’Neill (Eds.),Writing in the disciplines(pp. 215–235). New York, NY: Pal-grave Macmillan.
Bloom, B. S., Engelhart, M. D., Furst, E. J., Hill, W. H., & Krathwohl, D. R. (1956).Taxonomy of educational objectives: The classification of
educational goals. Handbook I: Cognitive domain. New York, NY: David McKay.
Boatwright, E. W., & Stamps, M. B. (1988). Employers’ importance rat-ings of student characteristics: A conjoint analysis approach.Journal of Marketing Education,10, 74–78. doi:10.1177/027347538801000212 Dunlosky, J., Rawson, K. A., Marsh, E. J., Nathan, M. J., & Willingham,
D. T. (2013). Improving students’ learning with effective learning tech-niques: Promising directions from cognitive and educational psychol-ogy. Psychological Science in the Public Interest, 14, 4–58. doi:10.1177/1 529100612453266
Ericsson, K. A., Krampe, R. T., & Tesch-R€omer, C. (1993). The role of deliberate practice in the acquisition of expert performance. Psychologi-cal Review,100, 363–406. doi:10.1037/0033-295X.100.3.363
Feser, J., Vasaly, H., & Herrera, J. (2013). On the edge of mathematics and biology integration: Improving quantitative skills in undergraduate biology education. CBE-Life Sciences Education, 12, 124–128. doi:10.1187/cbe.13-03-0057
Grinde, R. B., & Kammermeyer, J. A. (2003). Experiences using thematic assignments in an undergraduate management science course.
INFORMS Transactions on Education,4, 23–36. doi:10.1287/ited.4.1.23 Grossman, T. A., Norback, J. S., Hardin, J. R., & Forehand, G. A. (2008). Managerial communication of analytical work.INFORMS Transactions on Education,8, 125–138. doi:10.1287/ited.1080.0010
Khan, R., Khalsa, D. K., Klose, K., & Cooksey, Y. Z. (2012). Assessing graduate student learning in four competencies: Use of a common assignment and a combined rubric.Research & Practice in Assessment,
7, 29–41.
Kimball, B. (1998). Practitioner methodology for entry-level hiring assess-ment: Issues for academic outcomes assessment.Journal of Education for Business,73, 168–171. doi:10.1080/08832329809603823
Koedinger, K. R., & Nathan, M. J. (2004). The real story behind story problems: Effects of representations on quantitative reasoning. The Journal of the Learning Sciences, 13, 129–164. doi:10.1207/ s15327809jls1302_1
Krathwohl, D. R. (2002). A revision of Bloom’s taxonomy: An overview.
Theory into Practice,42, 212–218. doi:10.1207/s15430421tip4104_2 Lage, M. J., Platt, G. J., & Treglia, M. (2000). Inverting the classroom: A
gateway to creating an inclusive learning environment.The Journal of Economic Education,31, 30–43. doi:10.1080/00220480009596759 Liberatore, M. J., & Nydick, R. L. (1999). The teachers’ forum: Breaking
the mold- A new approach to teaching the first MBA course in manage-ment science.Interfaces,29, 99–116. doi:10.1287/inte.29.4.99 Nelson Laird, T. F., Chen, D., & Kuh, G. D. (2008). Classroom practices at
institutions with higher-than-expected persistence rates: what student engagement data tell us.New Directions for Teaching and Learning,
115, 85–99. doi:10.1002/tl.327
Plutsky, S., & Wilson, B. A. (2001). Writing across the curriculum in a col-lege of business and economics.Business Communication Quarterly,64, 26–41. doi:10.1177/1080569901064 00404.
Rittle-Johnson, B., & Koedinger, K. R. (2005). Designing knowledge scaf-folds to support mathematical problem solving.Cognition and Instruc-tion,23, 313–349. doi:10.1207/s1532690xci2303_1
Sigmar, L. S., & Hynes, G. E. (2012). Major difference: An examination of student writing performance by major and its implications for business communication.Editorial Board,2, 133–144. doi:10.5929/2011.2.1.6 Stanny, C. J., & Duer, J. D. (2013). Authentic assessment in psychology:
Using rubrics and embedded assessments to improve student learning. In D. S. Dunn, S. C. Baker, C. M. Mehrotra, R. E. Landrum, & M. A. McCarthy (Eds.),Assessing teaching and learning in psychology: Cur-rent and future perspectives(pp. 19–34). Belmont, CA: Cengage. Stevens, S. P., & Palocsay, S. W. (2004, May). A translation approach to
teaching linear program formulation.INFORMS Transactions on Educa-tion,4, 38–54. doi:10.1287/ited.4.3.38
Strangman, L., & Knowles, E. (2012). Improving the development of students’ research questions and hypotheses in an introductory business
research methods course.International Journal for the Scholarship of Teaching and Learning, 6(2). Retrieved from http://digitalcommons. georgiasouthern.edu/ij-sotl/vol6/iss2/24
Thompson, K. V., Nelson, K. C., Marbach-Ad, G., Keller, M., & Fagan, W. F. (2010). Online interactive teaching modules enhance quantitative pro-ficiency of introductory biology students.CBE-Life Sciences Education,
9, 277–283. doi:10.1187/cbe.10-03-0028
Tucker, B. (2012). The flipped classroom: Online instruction at home frees class time for learning.Education Next,12, 82–83.
Williams, J. A. S., & Reid, R. (2010). Developing problem solving and communication skills through memo assignments in a management sci-ence course. Journal of Education for Business, 85, 323–329. doi:10.1080/08832320903449493
Williams, J. A. S., Stanny, C. J., Reid, R., Martin, K., & Mateeva, V. (2012) Essays in management science.Proceedings of the Southeast Decision Sciences Institute, 436–445. Retrieved from http://www.sedsi. org/2012_Conference/proc/html/proctoc.htm
Wilson, S. G. (2013). The flipped class: A method to address the chal-lenges of an undergraduate statistics course.Teaching of Psychology, 40, 193–199. doi:10/1177/0098628313487461
Zhu, W. (2004). Writing in business courses: an analysis of assignment types, their characteristics, and required skills.English for Specific Pur-poses,23, 111–135. doi:10.1016/S0889-4906(02)00046-7
APPENDIX A: EXAMPLE FIRST PROBLEM, FIRST HOMEWORK ASSIGNMENT MEMO WITH WORD
PROBLEM FOR FALL 2012
MEMO
DATE: August 30, 2012
TO: MAN 3550 Management Scientist
FROM: Bree Green, Production Manager; Patriotism, Inc. CC: Cedric Count, Controller; Sam Spender, Procurement Manager; Gerry Grow, Marketing Manager
RE: Product Mix for Patriotism, Inc. (Assignment 1, Prob-lem 1, due September 13)
How many of each of two sizes of flags should Patriot-ism, Inc. produce in order tomaximizetotal profit? The fol-lowing departments have provided helpful information. Please submit your recommendation at the start of class on September 13.
Production
There are two sizes of flags which require the labor time and materials per flag as shown in Table A1.
Human Resources
The cost for each type of specialist in $/hour is given in the table above. The hours available for each specialist are also given in Table A1.
Marketing
At least 250 of the large flags and at least 325 of the medium flags must be produced. Each large flag sells for $20 and each medium flag sells for $15.
ASSESSMENT OF STUDENT MEMOS 29
APPENDIX B: EXAMPLE RESPONSE MEMO FOR FIRST PROBLEM FIRST HOMEWORK
ASSIGN-MENT SOLUTION KEY FOR FALL 2012
MEMO
DATE: September 13, 2012
TO: Bree Green, Production Manager; Patriotism, Inc. FROM: MAN 3550 Management Scientist
CC: Cedric Count, Controller, Sam Spender, Procurement Manager, Gerry Grow, Marketing Manager
RE: Product Mix for Patriotism, Inc. (Assignment 1, Problem 1)
In response to your query to determine the number of each size flag to produce to maximize profit, I investigated the resources available in terms of specialist labor including cutting, sewing, and tagging as well as the fabric supply. I also considered the marketing requirements to produce at least 250 of the large flags and at least 325 of the medium flags as well as the selling price of $20/large flag and $15/ medium flag. I developed a linear programming model that is detailed in Attachment 1. Also included in Attachment 1 is the Management Scientist software output for my model. (The software output is not included in this paper to con-serve space).
Based on my model with an objective to maximize profit, I recommend the following product mix:
Produce and sell 360 large flags Produce and sell 325 medium flags
The total profit from producing and selling this combi-nation of flags is $7,746.
Attachment 1: Model for Patriotism, Inc. Product Mix
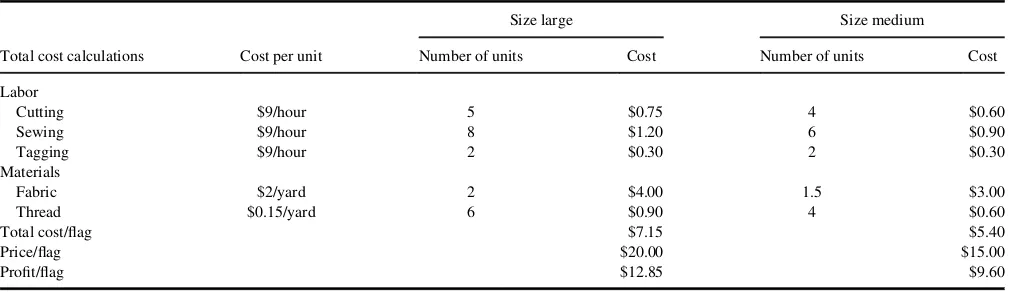
The cost and profit calculations are shown in Table B1.
Legend
X1D# of large flags produced and sold X2D# of small flags produced and sold
Objective Function
MAX 12.85X1C9.6X2 Maximize profit
Constraints
1) 5X1C4X23600 Cutting labor available (minutes) 2) 8X1C6X24830 Sewing labor available (minutes) 3) 2X1C2X22400 Tagging labor available (minutes) 4) 2X1C1.5X23000 Fabric supply (yards)
5) 1X1250 Marketing requirement (large flags)
6) 1X2325 Marketing requirement (medium flags) 7) X1, X20 Non-negativity requirement
TABLE A1
Production and Cost Data for Example Homework 1 Assignment Memo With Word Problem for Fall 2012
Labor and materials per flag Cost per unit Large Medium Resources available Labor
Cutting $9/hour 5 minutes/flag 4 minutes/flag 60 hours Sewing $9/hour 8 minutes/flag 6 minutes/flag 80.5 hours Tagging $9/hour 2 minutes/flag 2 minutes/flag 40 hours Material
Fabric $2/yard 2 yards 1.5 yards 3000 yards Thread $0.15/yard 6 yards 4 yards Unlimited
TABLE B1
Cost Calculations for Example Homework 1 Assignment Memo With Word Problem for Fall 2012
Size large Size medium
Total cost calculations Cost per unit Number of units Cost Number of units Cost Labor
Cutting $9/hour 5 $0.75 4 $0.60
Sewing $9/hour 8 $1.20 6 $0.90
Tagging $9/hour 2 $0.30 2 $0.30
Materials
Fabric $2/yard 2 $4.00 1.5 $3.00
Thread $0.15/yard 6 $0.90 4 $0.60
Total cost/flag $7.15 $5.40
Price/flag $20.00 $15.00
Profit/flag $12.85 $9.60