THE SCALLING OF
MULTIPLE INTELLIGENCE
INSTRUMENT ON THURSTONE
AND LIKERT-TYPES USING THE CLASSICAL THEORY
Farida Agus Setiawati, Yogyakarta State University, Indonesia. [email protected].
DjemariMardapi, Yogyakarta State University, Indonesia. [email protected].
SaifuddinAzwar, Gadjah Mada University, Indonesia. [email protected].
Abstract
The study aimed: 1) to result the scaling data of multiple intelligence (MI) instruments
of Thurstone and Likert types using the classical approach, 2) to reveal psychometric
characteristics of MI instruments of Thurstone and Likert types in the original data and the
scaled data, 3) to compare psychometric characteristics of the two scaled types of data.
The study generally used the quantitative research approach. The activity result
consisted of four interrelated parts: developing the research instrument, processing the data
scaling, analyzing the psychometric characteristics of the instruments, comparing the
characteristics of psychometric instruments. The instrument was developed using Thurstone
and Likert types in the same constructs. The comparison of psychometric characteristics two
type data instrument was analyzed using the classical approaches.
The scaling of MI data shows the scores that have been transformed into z scores. The
result of scaling using paired comparison method are the sequential scores from a low to high
on mathematical-logical, musical, linguistic, kinesthetic, natural, visual, interpersonal,
existential and intrapersonal. Scaling using summated rating produce scores that vary in each
response. There are changes of variants and standard error of measurement (SEM) on the
original data to the transformed data. SEM on the transformed data is lower than of the
original data. The reliability coefficient and SEM of the Thurstone type is lower than Likert
type. The variation of response Thurstone type lower than Likert type caused differences on
reliability and SEM both of them.
Measurement of non-cognitive aspects is indicated by giving score to the result of measurement. Score shows qualification of the attributes being measured. Significance of measurement score can be distinguished from level of measurement. There are four level of measurement, namely nominal, ordinal, interval and ratio (Lord & Novick, 1968, p. 20-21, Allen & Yen, 1979, p. 7-9, Cohen & Swerdlik, 2009, p.73-74). Measurement score of Thurstone and Likert instrument are ordinal data. Analysis of ordinal data can only use mode and median and cannot use mean and standart deviation (SD). Limited measurement by using that data does not fulfill parametric assumption which is related to the data itself. Glenberg (1988: 144) stated that the assumption of parametric analysis is an obtained data that is on interval and ration level. Accordingly, data which is in ordinal level cannot be analyzed by using parametric statistic. Then, the analysis should be conducted is non-parametric statistic. The use of ordinal data in parametric data analysis evokes much contention among the experts. As yet there isn’t a way that leads to an agreement. James Carifio & Rocco Perla (2008, p.1150) stated the similar issues related to contention that has lasted for 50 years. It was about the data being obtained on Likert. Jamieson (2004, p.1212) gave information in which characteristics of data on Likert scale are ordinal data, or rank order data, therefore they must be analyzed using non-parametric statistic which is less sensitive and less powerful comparing to the parametric one. Sumadi Suryabrata, (1998, p.146) claimed that the data being obtained in measurement of psychology is not yet a real interval data. Instead, it is treated as an interval data. One of affords in changing the data into interval data on the result of psychology measurement is by doing a process of scaling, so that the process of scaling on ordinal data can be one of the alternatives in solving that contention.
The scaling is a set of symbol,
numericals or atribut in a range of
continuum by transformed raw score to
scale
scores.
The
raw
scores
are
transformed to scale scores by either linear
or non-linear transformations (Brennan,
2006, p.155). In this study the scaling
associated
to
put
the
psychological
attributes by changing or transforming the
original data than have ordinal levelthat
does not have the same unitof comparator,
into interval or ratio data that have the same
unit.
There are method of scaling. Scaling
method is inseparable from the approach
used. Associated with the measurement of
psychological aspects, Torgerson (1958,
p.46) grouping scaling method in three
ways: 1) scaling method based on the
stimulus, 2) scaling method based on the
responses and 3) scaling methods based on
the subject.
Stimulus-based scaling method is a
method of scaling by placing a series of
stimuli in a continuum of points.
Response-based scaling method is the scaling of the
subject response within a certain point of
range. This methods are arranged based on
the distribution of subject responses. The
example of this method is the Likert scale.
The response subjectsof disapprove to
approve were given in the standardscore.
The scaling method based on the subject,
are put the subjects or individual in
different points in the continuum based of
their test scores. This method is widely
used, for example in grouping students
using IQ scores.
In the last decade, the measurement of psychological aspects have focused on the methods been developed since 1930, that statement’s design to be fake resistent. One of experts who becomes pioneer this methods is Thurstone (1927, p.384). One of his well-known methods is paired comparison. In this method, two stimuli of each item are compared to determine one of both stimuli which represent the condition of the subject. This method is the base of forced choice measurement,The kind of instrument requires subject to choose one statement out of several provided statements.
instrument be spared from same answers or there is bias in giving responses such as an extreme agreement response. It is also stated that by using this type of instrument, weaknesses in responding such as lack of various responses or ‘halo effect’ will be avoided.
The force choice instrument has a strength related to subject response that tends to be spared from social desirability and faking (Mc Donald, 1999, p.24, Chernyshenko, et.al., 2009, p.108). Social desirability is a general statement that tends to be responded by a subject dishonestly, that creates difficulties in finding out the real opinion of the subject. Meanwhile, faking is a tendency of a subject to choose responses that does not represent his/her characteristics or intentionally change his/her responses to make her/him included in the desired group.
The weakness of paired comparison method is related to its large working load. This is caused by each item that requires a chance to be in pairs with item from other aspect (Kwan & Chiu, 2007, p.433). Other weakness of this method according to McIver & Camines (1986:21) is that it is influenced by characteristics of judgment. It is because the process of scaling in this method is related to people who would give judgment. So, the characteristics of judgment will also be influenced by the scaling result. Several weaknesses of this method can be overcome by using a measurement which basis is on subject response. The most frequently used and noted method in developing instrument in social research is the method used in Likert instrument.
The Likert instrument appears in a journal of Archives of Psychology entitled Technigue for Measurement of Attitudes.It’s designed by Linkert Rensis to measure social attitudes. This type were made to measure one's attitude or opinions related to international relations, that are various opinions about America's relationship to peace and conflict with other countries, attitudes toward American military activities and attitudes toward racialism or niggers (Likert, 1932 p.15-20). Although these instruments are used to measure attitudes, he also stated that this type of measurement is not only can be used to measure the opinions or attitude but also used to measure perceptions, psychological characteristics, traits, and personality (Likert, 1932, p.7). Davies (2008,
p.134) also stated that Likert-typeinstrument is widespread and used not only to measure the attitudes and opinions but also to measure the performance and capabilities of human beings.
The Likert has some strengths and weaknesses. The strength is its simplicity and ease in arranging and interpreting instrument (Laerhoven, Zaag-Loonen, Derkx, 2004. p.830). However, critiques toward this type is a high relationship or correlation between one item to another or among items. A high correlation will effect on score weightthat used for consideration item selection (McIver & Carmines, 1986, p. 30). The weakness of this model is enabling the respondents to do faking. Hence, faking makes the research obtains the score of instrument does not represent the real condition.
The scaling is the based element of the processing and formulating theory measurement (Lord & Novick, 1968, p.22). Meanwhile, a well-known scaling with classic theory was done by Thurstone and Likert. Thurstone did the scaling process by using the method of paired comparison and by ignoring assumption of subject variety distribution or case V (Guilford, 1936:156). In other hand, Likert did scaling process by using summated rating method (Shaw & Jack, 1967: 24, Saifuddin Azwar, 2004: 104, Dun-Rankin, et.al. 2004: 105). Scaling process by Thurstone and Likert was done by converting raw scores which were obtained using z score. By applying this scaling process, the intervals among scores employ the same unit. Hence, the obtained data would become an interval data.
2007, the researcher also had developed multiple intelligences instrument; however the instrument had some weakness that requires some improvements. In addition, the scaling process had not been implemented to the instrument analysis. Thus, it is necessary to improve the developed instruments with the scaling process and to re-examine the psychometric characteristics of the instruments.
Psychometric characteristics associated with the attributes of psychological tests. Psychometric characteristics of a variety of characteristics associated with the attributes of the test (Furr & Bacharach, 2008, p.8). Various attributes of psychological tests are: the type of data or score measurement, the reliabilityof measurement data, and validity of measurement data. The concept of reliability are related to the classical theory
The concept of reliability in classical test theory assumptions associated with observedscores (X), true score (T), and error score (E). The main concept in this theory is X = T + E, or the observed score is combination of the truescores and error scores. Based on these assumptions, the concept of variant scores or total variance are combination of the true score variance and the error score variance. The assumptions made in the formula σt
2= σ r
2+σ e
2
(Gulliksen, 1950, p. 34, Lord & Novick, 1968, p.56-57, Allen & Yen, 1979, p.61, Thissen & Wainer, 2001, p.26-27). The reliability of data instrument associated with measurement errors in the measurement data. Djemari Mardapi (2008, p.32) said that measurement error is caused unreliability data that much studied in the social sciences. Based on the concept of scores in the classical theory, the reliability of the measured data can be explained from the variant score. An association between the variant score as mentioned in the assumptions of classical theory can be used to explain the definition of reliability which is a variant of interaction errors and variant score looks. The concept of reliability can be formulated as ρxx '= 1 - σe2 / σx2, where reliability is the magnitude of the error variance and variance score looks. Based on this formula, it can be explained that the larger the error variance will be smaller the coefficient reliability and vice versa.
The term of error measurement related to the error variance or standard error of measurement (SEM). SEM formula is defined as SEM or σe = σt √ 1 - ρxx '. SEM magnitude
affects the reliability, it can be said that the accuracy of measurement results can be seen by the SEM. The smaller the SEM measurement will be more precise, reliable and trustworthy measurement results.
Reliability is a measure of the reliability coefficient is known as measured by various methods. In general there are three ways to measure the reliability of the instrument, 1) re-test or test-retest, 2) parallel or parallel test form and 3) internal consistency.the approach of test-retest was doneby a group of subjects was given twice, with an interval of time, for example a two-week interval. Reliability coefficient of correlation scores measured in the first test and the second test. Correlation between scores on the first test and the second test can be calculated by the formula product moment correlation. Test-retest approaches have suffered from the condition of the subject in the first and second test could change as elements of learning, experience and motivation are different. However this approach is suitable for measurements of skills, especially physical skills.
The reliability on parallel test provides measurements obtained by using two parallel test, such as a first and second group of subjects given. Test reliability coefficient was measured by calculating the correlation between the score of the first and second test. The correlation coefficient can also be measured by using the product moment correlation. This method has limitations due the difficulty of designing a parallel test.
The reliability on internal consistency measure on a group of subjects in a certain time. There are different formulas used to calculate reliability. The formula to analyze the reliability coefficient is done by the variance score using the formula of Cronbach'-alpha. The analyze of coefficient reliability Cronbach-alpha is more used than the other techniques.
Based on the background of the studies described earlier, the aims of the study are as follows:
1. Conducting the scaling result of multiple intelligence instruments on Thurstone and Likert-type with classical and modern theories approach.
3. Comparing the psychometric characteristics of the two types of data that have been scaled using classical and modern approaches.
RESEARCH METHOD
In general, this study applied a quantitative research approach in which the implementation consists of several interrelated parts of the study; the instrument development research, the process of scaling data, the analysis of the psychometric characteristics of the instrumentsand the comparison of Thurstone type and Likert type instrumens.
The first part is the development of research. In the development of research, the multiple intelligence instruments were made by using two types of scaling, namely the Thurstone and the Likert-type scale. Improvements were made to the instruments after having judged by the experts on its content validity. The instrument was further tried in the field. The next part is conducting the scaling process. Scaling process was performed on data classical theory approach. After having scaled, the psychometric characteristics of both types of the instruments would be analyzed. The last part of this research was to compare the psychometric characteristics of the two types of instruments.
In this study, the Thurstone type of instrument reliability analyzed in two ways. The cofficient reliability of every dimension was analyzed by alpha formula, and reliability of the all data dimentions was calculated by internal reliability coefficient of Kendall and Smith (1940, p.330). The reliability of Likert-type instrument was calculated with alpha formula. Because of the study has several dimensions, the reliability analysis using composite reliability of strata alpha. Comparison of the reliability of both types of instruments carried by descriptive.The analysis of the data reseaches be done by descriptive statistic.
RESULT AND DISCUSSION
This study describes the process of scaling; starting from designing the instrument, changing the score, and analyzing the psychometric characteristics of scaling results with approach ofclassical theory. The scaling is applied by using multiple intelligence
instruments with which the items had been created and selected; afterward the selected items were rearranged for the instruments Thurstone and Likert types. Thus, both types of instruments have the same construct and items, but with different types of instruments.
The statement of Thurstone type instrument refers the method of paired comparison or paired comparisons. Each item paired with another item. The subjeck select the one of two statement that most suitable item. In this study one item on one dimension will be paired by the other dimensions. There are 9 dimensions that expressed in the instrument's multiple intelligence. The one items on the one dimension must be paired with another dimension. Therefore there are 9 dimensions would require 36 pairs of items, bringing the total there are 72 items. In each dimension is represented by 8 items. The determination of the items which will be paired with another dimension was done randomly. The Thurstone type of instrument create a pair by doing random each pair was also studied through pilot studied. The data of the one are likely to be similar to the other. The data test results are used as the bases for the design of Thurstone type of instrument that arranged randomly on each dimension to be paired to the items in another dimension.
The design of Likert type was done by making a number of statements that have the same construct with Thurstone type. Each item is presented with a statement and 5 alternative responses. Alternative responses made sequences from 1 to 5 points. Because of the number of items on a Likert type instrument adapts to theThurstone type of instrument, each dimension in this type of instrument is also represented by 8 items, so there are 72 items
Paired-Comparison Scaling
Scaling process is carried out to the result of the study with a total score of 443 subjects. The calculation is done manually with the help of Microsoft Excel program with the following steps:
a. Designing matrix frequency (f), which contains the number of frequencies selected by the subjects to each stimulus pair;
b. Sorting the stimuli from the smallest to the largest;
c. Changing the value of the frequency to the value of the proportion (p), p = f/N; d. Converting the value of p in the form of
score z as the deviation of the average of the normal distribution;
e. Calculating the average score of z on each dimension;
f. Creating stimuli sequence from the smallest to largest score of z.
Based on the calculation using the steps, the obtained scores are 0 for mathematical logic, 0.376 for music, 0.429 for linguistic, 0.575 for kinesthetic, 0.668 for naturalist, 0.714 for visual, 1.031 for interpersonal, 1.065 for existential, and 1.541 for intrapersonal.
The results show that using z score criteria, nine forms of intelligence on the value scale are difference. The logical-mathematical intelligence is the lowest of the others. It shows that there are many students who consider that logical-mathematical is more difficult than the others.
Summated Rating Scaling
The Likert-type instrument scaling process was conducted by summated rating. Scaling calculations were performed with the help of Microsoft Excel program. The scaling calculation begins with counting the number of frequency response (f) of subjects in each criterion on each item. The frequency score was then converted into proportion scores (p) and cumulative proportions. Proportion score was calculated by dividing the frequency (f) with the number of respondents (N). Cumulative proportion (cp) obtained from the proportion in each category plus a proportion of the previous categories. The next process is to calculate the median of cp where the midpoint of the cumulative proportion calculated from half the proportion in the category added with cp of the
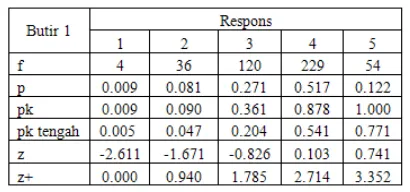
previous category (cpp), or can be formulated as follows: cp-median = ½ p + cpp. The next process is to calculate the value of deviation (z) by converting the median of cp into z scores by referring to the table of the normal curve z. The example calculation of the summated-rating scaling on one item can be seen in Table 1.
Table 1. The Scaling Process of Summated-Rating Method on the Item
The results of the summated rating scaling are z scores for each response of each item. The results showed that the response scores obtained by employing the scaling process are different from the response scores which are not obtained through the scaling process. The score scaling results indicate the ranges between the response scores for each item are not fixed or equal to 1. Scores at response 1 turned into -2.611, response 2 turned into -1.671, response 3 turned into -0.826, response 4 turned into 2.714, and response 5 turned into 0.741.
The data description of the research
subjects’ capability (ө
) before and after
being transformed
The descriptions of the research data
are presented in two forms, namely the raw
data (the original data which are not scaled
yet) and the scaled data (the data which
have been scaled and transformed into z
scores.). The descriptions of the data are
presented
in
each
dimensions
of
intelligence. The research data obtained
through the Thurstone-type instruments are
presented in Table 2 and the research data
obtained
through
the
Likert-type
instruments are presented in Table 3.
Table 2.The Description of the Research Data Obtained through the Thurstone-Type Instrument
Table 3.The Description of the Research Data Obtainedthrough the Likert-Type
Instrument
Tables 2 and 3 show the data on various dimensions indicated on the score of the average, standard deviation, median and lowest and highest scores. Intrapersonal dimension is the highest average score on the instrument type Thurstone, Likert-type instrument while the highest average achieved dimensions of existential intelligence, which has a very small difference with intrapersonal dimension. The lowest score is the dimension of mathematical
logic both Thurstone and Likert type instrument. In both types of instruments owned by the dimensional variations of the highest musical intelligence
There is a change in the central tendency on variation of the data after the data are transformed into z scores. Average and median scores on both types of instruments have increased after the data is transformed. Standard deviation is also changing in each dimension. The standard deviation of the linguistic dimension, logical-mathematical, visual-spatial, musical, and kinesthetic decline in Thurstone type instrument. The dimensions of intrapersonal, interpersonal, naturalist and existential increased after transformed into z scores. The standard deviation of all dimensions decreased on the Likert type instrument.
Reliability Analysis
One of the psychometric characteristics that are often used in classical theory approach is reliability. In this study, the calculation of the reliability of the instrument is calculated by using the formula of the Thurstone-type of internal reliability coefficient of Kendall and Smith (1940), while the calculation of the reliability of each dimension is performed by using the Cronbach alpha formula. The instrument reliability calculation results obtained the overall reliability coefficient; that is 0.64. The results showed that these instruments are quite reliable internally.
Computations of reliability of each dimension on the Thurstone-type instrument are calculated by grouping items that measure the same dimension. The results of each calculation can be seen in the raw or original data and the transformed data in Table 4.
Reliability of the instrument at each dimension doesn’t show significant difference in the raw scores and the scaled scores. However, when it is seen from the standard error of measurement (SEM) on the transformed data, it shows a reduction mainly on dimensions of logical mathematical and music intelligences. While the intrapersonal and existential dimensions clearly increase; on the linguistic, the visual-spatial, the kinesthetic and the naturalist dimensions, there are changes in the standard error of measurement, but the changes are very small, therefore they are not visible in the graph. The results show the dimensions of the instrument which had pretty good reliability, their SEM declined in the transformed data, but the decline did not occur primarily on data that have very low reliability.
The calculations of reliability for Likert-type instrument on each dimension were also calculated by using the alpha formula. The results of each calculation can be seen in Table 5
Table 5.Reliability of Each Dimension of the Likert-type Instrument
There was not much change on the reliability of each the Likert-type instrument before and after the scaling process although the reliability of the raw data was slightly higher than the data that had been scaled, but its changes were very small and less meaningful. However, when it is seen from the standard error of measurement (SEM), the SEM on the data that had been scaled tended to be lower, except for the existential dimensions that slightly increased.
After obtaining the reliability of each dimension, the reliability of the Likert-type instrument was calculated by using composite reliability formula of the Stratified alpha (Cronbach, Schoneman, McKie, 1965; 293, Widhiarso, 2009; 42.43). The overall results of
the reliability turned out reliability coefficient of 0.939 with SEM of 8.422 on raw scores and the reliability of 0.796 with 4.594 SEM on the data that has been transformed into z scores.
The analysis of reliability coefficients of data scores aredecreased in reliability coefficients after the data are transformed into z scores, although this decrease is very small, so it is not quite clear the differences. However, after the scores were analyzed the standart error of measurements (SEM), SEM of the transformed data was decreased. The decline looks quite high, especially in the instruments that have high reliability. These results suggest that the scaling process from the ordinal level of datato the interval level can reduce errors. This result is consistent with the opinion of Salkind (2013, p.31) that the measurement data at a higher level will increase accuracy and provide better information than the lower level.
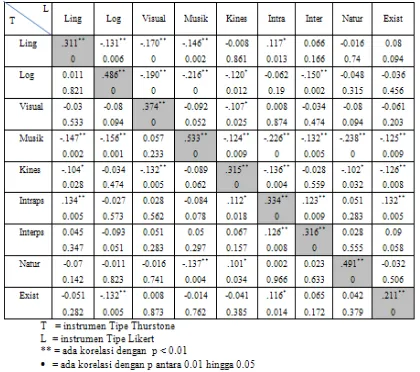
The data scores of The Thurstone and Likert types instrument are different. Although the data score from both types of instruments are different, there are connected each other. The calculation of coefficient correlation from many dimension using the data of Thurstone and Likert type instrument can be presented in Table 6.
Table 6. the Correlation of the Same Dimensions with different types of instruments.
existential dimension. There also have high correlation in different dimensions. There are existential versus interpersonal, intrapersonal and versus interpersonal and intrapersonal versus kinesthetic.
Thecorrelationof the same dimensions using instruments with different types of data showing the relationship of measurement results. Because of the data is retrieved from the same construct, though the method of measurement in a different way. Similarly, a high correlation in different dimensions, the existential, interpersonal and intrapersonal, suggested that the constructs of the instrument related to each other.
The Thurstone-type instrument has different characteristics compared to the Likert-type instrument. Nevertheless, they give different data results of the reliability and SEM by using different method of measurement. Based on the calculation of reliability that has been presented in tables 2 and 3, it can be seen that all the dimensions of reliability of the Likert-type instrument is higher than Thurstone-type instrument. To make it clearer, the reliability of two types of instruments of the data is presented in Figure 1.
Figure 1.Reliability Coefficient between Thurstone- Type and Likert-Typeof Nine Intelligence
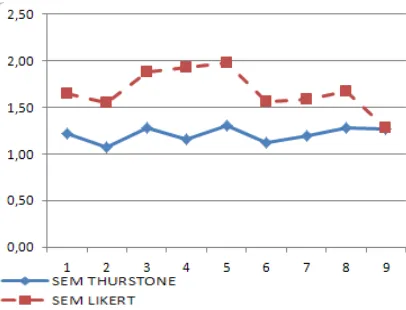
Figure 1 shows that there are obvious differences in the reliability of the Thurstone-type and Likert-Thurstone-type instruments. The reliability of the Likert-type instrument is much higher than the reliability of the Thurstone-type of instrument. However, it can be seen from both SEM, there is a change, where the SEM of the Thurstone-type instrument is lower than the Likert-type instrument. It can be seen in Figure 2.
Figure 2.SEM of the Thurstone and the Likert type Instrument on Nine Intelligence
Figure 2. shaw the reliability coefficient of the Thurstone type of data lower than Likert type. The data of Thurstone type of instrument is lower consistency than of the Likert type. One of the factors that lead to inconsistencies in the results of Thurstone type is every item on this instrument is always paired with other items, so it scores a statement will depend on how much influence to be the partner. Olivares & Bõckenholt (2005, p.265) states, to get a consistent response to the items of the pair is required transitive condition, a condition where if there are 3 variables A, B, C, where A> B, B>C , then A> C. But if it turns out A <C then there is a condition that is not transitive, due to a response that is not internally consistent. Transitive condition is not easily obtained when variables are compared quite a lot.
The internal consistency reliability of the instrument related to the standard deviation or variance measurement data. The size of the reliability associated with the variability or variant score measurement results. Similarly, in defining and comparing the reliability of the results of measurement, to consider also a variant scores on comparable data. By using the formula SEM or σe = σt √ 1 - ρxx 'can be predicted magnitude of an assumed SEM and reliability when two groups of equal variance.
ρyy' = 1-σx2 (1- ρxx') / σy2
ρyy ' = predicted reliability data σx2 = variance in the data set
ρxx ' = reliability of the data that have been defined
σy2 =variant data to be predicted
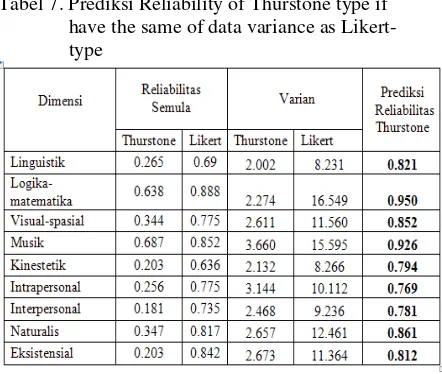
By using that formula can be calculated prediction reliability the Thurstone type based on the same of data variance of Likert-type. Results of prediction cofficient reliability of Thurstone type are presented in Table 7.
Tabel 7. Prediksi Reliability of Thurstone type if have the same of data variance as Likert-type
Table 7 shows the predicted reliability of the Thurstone data become higher if the data variant is similar to the Likert-type. It is caused by the variant of original data of the Thurstone type is small or low and increased. Under these conditions, the low reliability of the data on the original instrument Thurstone type variants are caused by the low variant data and the high reliability of Likert-type instrument due to the high variant data. Furthermore, the SEM instrument Thurstone type can also be predicted based on the data variance Likert type instrument, the results of predictive SEM can be seen in Table 8.
Table 8 shows the acquisition of SEM predictions on the type of instrument Thurstone higher than the original SEM. Increased SEM on the instrument type Thurstone type is caused by variants equated with Likert-type variant. Thus the low SEM of data originally on Thurstone type of instrument is influenced by the low variant Thurstone type of data, and the high SEM on Likert-type data is also affected by higher SEM on a Likert type data.
Table 8. The Predictve SEM of Thurstone Type iif The Same Data of LikertType.
The scores of the variants also influence the coefficient of the reliability and SEM. The low of data variant of Thurstone type caused the low reliability and SEM. Reliability coefficient and SEM of Thurstone type is lower than of Likert-type. It’s coused of The low variant of the Thurstone type. The fundamental differences of reliability coefficient and SEM in both types of instruments are the differences in data variants. Ebel & Frisble (1986, p.83) said that the reliability coefficient will be greater for scores from a group having a wide range of ability than the group more homogeneous in ability. Saifuddin Azwar (1999, P.72) also said that the heterogeneity of a group scores caused over estimate. The reliability cofficient and the homogeneity of groups scores will be under estimate.
CONCLUSION AND RECOMMENDATION
Conclusion
Based on the results of the study presented in chapter 4, conclusions can be drawn as follows: 1. Scaling of multiple intelligences data in the
classical approach results z scores. By using the Thurstone paired comparison, we obtained results from the lowest score to highest score: logical-mathematical, musical, linguistic, kinaesthetic, naturalist, visual, interpersonal, existential and intrapersonal intelligence. Besides, results vary in each response when summated rating on Thurstone and Likert scales were used.
2. There were changes of variance, the mean, the reliability and the standard error of measurement (SEM) of the raw scores to the data transformed using z scores on the classical scaling theory. Reliability of the data before and after the transformation is not increases, but the data is transformed SEM tends to decreases.
3. The variation data of category response caused the psychometric characteristics of the reliability coefficient of Thurstone-type is lower than the Likert-type, both in the overall data and dimension data.
Suggestions
1. The scaling process of the limited classical theory used paired comparison and summated rating method. The use of other methods such as the methods of appearing interval, semantic differential, and ranking methods can be done for the development of the varied instruments scaling.
2. The low reliability coefficient on some dimensions of the Thurstone-type instruments need to be studied further to understand its factors, therefore it can be anticipated in the development of the instrument.
3. In discussing and comparing the concepts of reliability and standard error of measurement, variance of data instrument should be considered.
REFERENCES
Aiken L, R. (1931). Questionnaires & inventories, surveying opinians and assessing personality. Canada: John Wiley & Sons.Inc.
Allen, M. J., & Yen, W. M. (1979). Introduction to measurement theory. Monterey : Brooks/Cole Publishing Company.
Barclay, J.E. & Weaver, H.B. (1962). Comparative reliabilities and ease of construction of Thurstone and Likert attitude scales. The Journal of Social Psychology, 58, 109-120.
Brennan, R. L. (2006). Educational measurement (4nd Edition). Westport: An Imprint of Greenwood Publishing Group. Inc.
Carifio, J. & Perla, R. (2008). Resolving the 50-year debate around using and misusing Likert scales. Medical Education. 42, 1150–1152.
Cohen, R. J., & Swerdlik, M. E. (2005). Psychological testing and assessment, An introduction to tests and measurement (6nd Edition). New York: The McGraw-Hill Companies, Inc.
Davies, R.S. (2008). Designing a response scale to improve average group response reliability. Evaluation and Research in Education, 21, 134.
Djemari Mardapi. (2008). Teknik penyusunan instrumen tes dan non tes.Yogyakarta: Mitra Cendekian Offset.
Dunn-Runkin, P., Knezek, G. A., Wallace, S. & Zhang, S. (2004). Scaling methods, (2nd Edition). Mahwah : Lawrence Erlbaum Associates, Inc.
Ebel, R. L. & Frisbie, D. A. (1986). Essentials of educational measurement. New Jersey: Prentice Hall. Inc.
Furr, R. M., & Bacharach, V. R. (2008). Psychometrics an introduction. Los Angeless: Sage Publications
Glenberg, A. M.(1988). Learning from data, an introduction to statistical reasoning. San Diego : Harcourt Brace Jovanovich, Publishers.
Gulliksen, H., (1950). Theory of mental tests. New York: John Wiley and Sons. Inc. Jamieson , S. (2004). Likert scales: How to use
them. Medical Education, 38, 1212 Kendall, M. G. & Smith,B. B. (1940). On the
method of paired comparisons. Biometrika 31, 324-345
Kwan, Y.K. & Chiu, L.L. (2007). Modification and siplication of thurstone scalling method and its demonstration with crime seriousness assessment. The Hong Politecnic University Research Commity. Laerhoven H, van der Zaag-Loonen H.J.,
&Derkx B.H.F. (2004). A comparison of Likert scale and visualanalogue scales as response options in children’s questionaires. Acta Pædiatrik, 93, 830– 835.
Likert, R. (1932). Technigue for the measurement of attitudes. New York City: Archives of Psychology.
Lord, F.M. & Novick, M.R. (1974). Statistical theories of mental test scores. New York: Addison-Wesley Publishing Company, Inc.
Massof, R.W. (2004). Likert and Guttman scaling of visual function rating scale questionnaires. Ophthalmic Epidermiology, 11, 381-399
McDonald, R.P. (1999). Test Theory : A unified threament. London : Lawrence Erlbaum Associates
McIver, J.P. & Carmines, E.G. (1986). Unidimensional scaling. London : Sage Publications. Inc
Olivares, A.M. & Bo¨ckenholt, U. (2005). Structural equation modeling of paired-comparison and ranking data. Psychological Methods, 10, 285–304
Saifuddin Azwar. (1999). Dasar-dasar psikometri. Yogyakarta: Pustaka Pelajar Offset.
Saifuddin Azwar. (2012). Penyusunan skala psikologis (Edisi 2). Yogyakarta: Pustaka Pelajar Offset.
Salkind, N. J. (2013). Test and measurement for people who hate tests and measurement. Los Angels: SAGE Publication, Inc. Sheares, B. (2007). Midas home page by
Branton Sheares. Diambil pada tanggal 20 januari 2012, dari file:///G:/MI Research.org-Home .htm.
Shaw, M.E. & Wright, J.M. (1967). Scales for the measurement of attitudes. New York: McGraw-Hill Book Company
Suryabrata, S. (2002). Pengembangan alat ukur psikologis.Yogyakarta : Penerbit Andi Offset
Thissen, & Weiner, D. H. (2001). Test scoring. Marwah: Lawrence Erbaum Associated.Thurstone, L.L. (1927). A Law of comparative judgment. Psychological Review, 34, 273-286 Torgerson, W. S. (1958). Theory and methods
of scaling.New York: Wiley.
Thurstone, L.L. (1927). Method of paired comparison for social values. Journal of Abnormal and Social Psychology, 21, 384-400
Van Zanten, V., Chiba, N., Arsmtrong, D., Barkuns, A. N., Thomson, A.B.R., Mann, V., Escobedo, S., Chakroborty, B. & Nevin, K. (2006). Validation of a 7 point global overall symptom scale to measure the severity of dyspepsia symptoms in clinical trials. Journal Compilation, 23, 521-529.