LANDSCAPE VISUALISATION ON THE INTERNET
M. P. Imhof, M. T. Cox, D. W. Harvey, G. E. Heemskerk, C. J. Pettit
Future Farming Systems Research Division, Department of Primary Industries, Victoria, Australia, [email protected]
Commission II, WG II/6: Geo-Visualization and Virtual Reality
KEY WORDS: WWW, Internet, visualisation, animation, spatial information, landscape, knowledge management
ABSTRACT:
The Victorian Resources Online (VRO) website (http://www.dpi.vic.gov.au/vro) is the principal means for accessing landscape-based information in Victoria. In this paper we introduce a range of online landscape visualisations that have been developed to enhance existing static web content around the nature and distribution of Victoria’s landforms and soils as well as associated processes. Flash is used to develop online visualisations that include interactive landscape panoramas, animations of soil and landscape processes and videos of experts explaining features in the field as well as landscape ‘flyovers’. The use of interactive visualisations adds rich information multimedia content to otherwise static pages and offers the potential to improve user’s appreciation and understanding of soil and landscapes. Visualisation is becoming a key component of knowledge management activities associated with VRO – proving useful for both ‘knowledge capture’ (from subject matter specialists) and ‘knowledge transfer’ to a diverse user base. A range of useful visualisation products have been made available online, with varying degrees of interactivity and suited to a variety of users. The use of video files, animation and interactive visualisations is adding rich information content to otherwise static web pages. These information products offer new possibilities to enhance learning of landscapes and the effectiveness of these will be tested as the next phase of development.
1. INTRODUCTION
1.1 Research Aim
Visualisation provides a powerful means for communicating past, present, and future landscapes to a broad range of users. In this paper we introduce a range of online landscape visualisations to support knowledge management activities and enhance existing static web content around the nature and distribution of Victoria’s landforms and soils as well as associated processes. A number of different visualisation techniques are now being used to enhance soil and landscape mapping of Victoria and are progressively being integrated into formerly static map interfaces.
1.2 Geographical Visualisation
There are a growing number of software tools available to create geographical visualisation (GeoViz) products. These broadly include: standard geographical information systems (GIS); open source format languages such as X3D; information models such as CityGML; digital globe packages such as Google Earth and NASA’s Worldwind; multi-media and 3D animation software such as Flash and 3D Studio Max; virtual world platforms such as SecondLife, as well as computer gaming engines such as Unity and Unreal. GeoViz software packages can also be used to create two-dimensional, three dimensional and four-dimensional (temporal) visualisation products to more fully engage or immerse end users in an information exploration experience. (Pettit et al 2010). Appleton et al (2002) note that as public participation in environmental decision-making becomes more prevalent, there is a growing need to communicate effectively with a non-expert audience. Schroth et al (2011) conclude that the development
and use of interactive landscape visualisation serves as a shared platform for developing mutual understanding between researchers and diverse stakeholders. Visual presentation has been identified as an effective means of communicating landscape-related information, particularly due to the increasing ease with which computer visualisation techniques can utilise spatial data. Digital products can also be augmented with a broad range of multimedia components, such as interactive animation, to help explain landscape related concepts. According to Guru and Nah (2001), the literature provides strong support to the notion that media richness, focused attention, interactivity, playfulness and flow contribute towards effective learning. Sheppard and Cizek (2009) conclude that virtual globes offer the benefits of accessibility, interactivity, and engagement in landscape visualisation, together with the promise of accelerated learning.
1.3 Online landscape visualisations
There are many websites providing access to spatially-based landscape data and information. Web-based GIS (webGIS) applications for accessing natural resource data and map services are now prevalent – whereby users are able to access an organisation’s Internet Map Server, send queries and create customised maps. Other sites provide more of an ‘atlas’ function by providing access to static map presentations (Imhof et al 2011). Data ‘clearinghouses’ or ‘warehouses’, for example, function as portals to access and download geospatial data offered by organisations, but may include an interactive map viewer or the ability to produce customised maps. The Atlas of Canada (http://atlas.nrcan.gc.ca/site/english/index.html) is a collection of interactive maps, graphics and images of environment, history, climate change and freshwater datasets. In Australia, the Western Australian Natural Resource ISPRS Annals of the Photogrammetry, Remote Sensing and Spatial Information Sciences, Volume I-2, 2012
Management (NRM) Shared Land Information Platform (SLIP) (http://spatial.agric.wa.gov.au/slip/) provides access to a range of spatial data and information products from state repositories via an interactive map interface. Maps can be selected by region and datasets include soil-landscapes and soil-landscape capability. Other sites provide a more limited content experience, containing only textual and report type information (e.g. Wisconsin Department of Natural Resources website (http://dnr.wi.gov/NaturalResources.html)).
A limited, but growing, number of online sites comprise landscape-based information that can be accessed and explored through the use of interactive, three-dimensional geographical visualisation interfaces (Pettit et al 2010). A selection includes:
The Integrating Spatial Educational Experiences (Isee) website (http://isee.purdue.edu/) (viewed 11/1/12) jointly developed by Purdue University and the US Department of Agriculture, hosts an interactive map of Indiana (USA) displaying landscape and soil survey data. The underlying base map for Isee is aerial photography displayed by the Google Earth API integrated into the website.
Virtual panoramas of Canadian landscapes (360 degree) (http://dimensions360.com/) on the ‘360 degrees around the valley’ website. These include ‘virtual tours’ of cities where users can move from one panorama to another and access information icons. An example is an interactive landscape panorama of the Ottawa Currency Museum where users can travel from one view to another without exiting the panorama by using links (arrows) embedded in the image and click on information icons to access additional information.
The Scotland 360 website http://www.scotland360.co.uk/
provides interactive landscape panoramas that allow users to pan, zoom and navigate within a single panorama. The
Virtual Tour of Hawaii website
http://www.vthawaii.com/index.html provides access to 360 degree interactive panoramas of Hawaiian landscapes aimed at promoting tourism.
There are few examples of online landscape related animations and videos.
The Kansas State University website has online historic videos, including scenes from the1930’s Dustbowl wind storms http://www.weru.ksu.edu/vids/dust002.mpg. showing glacier changes in Glacier National Park (1850-2010)
http://www.nrmsc.usgs.gov/research/glacier_model.htm.
1.4 Overview of VRO
Since 1997, the Victorian Resources Online (VRO) website has been the key means for the dissemination of landscape-based natural resource information via the Internet in Victoria, Australia. The website currently consists of around 11,000 web pages, including 1,900 maps and 1,000 downloadable documents and reports. Information is provided at a range of scales – from statewide and regional overviews to more detailed catchment and sub-catchment levels. At all these levels of generalisation, information is structured in an organisationally agnostic way around key natural resource ‘knowledge domains’ (e.g. climate, landform, landuse, soil, water, biodiversity and
land and water management) and with a focus on spatially-based presentations (Imhof et al 2011).
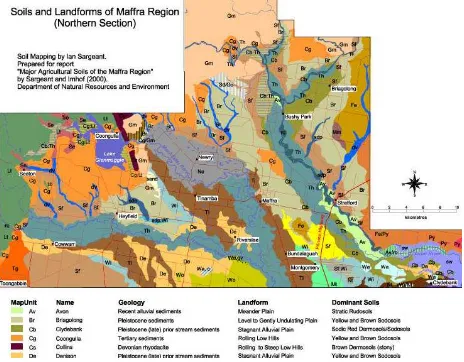
Maps on the VRO website are provided as images (GIF and PNG formats) exported from GIS and modified in Photoshop. Many have some limited interactivity being clickable, via hyperlinks, to enable access to associated information. They therefore have a key role to play in ‘spatial indexing’ for the website. An example of this is provided in Figure 1 for the Maffra region of Victoria based on mapping by Sargeant and Imhof (2000). The map legend summarises the major landforms, geology and dominant soils for each unit and is clickable to access associated static web-pages with descriptive text and images related to the soil/landform mapping unit. Map unit descriptions have, until recently, consisted of text and images and have been static apart from hyperlinks to related information.
Figure 1. Soil/landform map of the Maffra region in Victoria.
2. METHODS
The VRO approach is to make all content available online via a web browser. Content needs to be accessible within the Department using standard software and also to the general Victorian public, who may not have access to high speed internet connection or the latest computer technology. Flash is used to web-enable many of the dynamic visualisation elements used on the website. The Adobe Flash browser plugin comes pre-installed within the Departmental standard software suite and is also widely used – being available on 99% of personal computers in mature markets worldwide, according to a Millward Brown 2011 survey (on Adobe website at
http://www.adobe.com/products/flashplatformruntimes/statistics .html accessed 13/1/12). Flash caters for file-sizes small enough that they can be downloaded reasonably quickly for users without access to high speed internet connections or modern computer technologies. Flash is also a cross-browser and cross- operating system compatible format.
Victorian Government websites are required to provide citizens with ready access, without any discrimination. (
2.1 Map presentations
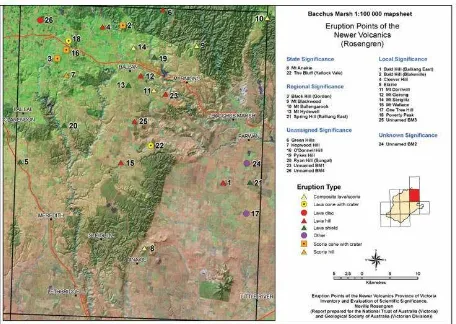
More recently, a number of image-based maps, providing clickable access to site-based information, have been enhanced by draping aerial photography or satellite imagery over the Digital Elevation Model and setting 50% transparency, creating a 3D relief effect. This enhancement aims to provide additional landscape and landuse context to maps. Figure 2 shows an example image map enhanced with 3D relief and air photo background.
Figure 2. Example image map with 3D relief and air photo background.
2.2 Interactive landscape panoramas
Interactive landscape panoramas have been developed using Flash-based software and hosted via a third-party hosting environment. In-house customisations have been made to an “out of the box” website panorama viewer to increase functionality and interactivity. ‘Pop-up’ boxes have been integrated into the panoramas to allow users to discover additional information (e.g. text, images, video, audio).
To create the panoramas, photographs are initially captured on-site via a digital camera mounted on a tripod. A graduated sequence of images is taken using pre-set exposure and ISO levels best suited to achieving overall picture quality or to highlight a particular feature of interest. Around 120 images are taken (depending on the camera type and lens used), usually with around one-third overlap between them. Images are imported into a photo-stitching software tool (e.g. Panorama Tools) to create a seamless equi-rectangular image. The resultant TIFF file is imported to image manipulation software (e.g. Photoshop) for colour correction, brightness and contrast manipulation. The equi-rectangular image is then imported to software that converts it to a cubic panorama that can be web-enabled by Flash and allow optimal file size for web viewing.
2.3 Animations
A range of animated scenes is now provided on VRO that are web-enabled using Flash. These have been developed from ‘storyboards’ – a series of hand-drawn sketches developed with subject matter experts that outline all the successive events in the animation. An entire scene is created that includes all the graphical elements from each of the single storyboards. These are web-enabled using Flash to create a sequence of animated
scenes that users can move through scene-by-scene or play in a continuous animation (with pre-set timing intervals). Synchronised voice-overs have also been included as audio files.
2.4 Video clips
A video camera is used to capture video files on-site that are then converted to an appropriate file format to be used within a Flash-based video player software (JW Player) integrated into webpages. This provides web users with some control, i.e. ability to play, stop and pause. Videos are published in both high and low quality formats to suit different user needs.
Landscape fly-over videos have been created to provide ‘virtual tours’ of landscape features. The desk-top GIS ArcScene is used to overlay spatial information and create 3D scenes. It includes analytical tools and functions that allow the creation of landscape ‘fly-over’ scenes. The basic requirements for creating the 3D movie include a (DEM) or LIDAR (light detection and ranging) data and a geo-referenced air photo raster.
3. RESULTS AND DISCUSSION
Presentation of landscape based information on the VRO website is being enhanced with the incorporation of visualisation products to support standard web content, i.e. text and graphics. Visualisation techniques are now used with the aim to better communicate spatial and scientific information about landscapes to a range of users such as researchers, administrators, educators, students and the general public. Visualisations are also capturing expert knowledge in an explicit way to be used for knowledge transfer.
Digital technologies still rely on maps for representing the spatial distribution of soil and landscapes. Users of maps vary, however, in their requirements, skills and expectations (Imhof et al 2008). Interactive options, including links to text, images, video and animations, provide opportunities to develop more effective ways of representing landscape patterns and processes. Digital products can now be augmented with a range of multimedia components to explain complex concepts (e.g. pop-up graphics, video, interactive animation).
3.1 Knowledge Management
The development of information products is undertaken with appropriate subject matter experts. Their expert knowledge is captured to create information products (i.e. converting tacit knowledge to explicit information). Examples include animations of soil and landscape processes contexted spatially by landscape or land use. It is intended that website users will access information from these authoritative sources to improve their knowledge of the landforms and soils of Victoria. Visualisations and map presentations are an important medium for this (Imhof et al 2011).
The Geomorphology Reference Group was established in 1995 with the aim of reviewing the Geomorphic Divisions of Victoria. The group consists of seven mainly retired specialists who, between them, have over 200 years experience in soil, landform and geological survey in Victoria. This has resulted in the development of clickable maps depicting geomorphological units across the state, linked to map unit descriptions that are now being enhanced with appropriate visualisations developed with these experts.
3.2 Landscape panoramas
A series of 360 degree panorama images are accessible online with zoom and pan functionality and clickable images and text boxes. These are aimed to provide an interactive landscape ‘exploration’ experience for users who are able to move from one panorama image to another and access associated landscape related information (e.g. soil descriptions, observations, site-based data). A panorama of a sub-catchment in the upper Bet Bet Creek catchment of Victoria, provides an overview of the soil and landscape in an erosional upland landscape typified by a high degree of variability in the nature and distribution of soil/regolith materials, landform evolution and salt stores. Six 360o panoramas have been integrated. Users can interact within each panorama (i.e. zoom, pan and click on icons that provide information (e.g. soil pit image and description, remote sensing data) and move from one panorama to another to gain different perspectives across the landscape. Figure 3 provides an example screenshot of a panorama and clickable icons. These visualisations provide users with an on-the-ground perspective, with some level of interactivity and ability to explore the landscape. Virtual globes are increasingly being used in landscape visualisation, but one of their limitations is low data resolution in low-elevation or on-the-ground visualisations, affecting clarity, accuracy and perceived realism (Appleton and Lovett 2003).
Figure 3. Screen shot of interactive landscape panorama in a sub-catchment of the Bet Bet Creek.
3.3 Animations
A series of animations has been developed in partnership with appropriate scientists to visually explain processes that occur in the soil and landscape. Animations are being used to depict complex soil and landscape processes, including the soil carbon and nitrogen cycles, as well as soil acidification and formation of coastal acid sulfate soils; all within the context of an agro-ecosystem. Subject matter specialists have been engaged in the development of these animations (particularly in the development of initial ‘story-boards’), providing an example of harnessing the tacit knowledge of scientists, and providing appropriate context, to create an information product suitable for a broad range of users. The soil nitrogen cycle animation, for instance, has been developed with the input of five scientists, each with a slightly different focus (i.e. farming system, soil biology, chemistry, greenhouse gas perspectives). Figure 4 is an example of a screen shot of part of the acid
sulfate soil animation that provides an understanding of how these soils from in the landscape and how they should be appropriately managed.
Figure 4. Coastal Acid Sulfate Soil animation.
3.4 Video
Video clips are now prevalent on the site, including retired specialists describing features in the field, landscape ‘fly-overs’ and historic scenes (e.g. soil erosion captured in the 1970s). Videos are being integrated into map-unit description pages, providing richer web content and some interactivity for users. Videos will be progressively integrated into virtual landscape models (such as interactive panoramas).
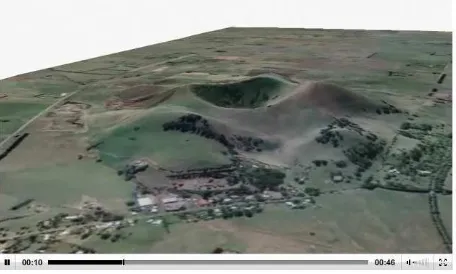
The information provided on the ‘Sites of Geomorphological and Geological Significance’ section of the website has been derived from a number of limited distribution publications and developed in association with retired geomorphology specialists. The website provides maps showing locations of many hundreds of these sites (e.g. Figure 2) that can be clicked on to reveal associated text and images. Video clips are now being routinely used to provide enhanced web content and animations. Content includes landscape fly-overs that have been developed to provide a ‘virtual tour’ of these sites (e.g. ‘virtual tour’ of Mt Noorat example shown in Figure 5).
Figure 5. Mt Noorat landscape fly-over video.
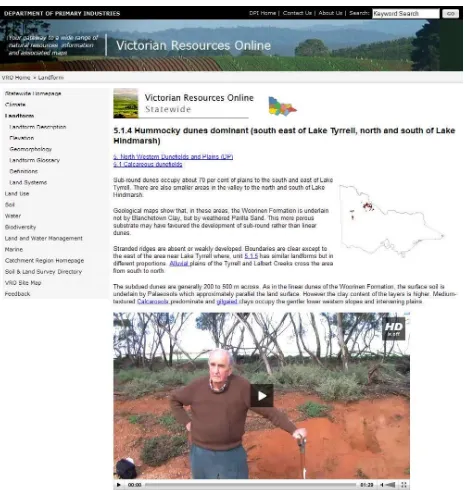
Incorporating videos of experts describing soil and landscape features in the field provides audio-visual richness to otherwise static pages; is a suitable means to capture their tacit knowledge, and allows their legacy to be recognised. In the Mallee region, for example, a retired expert (Jim Rowan who completed a survey of the soil and landforms of the region in ISPRS Annals of the Photogrammetry, Remote Sensing and Spatial Information Sciences, Volume I-2, 2012
the 1960s) has been captured on video describing soil and landscape features on-the-ground. Figure 6 provides an example screen-grab of Jim Rowan describing the soil and landscape of a hummocky dune feature in the Mallee region that has been embedded within a formerly static page.
Figure 6. On-line video clip of retired expert (Jim Rowan) describing landscape features in the field.
4. EVALUATION
General web usage is tracked using a browser side web analytics package (Google Analytics) integrated within web-pages. Tracking code is also integrated within landscape visualisation applications so that they can be separately analysed. Further analysis of this data allows users to be allocated to a particular ‘origin network’, providing useful user-affiliation data (i.e. User Profiling).
Evaluation has indicated a diverse range of users accessing the website. In 2011 the website has been attracting an average of 1,190 ‘user-visits’ per day, accessing an average of over 2,900 ‘pageviews’ per day. User profiling analysis is undertaken to provide analysis of Internet Protocol (IP) addresses and relevant ISPs. During 2011, user analysis was undertaken for all the landform and soil related content on the website. Australian ISPs’ is the largest usage group (56%), followed by ‘Uncategorised’ (15%) and ‘International ISPs’ (14%), but it is not possible to attribute user affiliations to these categories. Of the clearly defined broad user groups, ‘Victorian Government’ (4.5%) and ‘Victorian Education’ (3.7%) represent significant usage. ‘
Initial assessment of the general usage of animation products has commenced. Of the total 3,179 ‘user-visits’ to all six animations on VRO, between 1 July 2011 and 31 December 2011, almost 23% came from ‘Australian ISPs’ and 10% from ‘International ISPs’. Other key usage categories included 6% from ‘Australian Education’ and 3% from both ‘Australian Government’ and ‘Victorian DPI/DSE’ categories.
The next phase of our evaluation will utilise visual analytics to gain a deeper understanding of user perceptions, both during and after interaction with panoramas. This will assist in assessing the value of landscape visualisations for communication and knowledge transfer. A series of controlled experiments with users will be a key means to achieve this, including use of eye-tracking software.
5. SUMMARY AND OUTLOOK
It is proposed to increase visual and interactive web-based material on the VRO website, with the aim of making soil and landscape-based information more realistic and understandable for a wide audience. Interactive panoramas will continue to be developed and progressively linked to soil/landscape map unit descriptions that can be accessed via clickable maps - allowing these maps to become ‘spatial gateways’ to landscape knowledge. Attention will be focused on integrating a range of visualisations, such as videos and animations, into interactive landscape panoramas. The next important phase of this research is to obtain metrics about the usability and value of visualisations, using appropriate visual analytic tools and user-evaluation.
There is an ongoing commitment to capture expert knowledge of landscapes and associated processes, as specialists are aging and not being replaced with new sources of tacit knowledge. Soil/landform mapping (as shown in Figure 1), for example, is based on a conceptual model of the distribution of landforms and associated soils across the area mapped. This conceptual model usually resides ‘in the head’ of the expert surveyor (i.e. tacit knowledge). Making these more explicit, and in ways understandable to a broader audience, is possible with appropriate visualisation techniques. We will, for instance, be developing animations depicting landscape evolution and the formation of landform and soils over time in regions where we have this expert knowledge. Animations will also be developed to depict complex soil and landscape processes.
There is potential to integrate interactive visualisations into KML file format, an Open Geospatial Consortium (OGC) compliant format that can be viewed via a number of GIS and digital globe platforms. Cutting edge landscape visualisations technologies, like Google’s ‘Visualisation API’, show promise for significant improvements to realism and cross-device compatibility, but this technology will need to be more widely supported within the Departmental standard software environment before we proceed.
The use of mobile computing devices (i.e. smart phones and tablets) is increasing and we have recognised some incompatibility issues with the use of Flash-based visualisation solutions on some of these devices. Future development could include specific ‘apps’ that enable animation to work on these.
Visualisation is becoming a key component of knowledge management activities associated with the Victorian Resources Online (VRO) web portal – proving useful for both ‘knowledge capture’ and ‘knowledge transfer’ objectives. The website now incorporates both static and dynamic visualisation products (with varying degrees of interactivity) that have been developed in association with subject matter experts. The use of video files, animation and interactive visualisations adds rich information content to otherwise static web pages and supports more interactive and dynamic exploration and non-linear interrogations of content. Multimedia and rich media need to be ISPRS Annals of the Photogrammetry, Remote Sensing and Spatial Information Sciences, Volume I-2, 2012
further utilised for communicating landscape development, form and function.
Users are more and more used to (and expect) high quality graphics and interactivity. These information products offer new possibilities to enhance learning of landscapes and the effectiveness of these will be tested as the next phase of development.
6. REFERENCES
Appleton, K., Lovett, A., Sunnenberg, G., Dockerty, T. 2002. Rural landscape visualisation from GIS databases: a comparison of approaches, options, and problems. Computers, Environment and Urban Systems, 26 (2-3) pp. 141–162.
Appleton, K. and Lovett, A. 2003. GIS-based visualisation of rural landscapes: defining ‘sufficient’ realism for environmental decision-making. Landscape and Urban Planning 65 (3) pp. 117-131.
Bishop, I. and Lange, E. 2005. Visualization classified. In Visualization in Landscape and Environmental Planning. Ed. Bishop, I. and Lange, E. Taylor and Francis.
Guru, A. and Nah, F.H. 2001. Effect of Hypertext and Animation on Learning. In Managing Internet and Intranet Technologies in Organizations: Challenges and opportunities. Dasgupota, S., Ed.; Idea Group Publishing: Hershey, PA, USA; pp. 50-61.
Imhof, M., Chapman, G., Thwaites, R. and Searle, R. 2008. Communication. In: Guidelines for Surveying Soil and Land Resources. Ed. McKenzie, N., Grundy, M., Webster, R., Ringrose-Voase, A. CSIRO Publishing. 525-546.
Imhof, M., Cox, M., Fadersen, A., Harvey, W., Thompson, S., Rees, D. and Pettit, C. 2011. Natural Resource Knowledge and Information Management via the Victorian Resources Online Website. Future Internet 3(4): 248-280.
Pettit, C., Imhof, M., Cox, M., Lewis, H., Harvey, W. and Aurambout, J-P. 2010. The Victorian Resources Online Geographical Visualisation Portal. In: Proceedings of Joint International Conference on Theory, Data Handling and Modelling in GeoSpatial Information Science, Hong Kong, 26 -28 May 2010.
Sargeant, I.J and Imhof, M.P. 2000. Major Agricultural Soils of the Maffra Region. Department of Natural Resources and Environment, Victoria.
Schroth, O., Wissen Hayek, U., Lange, E., Sheppard, S. and Schmid, W. 2011. Multiple-Case Study of Landscape Visualizations as a Tool in Transdisciplinary Planning Workshops. Landscape Journal. 30. pp.1-11.
Sheppard, R. and Cizek, P. 2009. The ethics of Google Earth: Crossing thresholds from spatial data to landscape visualization. Journal of Environmental Management. 90. pp. 2102-2117.