PLEASE SCROLL DOWN FOR ARTICLE
On: 14 December 2009
Access details: Access Details: [subscription number 912988913]
Publisher Routledge
Informa Ltd Registered in England and Wales Registered Number: 1072954 Registered office: Mortimer House,
37-41 Mortimer Street, London W1T 3JH, UK
Accounting Education
Publication details, including instructions for authors and subscription information: http://www.informaworld.com/smpp/title~content=t713683833
Instructional Case—Activity-based Costing Incorporating both Activity
and Product Costing
J. Gregory Bushong a; John C. Talbott b; David W. Cornell c
a Florida Atlantic University, USA b Wright State University, USA c University of Missouri-Kansas City, USA
To cite this Article Bushong, J. Gregory, Talbott, John C. and Cornell, David W.(2008) 'Instructional Case—Activity-based Costing Incorporating both Activity and Product Costing', Accounting Education, 17: 4, 385 — 403
To link to this Article: DOI: 10.1080/09639280802436632 URL: http://dx.doi.org/10.1080/09639280802436632
Full terms and conditions of use: http://www.informaworld.com/terms-and-conditions-of-access.pdf
This article may be used for research, teaching and private study purposes. Any substantial or systematic reproduction, re-distribution, re-selling, loan or sub-licensing, systematic supply or distribution in any form to anyone is expressly forbidden.
Instructional Case—Activity-based
Costing Incorporating both Activity and
Product Costing
J. GREGORY BUSHONG
, JOHN C. TALBOTT
and
DAVID W. CORNELL†
Florida Atlantic University, USA, Wright State University, USA,
†University of Missouri-Kansas City, USA
Received: October 2006 Revised: June 2007 Accepted: November 2007
ABSTRACT In recent years, accounting educators have responded to pressure from various stakeholders to improve the skills of accounting graduates. The skills demanded by these
constituencies are consistent and include analytical thinking, problem-solving, and
communication skills. The purpose of this paper is to describe our approach to addressing these
issues in our undergraduate cost/managerial accounting classes by supplementing textbooks with
an activity-based costing (ABC) case. The case is unstructured and students are required to prepare both first and second stage allocations, interpret the information, and suggest how management can use the information. An unstructured problem is an ideal setting for activity-based costing because of the difficulties in its implementation. In particular, this case illustrates one of the difficulties encountered in implementing ABC, which occurs when companies collect costs in the general ledger in the traditional functional manner instead of by major production activity.
KEYWORDS: Activity-based cost, instructional case, management accounting
In recent years, accounting educators have responded to pressure from various stake-holders to improve the skills of accounting graduates. The skills demanded by these con-stituencies are consistent and include analytical thinking, problem-solving, and communication skills (Albrecht and Sack, 2000; AICPA, 1999; and AECC, 1990). The purpose of this paper is to describe our approach to addressing some of these issues by supplementing cost/managerial accounting textbooks with an activity-based costing (ABC) case. We use this case in undergraduate upper-division cost/managerial account-ing classes to help our students develop the skills demanded by employers. Students are required to prepare both first and second stage allocations, interpret the information,
Correspondence address: J. Gregory Bushong, Barry Kaye College of Business, Florida Atlantic University, Port Saint Lucie, FL 34986, USA. Email: [email protected]
0963-9284 Print/1468-4489 Online/08/040385– 19#2008 Taylor & Francis DOI: 10.1080/09639280802436632
and suggest how management can use the information. We minimize the mechanical aspects by providing students with guidelines for their preparation. Students must interpret the results of the allocation process and suggest how management may use the information to enhance operational performance. The case illustrates the difficulties encountered in implementing ABC when companies collect costs in the general ledger in the traditional functional manner.
We have organized the paper into three sections. The first section provides a review of the literature as it pertains to revising accounting curricula and to ABC. The second section presents and discusses the case. The final section presents a Teaching Note
related to the case.
Literature Review
The literature relating to both ABC and the need for reforms in accounting education is large. This indicates the importance of both of these topics. We separate the literature review supporting the use of an ABC case to develop the skills demanded by accounting employers into two components. The first component discusses the skills required by employers, while the second reviews the ABC literature.
Skills Required to Become Professional Accountants
Critics complain that accounting curricula are rule-based and demand rote memorization from students, as opposed to educating them (Adams, Pryor and Adams, 1994; Inman, Wenzler and Wickert, 1989; Schultz, 1989; and Zeff, 1989). Nearon (2002, p. 32) suggests accounting education even fails to demand rote memorization since ‘almost all students must take a CPA exam preparatory course upon graduation and even then most candidates do not pass all four parts of the exam on the first try.’ These criticisms are consistent with the findings of the Accounting Education Change Commission (AECC, 1990), which identified two overriding objectives of accounting education. The first objective relates to the content of the accounting curriculum and the second objective to the delivery of that content. The content of the accounting curriculum must create a base for life-long learning, and teaching methods must teach students how to learn on their own. Students must be active participants in the learning process to meet these objectives. Additionally, they must possess the skills, knowledge, and professional orientation required for life-long learning. The AECC defines the intellectual skills as including ‘the ability to locate, obtain, and organize information and the ability to identify and solve unstructured problems in unfamiliar settings and to exercise judgment based on comprehension of an unfocused set of facts.’ Part of their description of knowledge states that the ‘focus should be on developing analytical and conceptual thinking, not on memorizing professional standards’ (AECC, 1990, pp. 307 – 309).
In essence, the AECC is suggesting that accounting curricula should move students to the higher levels of Bloom’s (1956) taxonomy of learning objectives. Some accounting departments have referenced Bloom’s taxonomy while restructuring their program in response to the work of the AECC (Ainsworth and Plumlee, 1993). Additionally, instruc-tors have supplemented textbooks with outside assignments in order to encourage students to achieve at higher levels of Bloom’s taxonomy (Cornell and Bushong, 2005; and Christ, 2002). We have a similar objective while focusing on cost accounting in general and ABC in particular.
Instructional Case—Activity-based Costing
There have been many innovations in cost accounting, but ABC has received widespread attention in the management accounting literature. In fact, a query on the Business Source Primer research database generates in excess of 1000 references. The literature on ABC is vast because its promise is enticing. Cooper and Kaplan (1991, Chapter 5) argue that ABC provides the cost data needed to make improved decisions regarding pricing, product mix, process improvement, and other key operational factors. Other promises include lower costs, improved quality, and reduced manufacturing cycle time (e.g. Anderson and Young, 1999; and Ostrenga, Ozan, McIlhattan and Harwood, 1992).
Accounting academicians and accounting professionals have both contributed to this body of literature. The latter tends to focus on anecdotal implementations of ABC. For instance, Mackie (2006) discusses the challenges and benefits of merging Grenzplankos-tenrechnung (GPK) and ABC in a hospital environment. GPK is a marginal costing system that focuses on a cost-pull approach. It begins with outputs based on customer demand, which drives costs. GPK establishes cost centres and evaluates their efficiency based on the difference between standard and actual costs. He finds many challenges to the implementation, including a vast amount of redefining data items and associating them with activities, and reassigning 600 employees to different cost centres. However, he finds many advantages, including simplicity and operational management buy-in, improved understanding of complex operational areas, and higher quality of information for decision-making. This is typical of the anecdotal contributions made by professionals implementing ABC.
Academicians, however, do not tend to focus on specific implementations of ABC, preferring instead to focus on aggregating and analyzing data relating to it. One strand of academic ABC research has focused on attributes resulting in the successful implemen-tation of ABC. Baird, Harrison and Reeve (2007) examine the success of ABC, in addition to other forms of activity management, and the organizational and cultural factors affect-ing their success. The results of their survey of Australian business units indicate that activity management is moderately successful, with greater use associated with higher levels of success. Success was associated with both organizational and cultural factors. Organizational factors include support from top management and link to quality, while cultural factors include outcome orientation and attention to detail.
Simply defining success of implementing ABC is difficult, however. Shields (1995, p. 153) states ‘Providing a definition of (ABC success) was problematic as the literature is vague about what constitutes success, and discussions with ABC experts during con-struction of the survey did not result in consensus about a tangible definition.’ Shields decides to let the survey respondent determine ‘whatever definition he or she deemed rel-evant’ (1995, p. 154). McGowan and Klammer (1997) use a single-item scale representing participants’ satisfaction with ABC. Foster and Swenson (1997) use two approaches to determining the success of ABC. The first approach, which they refer to as an a priori classification approach, looks at its use in decision-making; actions taken with ABC infor-mation; dollar improvements; and management’s evaluation of the overall success. The second approach uses factor analysis. They find that the alternative measures of success influence the explanatory power of ABC success determinant studies.
Another strand of academic research has focused on problems with collecting the data to implement ABC. Kaplan and Anderson (2007) discuss the fact that ABC has been difficult to implement on a large scale because of the data collection technique. In particular, the surveys used by companies to provide the ABC estimates are too time-consuming and expensive. Additionally, the surveys have a negative effect on the morale of the employees
completing them. They suggest the use of time-driven activity-based costing (TDABC) as an easier tool for estimating resource demands.
Ittner, Lanen and Larcker (2002) look at the performance of the ABC adopters versus non-adopters. They claim that little evidence exists supporting the use of ABC, and that prior research has focused on perceptions of success only. Their analysis of a large sample of manufacturing plants finds ‘modest evidence that ABC is positively associated with manufacturing performance.’ (2002, p. 712) This includes higher quality levels, decreased cycle time, and increased first pass quality. They find however that ABC does not have a significant association with return on assets.
Similar to Ittneret al.(2002), not all of the research supports the use of ABC. Noreen (1991) demonstrates that ABC only provides relevant costs for decision-making if the cost function assumptions embedded in ABC are accurate. These assumptions include cost functions that are linear and separable. Datar and Gupta (1994) show that increasing the number of cost pools in ABC systems can actually increase errors in cost measurement. Additionally, improving the specification of cost allocation bases can have a similar effect. Banker and Potter (1993), Christensen and Demski (1997), and Bromwich and Hong (1999) show that the benefits of ABC vary with competitive markets, input markets, and the organizations’ underlying technology. The conclusion of these studies is that ABC systems are only preferred under specialized conditions.
To summarize, ABC promises to hold many benefits for organizations that implement it. Certain constraints and a difficult implementation, however, may preclude the realiz-ation of those benefits. Therefore, it provides an ideal setting in which to challenge stu-dents to move up Bloom’s taxonomy of learning objectives, thereby meeting some of the goals of the AECC. When formatted correctly in a case, it represents an unstructured and difficult problem. For instance, the determination of the activities and the assignment of costs to those activities can prove to be problematical (Bruesewitz and Talbott, 1997, and Chaffman and Talbott, 1991). Also, while current cost/managerial accounting text-books discuss first and second stage allocation in their coverage of ABC, many assume that companies either do or can collect cost data by major production activity. For example,Cost Accounting, 12th(Horngren, Datar and Foster, 2006) andCost Manage-ment: Accounting and Control, 5th (Hansen and Mowen 2006), present few end-of-chapter problems that require costing activities from the general ledger. We use our case as a supplement to the textbook in an attempt to both introduce the complexities of ABC and to challenge our students to achieve higher levels of learning.
The case requires the students to prepare both first and second stage allocations, inter-pret the information, and suggest how management can use the information. We minimize the mechanical aspects of the process by providing students with guidelines for their prep-aration. The students must interpret the information and suggest how management may use the information to enhance operational performance after completing the allocations. In addition to developing some of the skills the AECC identifies, the case illustrates the difficulties encountered in implementing ABC when companies collect costs in the general ledger in the traditional functional manner. Other advantages of the case, shown in Exhibit 1, include the following.
1. The case illustrates problems in identifying primary activities used for collecting costs. Although we do not require that students identify the primary activities, we discuss the problems that the manufacturing manager and the management accountant encounter in identifying those activities.
2. The case compares traditional cost systems to activity-based accounting, and illustrates how different methods of cost allocation affect the cost per unit.
3. The case illustrates how different assumptions about cost drivers and allocation rates can affect the cost per unit.
4. The case requires that students interpret and use information from an activity-based costing study.
5. The case illustrates how product costs affect other accounting and business problems. 6. The case allows the introduction of complexity and its associated costs into the
class-room discussion.
Exhibit 1.Instructional case background
Lisa Holton, the production manager of Consumer Brands,1had just returned from her favourite fast food restaurant, and she was not pleased. The proliferation of the product lines, thought Lisa, was reminiscent of her own company. If I wanted to eat lasagne or corn on the cob, mused Lisa, I would go somewhere else. It must have taken 15 minutes to serve the lasagne to the person in front of me, and then he said they had burned the lasagne. By increasing complexity in the menu, thought Lisa, the restaurant was undoubtedly hurting quality, uniformity, and speed.
Lisa then picked up the evening newspaper and turned to the business page where she was greeted by an article on Procter & Gamble Co. (P&G) and programs the company had designed to save P&G $2 billion (Harrington, 1996). From using 17 different specifica-tions for a common detergent in dishwashing liquids, P&G cut to a single specification with savings of over $20 million. The company also streamlined the chemicals it used for laundry and cleaning products, which created another $50 million in savings, and P&G was eliminating separate packages for boys and girls in its Pampers Brand.
What really caught Lisa’s attention in the newspaper article, however, was the number of items in a given brand line-up had been reduced 30% since 1990, and P&G executives desired to reduce it another 25%. Head & Shoulders shampoo, for example, had gone from 26 items in its North America line to 15. Cover Girl and Max Factor were also experien-cing tremendous product simplification. Just the opposite of what we have been doing, thought Lisa.
The manager of our marketing department should have been with me tonight at the res-taurant or at least should read this newspaper article, thought Lisa. Over the strenuous objection of some of the production personnel, who argued that the setup costs were astro-nomical, Consumer Brands had introduced a Tiny Bar (1.5 oz) of soap last year to comp-lement the Little (3.0 oz) and Big bars (5.0 oz). Sales had been disastrous.
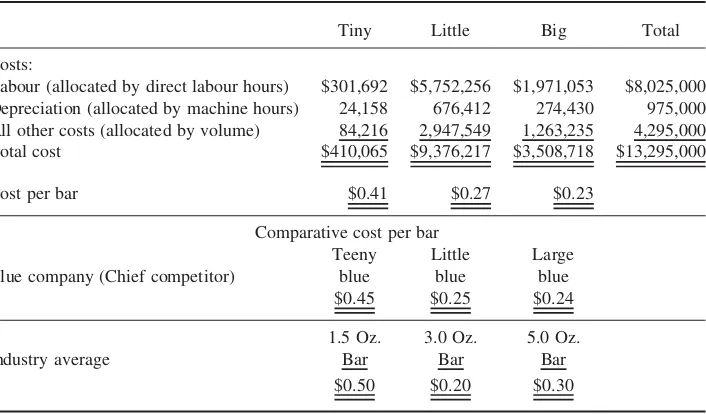
The next week Lisa called a soap team meeting to examine the costs associated with the three sizes of soap. Joe Johnson, the accountant assigned to the soap team, proposed that Consumer Brands consider concentrating its resources on Tiny and Big and reducing or eliminating the output of Little in light of the unit cost data. ‘Here is some information to examine,’ Joe declared as his PowerPoint presentation revealed the information shown in Tables 1 and 2. ‘As you can see, our costs are less than the industry average and our main competitor for both Tiny and Big.’
Lisa Holton looked intently at the labour and overhead costs of the three bars of soap. ‘I’m certainly not an accountant,’ she said, ‘but it does not appear plausible to allocate the total labour cost based on direct labour hours. Thirty-five of our 125 employees are man-agers. Furthermore, I have seen the way the remaining employees categorize their time, and it is not realistic. The labour hours certainly do not capture set-up costs. In addition, it appears arbitrary to allocate the remaining $4,295,000 based on volume.’
Joe Johnson suggested that Consumer Brands perform an activity-based costing (ABC) study to determine the manufacturing costs of the three products. Since many team members were not familiar with ABC, Johnson explained that when companies use
ABC they associate costs with activities required to produce the products instead of allocating the costs directly to products. Once they determine the costs of activities, they use the activities required to produce each product to allocate the costs to the individ-ual products. After gaining a basic understanding of ABC, the team members agreed that Johnson should examine other ways to allocate production costs to the three products.
Johnson previously worked at Navistar International Corporation, a manufacturer of auto bodies and large trucks, and had extensive experience with product proliferation problems and concomitant complexity and costs. Navistar produced 20 different truck models at its Springfield, Ohio facility. In addition, Navistar offered customers numerous
Table 1.Consumer brands annual budgeted labour and overhead costs
Annual costs
Labour (including benefits):
90 production employees $5,400,000 35 management employees 2,625,000
Total labour $8,025,000
Depreciation 975,000
Administrative overhead:
Purchasing 420,000
Cost accounting 400,000
Buildings 480,000
Administration 750,000
Total administrative overhead 2,050,000 Taxes and insurance 350,000 Engineering and research and development 1,000,000
Utilities 695,000
Other 200,000
Total production costs $13,295,000
Table 2.Consumer brands labour and overhead cost allocation – traditional costing
Tiny Little Big Total Costs:
Labour (allocated by direct labour hours) $301,692 $5,752,256 $1,971,053 $8,025,000 Depreciation (allocated by machine hours) 24,158 676,412 274,430 975,000 All other costs (allocated by volume) 84,216 2,947,549 1,263,235 4,295,000 Total cost $410,065 $9,376,217 $3,508,718 $13,295,000 Cost per bar $0.41 $0.27 $0.23
Comparative cost per bar
Teeny Little Large Blue company (Chief competitor) blue blue blue
$0.45 $0.25 $0.24 1.5 Oz. 3.0 Oz. 5.0 Oz. Industry average Bar Bar Bar
$0.50 $0.20 $0.30
options including the choice of 23 different gas tank sizes and various locations for the tanks on the trucks themselves. This occurred although the majority of customers chose only two gas tanks. A cursory study at Navistar indicated that it cost about $20,000 to maintain one part number.2
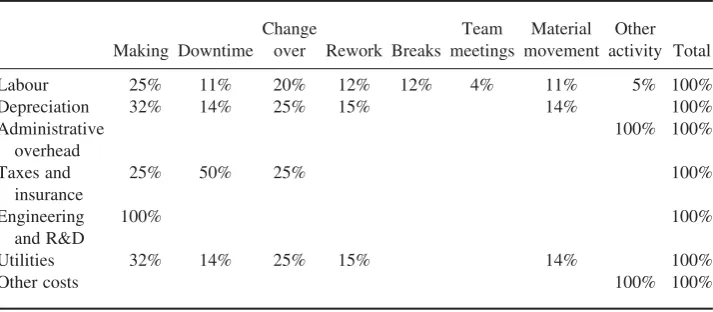
Immediately following the team meeting, Johnson, who had experience implementing ABC at a company other than Navistar, developed a questionnaire, and administered it to the 125 employees. The results obtained were frustrating. The employees indicated that they engaged in over 40 different activities that included over 30 different cost driver possibilities. This will be difficult not only for the accounting professionals to understand, thought Joe, but it will be impossible to communicate effectively to the managers and staff. Joe then re-administered the questionnaire to the employees after reducing the number of potential activities on the questionnaire to 15. He was elated when the questionnaire results indicated that the 125 employees spent 95% of their time on the following seven activities:
1. 25% making the soap;
2. 11% downtime/repair due to equipment breakdown;
3. 20% setting up or shutting down the equipment due to changeover of products; 4. 12% reworking soap;
5. 12% breaks;
6. 4% team building meetings; 7. 11% material movement; and 8. 5% unaccounted for (other).
Owing to his previous experience with ABC, Joe realized that driving the non-labour costs to the above activities was not a science but instead called for judgment. Joe had lengthy discussions with the production people, but he realized that both the lack of avail-able data and the ability to collect it hampered the choosing of resource drivers and the costing of activities. Joe and Lisa finally decided that they should drive costs to the activi-ties in the manner shown in Table 3. I would rather be directionally right than precisely wrong, thought Joe. This will get us pointed in the right direction.
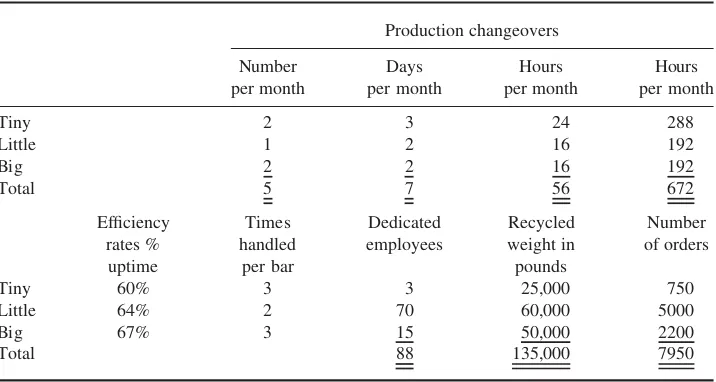
After driving the general ledger labour and overhead costs to the activities (some com-panies call this a first stage allocation), Joe analysed the activities and the potential second-stage activity drivers listed in Table 4. The practical relevance of the drivers was essential,
Table 3.Consumer brands activity-based costing—first stage allocation rates.
Making Downtime Depreciation 32% 14% 25% 15% 14% 100% Administrative
Utilities 32% 14% 25% 15% 14% 100%
Other costs 100% 100%
and they had to identify the necessary data with the three bars of soap so they could drive the activity costs to the products. In some cases, the company was not collecting the necessary data; thus, they had to create the records, which caused delays in the ABC project. What a headache, thought Joe, I will be glad when the project is over. In making the decision for the activity drivers, Joe and Lisa noted that the production process itself was highly automated. While the dedicated employees were not truly unique to the product, Lisa and Joe decided that the breaks and team activity would prob-ably have to depend on this driver. Finally, Joe and Lisa decided to drive the other activity using volume of soap.
Case Requirements
1. Drive the labour and overhead costs to the seven activities identified by Joe. You should allocate any costs you cannot associate to a specific activity to other. (Some companies call this a first stage allocation.)
2. Determine the conversion cost per bar for each of the three product sizes by preparing a bill of activities for each product. (Some companies call this a second stage allocation.) 3. Discuss the reasons for the different per bar cost under traditional costing and
activity-based costing.
4. Discuss the activities and determine whether they are value added or non-value added. 5. Discuss how management might use the output from the ABC calculation in
decision-making.
A Teaching Note and Students’ Assessment
Case Solution
We present the case solution in Exhibits 2 and 3. The first stage allocation, shown in Exhibit 2, allocates all labour and overhead costs to the activities identified in the case. The second stage allocation, shown in Exhibit 3, allocates the activity costs from the
Table 4.Consumer brands additional second stage drivers.
Production changeovers
Little 64% 2 70 60,000 5000
Big 67% 3 15 50,000 2200
Total 88 135,000 7950
first stage allocation to the three product sizes. Exhibits 6 and 7 include the unedited responses prepared by one of our students to questions 3 to 5.
Case Discussion
We use the case in undergraduate upper-division cost/managerial accounting courses. The students are Bachelor of Science in Accounting (BSA) students in their junior year. They complete principles of managerial accounting course in their sophomore year. Both accounting and non-accounting students take the principles of managerial accounting course; therefore, it is general in nature. Only accounting students take the cost/ manage-rial course, so it is more rigorous. We introduce some of the concepts that are in the cost/ managerial accounting course in the principles course, but the complexity and level of detail is much greater in the second course. We assign the case to students to complete outside of class. Requirements 1 and 2 require several calculations to arrive at a final solution, and students must write a report for Requirements 3, 4, and 5. We give the students approximately two weeks to complete the case.
Determination of the Cost per Bar of Soap
We believe students must understand how product cost allocations affect management decisions and ultimately the performance of the company. When students calculate product cost, they become active participants in the learning process. This enhances their understanding of how different assumptions and methods affect product cost. The students must resolve many of the difficulties they encounter without the assistance of the instructor because they are working on the case outside of the class. Often students assist each other in resolving the difficulties encountered. We encourage collaboration, but each student must submit his/her own work. When students construct their own spreadsheets, they obtain a better understanding of how total manufacturing costs affect per unit product cost and how changes in cost or allocation methods affect cost per unit. We believe it is important for students to have experience with cost allocations, since many of our students will perform this task immediately upon entering the work force as management accountants. These are the primary objectives of case Requirements 1 and 2. We provide students with examples of partially completed worksheets for both the first stage (Exhibit 4) and second stage (Exhibit 5) allocations in order to minimize the amount of time spent developing the solution to Requirements 1 and 2. We have found that this allows students to gain an understanding for the required calculations, but keeps them from losing their appreciation for the managerial implications of product costs. The information in Exhibits 4 and 5 provides students with check figures for both the first stage allocation and the second stage allocation. They also provide all activity drivers for the second stage allocation and show how the students should allocate costs of one of the eight activities to the three products.
As indicated above, we require students to use Excel to solve the case. This requirement contributes to the educational value of the case because we can require that students manipulate the variables to determine what effect changes in activities and drivers have on the unit costs. The activity decisions used in the first stage allocation are somewhat arbitrary. We often ask students to suggest different allocation methods for the first stage allocation as an additional requirement. Students can use their allocation rates to cal-culate product costs because of the use of Excel. However, we often do this as an in-class activity. Undergraduate students sometimes believe there is a single product cost. This
Exhibit 2.Consumer brands activity-based costing—first stage allocation—costing activities
Making Downtime Changeover Rework Breaks
Team meeting
Material
movement Other Total Total labour $2,006,250 $882,750 $1,605,000 $963,000 $963,000 $321,000 $882,750 $401,250 $8,025,000 Per cent 25% 11% 20% 12% 12% 4% 11% 5% 100% Depreciation $312,000 $136,500 $243,750 $146,250 $0 $0 $136,500 $0 $975,000 Per cent 32% 14% 25% 15% 0% 0% 14% 0% 100% Total overhead $0 $0 $0 $0 $0 $0 $0 $2,050,000 $2,050,000
Per cent 0% 0% 0% 0% 0% 0% 0% 100% 100%
Taxes & insurance
$87,500 $175,000 $87,500 $0 $0 $0 $0 $0 $350,000
Per cent 25% 50% 25% 0% 0% 0% 0% 0% 100%
Engineering and R & D
$1,000,000 $0 $0 $0 $0 $0 $0 $0 $1,000,000
Per cent 100% 0% 0% 0% 0% 0% 0% 0% 100%
Utilities $222,400 $97,300 $173,750 $104,250 $0 $0 $97,300 $0 $695,000 Per cent 32% 14% 25% 15% 0% 0% 14% 0% 100%
Other 0 0 0 0 0 0 0 200,000 200,000
Per cent 0% 0% 0% 0% 0% 0% 0% 100% 100%
Total production costs
$3,628,150 $1,291,550 $2,110,000 $1,213,500 $963,000 $321,000 $1,116,550 $2,651,250 $13,295,000 Per cent 27% 10% 16% 9% 7% 2% 8% 20% 100%
J.
G.
Bushong
et
al.
Making Downtime Changeover Rework Breaks Team meetings Material movement Other Total Total $3,628,150 $1,291,550 $2,110,000 $1,213,500 $963,000 $321,000 $1,116,550 $2,651,250 $13,295,000 Activity
drivers
Uptime machine
hours
Downtime machine hours
Changeover hours
Recycled weight in pounds
Dedicated employees
Dedicated employees
Number of times handled
Total bars produced Activity
driver base
1,306,560 711,440 672 135,000 88 88 118,000,000 51,000,000 Activity rate
Dollars per base unit
$2.777 $1.815 $3,139.881 $8.989 $10,943.182 $3,647.727 $0.009 $0.052 Tiny—total
dollars
$83,306 $36,308 $904,286 $224,722 $32,830 $10,943 $28,387 $51,985 $1,372,767 Tiny—dollars
per bar
$0.08 $0.04 $0.90 $0.22 $0.03 $0.01 $0.03 $0.05 $1.37 Little—total
dollars
$2,488,077 $914,963 $602,857 $539,333 $766,023 $255,341 $662,360 $1,819,485 $8,048,440 Little—dollars
per bar
$0.07 $0.03 $0.02 $0.02 $0.02 $0.01 $0.02 $0.05 $0.23 Big—total
dollars
$1,056,766 $340,279 $602,857 $449,444 $164,148 $54,716 $425,803 $779,779 $3,873,793 Big—dollars
per bar
$0.07 $0.02 $0.04 $0.03 $0.01 $0.00 $0.03 $0.05 $0.26
Instructional
Case—Activity-based
Costing
395
Exhibit 4.Consumer brands—check figures activity-based costing—first stage allocation—costing activities
Making Downtime Changeover Rework Breaks
Team meetings
Material
movement Other Total Total labour $2,006,250 $882,750 $1,605,000 $963,000 $963,000 $321,000 $882,750 $401,250 $8,025,000 Per cent 25% 11% 20% 12% 12% 4% 11% 5% 100%
Depreciation $312,000 $975,000
Per cent 32% 100%
Total overhead $0 $2,050,000
Per cent 0% 100%
Taxes and insurance $87,500 $350,000
Per cent 25% 100%
Engineering and R&D $1,000,000 $1,000,000
Per cent 100% 100%
Utilities $222,400 $695,000
Per cent 32% 100%
Other 0 200,000
Per cent 0% 100%
Total production costs $3,628,150 $1,291,550 $2,110,000 $1,213,500 $963,000 $321,000 $1,116,550 $2,651,250 $13,295,000
Per cent 27% 10% 16% 9% 7% 2% 8% 20% 100%
J.
G.
Bushong
et
al.
Making Downtime Changeover Rework Breaks Team meetings Material movement Other Total Total $3,628,150 $1,291,550 $2,110,000 $1,213,500 $963,000 $321,000 $1,116,550 $2,651,250 $13,295,000 Activity drivers Uptime
machine hours
Downtime machine
hours
Changeover hours
Recycled weight in pounds
Dedicated employees
Dedicated employees
Number of times handled
Total Bars produced Activity driver base 1,306,560
Activity rate
Dollars per base unit $2.777
Tiny—total dollars $83,306 $1,372,767
Tiny—dollars per bar $0.08 $1.37
Little—total dollars $2,488,077 $8,048,440
Little—dollars per bar $0.07 $0.23
Big—total dollars $1,056,766 $3,873,793
Big—dollars per bar $0.07 $0.26
Instructional
Case—Activity-based
Costing
397
activity highlights the fact that companies base product costs on underlying assumptions and allocation methods and that there is no one correct product cost.
Using the Information Provided by Activity-Based Costing
Case Requirements 3, 4, and 5 reinforce students’ understanding of cost allocation. They also highlight how management uses product costs in decision-making. We show a repre-sentative solution to Requirement 3 in Exhibit 6. Exhibit 7 provides an answer to Require-ments 4 and 5. The solutions shown in Exhibits 6 and 7 are an actual student’s responses to the questions. We included the unedited responses from one of our students to provide an indication of the level that our students are achieving.
Exhibit 6.Consumer brands reasons for cost differences ABC costing versus traditional costing unedited response by a student.
In the traditional costing method, there were only three cost categories: labour, depre-ciation, and all other. Nearly 1/3 of the $13,295,000 total cost had been lumped together into all other, and the accounting department had allocated the entire amount based on pro-duction volume. As a result, the Tiny bars carried very little of the total other cost because of its low production volume when in fact producing Tiny bars drove a high percentage of that total cost. Consumer Brands assigned labour based on employee categorization of activity that everyone admitted was ‘not realistic.’ They allocated depreciation based on machine hours, and it was probably the closest to being correct, although it did not reflect well the downtime/setup costs involved in running production of Tiny bars. In summary, the traditional costing process did not allow for an accurate reflection of the differences in activity required to produce the different sizes of bars even though it resulted in Consumer Brands costing at more than twice Little or Big.
The activity-based-costing effort forced the organization to look hard at what activities existed, why they engaged in those activities and the amount of time that each one took for each product line. Doing this allowed the organization to choose better activity bases for cost allocation, and it became clear that during every production run of Tiny bars there would be a huge ‘whoosh’ heard throughout the plant as costs rushed into the process. While the cost per bar of actually making the Tiny bars was not very different from the making cost for Little or Big, the changeover and rework costs for Tiny were significantly higher due to its extre-mely low volume. Ultimately, the cost of the activities to run the Tiny bars was shown to be more than 10 times the cost per bar due primarily to the high cost of changeover and rework.
Although the case does not state what happened after they studied the ABC data, I would assume that the organization re-evaluated the way they do business on Tiny. It may not be a bad product line; maybe the company just needs to market it differently. If they can increase the volume of orders (and therefore production), Tiny’s cost per bar will fall. It would be very interesting to go back and re-examine the original marketing projections for Tiny. They must have been higher or the company never would have decided to start production in the first place, even at the traditional cost levels. The company should start asking why it is not meeting sales expectations.
Exhibit 7.Consumer brands discussion of manufacturing activities unedited response by a student.
The ABC cost analysis provides Consumer Brands useful information about their pro-cesses. For instance, 10% of their costs are attributable to the non-value-added activity
downtime/repair. There is no information about the portion of downtime that is scheduled for maintenance (and I would argue that scheduled downtime for maintenance is actually value added) versus actual machine breakdowns, but the company should examine the equipment to see if improvements can be made to increase efficiency and reduce costs. Changeover is a non-value-added activity because the company is not producing product; yet changeover caused 16% of the total cost. Consumer Brands must limit the number of changeovers to reduce costs. Rework is also non-value added, but reworking the product caused 9% of total cost. These three activities, which are essentially non-value added, create 35% of Consumer Brands total cost for producing soap. Activity-based costing has illuminated these activities that traditional product costing hid; thus, providing management activities to examine for possible elimination or reduction.
It is not clear whether breaks, team meetings, and material movement are value added or non-value-added activities. The traditional answer would say that meetings and breaks do not add value, and strictly speaking, this is true since employees are not producing product while they are in meetings or taking breaks. However, some employee breaks are essential because a shift with no breaks would probably end up running lower production numbers due to employee fatigue, inattention, and lower morale. The amount of time employees spend taking breaks does not appear excessive if it includes paid lunch breaks. If it does not include paid lunch breaks, then it is excessive. Meetings add value when compa-nies use them for necessary information sharing and training, but some portion of meetings may be non-value added. A certain amount of material movement is necessary, but with 8% of total cost attributable to material movement, it appears improvements in the flow of the product may reduce that cost.
The other category is still nearly 20% of the total cost. Management needs to fully understand what goes into that cost and reduce cost wherever possible. It is difficult to judge whether the activities are value added or non-value added until better information is available.
The only activity that is clearly value added is making the product. However, based on the ABC analysis, making accounts for only 27% of the total cost. Although the Soap Team Manager and accountant based the ABC analysis on several assumptions, it provides management information that they can use to reduce or eliminate non-value-added activities.
The response in Exhibit 7 answers both Requirements 4 and 5, but many students answer these questions separately. Students commonly respond to Requirement 5 that management should eliminate the Tiny Bar from Consumer Brands’ product line. However, the case does not contain enough information to allow students to make that rec-ommendation. After we return the case, we discuss items management should consider before making product line decisions and other strategic implications of the case. Exhibit 8 presents several items management should consider in light of the ABC study before making product line decisions.
Exhibit 8.Consumer brands inputs into product decisions.
. Can consumer brands increase the sales price of the Tiny Bar? Market factors, not cost normally establish prices. Under costing of products often leads to under pricing. Com-petition will normally indicate over costing and overpricing, but the market indicates under costing and under pricing much less lucidly. A pump manufacturer, for example, asked the authors why his sales force was so enamoured with the sale of spe-cialty pumps. The answer was that the pumps were under costed; therefore, under priced and easy to sell.
. Will demand for the company’s other products change if the company eliminates the Tiny Bar? For example, does Consumer Brands sell the Tiny Bar to institutions such as hotels and motels that will stop purchasing other company products if the Tiny Bar is not available? If Consumer Brands’ customers view the three bar sizes as substi-tutes for each other, then sales of the other two sizes may increase. If customers view Tiny Bar as a product that complements the other two bars, then sales of the other two sizes may decrease.
. Will Consumer Brand’s costs actually decrease if they eliminate the Tiny Bar and if so by how much? Only five employees work exclusively on Tiny Bar production. Labour cost will decrease by those five employees, but other costs may or may not decrease. . If demand for the other two sizes does not increase, there may be additional downtime
where the company is not producing product and subsequently not earning revenue.
The case illustrates the typical pattern of how under costing a low volume product often leads to companies losing money on the product. The rework and changeover activities illustrated in this case are non-value-added, and illustrate how companies may under cost low volume products when these types of activities are present. Unfortunately, tra-ditional accounting systems fail to capture this unprofitability. We emphasize that the rework and changeover on low volume products are inevitably costly, and companies must eliminate or reduce these non-value-added activities and increase the volume of the production line to reduce the total cost of low volume products. We show other poss-ible items for discussion in Exhibit 9.
Exhibit 9.Consumer brands additional items for classroom discussion.
. The costing of activities illustrated by the first stage allocation permits companies to more readily focus on value added and non-value-added activities.
. Although this case illustrates the use of ABC in a manufacturing environment, service companies also use ABC. They do not have a physical product to cost, but they do engage in activities, and they do have services. To be successful, service businesses must know the costs of services they provide to their customers.
. ABC often points out the dangers associated with specialized products such as Tiny. Often companies know when specialized products are under costed, but do not know the magnitude. ABC provides a directional response to these intuitive beliefs. . What effect will adoption of ABC for financial accounting have on the company’s
finan-cial position?
Students’ Assessment
Anecdotal evidence suggests that the students view our course as difficult but believe they have learned a lot in the course. Limited student feedback is available through the end-of-semester student evaluations. No specific questions on the evaluation form relate to the ABC case. Instead, there are open-ended questions asking ‘What did you like best about the class?’ and ‘What did you like least about the class?’ Students frequently mention the ABC case in response to both of these questions. Some students complain that the case was too unstructured and/or different from the examples in the textbook or the homework problems. We actually view this type of comment as reinforcement as to the necessity of implementing the case to push students beyond memorization. Additionally, the number of comments expressing satisfaction with the challenge of
learning as opposed to memorization overshadows these complaints. Representative, unedited, comments by students follow:
. The case benefited my understanding of the material since it forced me to understand cost allocation at different stages of the production process. Putting the spreadsheets together facilitated my relational understanding of costs.
. I found the case to be helpful in improving my understanding of the process of perform-ing an ABC analysis. Havperform-ing hands-on experience in buildperform-ing the analysis was wonder-ful preparation for the real world.
. I learned what went on in the first stage allocation and understood the text better. . I felt like the case assignment was great because it gave me some practical experience.
Just working out of the book can feel tedious.
Finally, students at the university at which one author currently works and another author previously worked have had tremendous success in the IMA Case Competition. They have won the competition four times, and they have been semi-finalist another four times. While this is not directly attributable to the case, it is an indication that the stu-dents are receiving a good understanding of cost/managerial accounting.
Possible Expansion of the Case
We have not included certain ABC concepts in the case in order to make it a manageable case for undergraduate students to complete in a two-week time span. Including other ABC concepts, however, can strengthen the case. For instance, an increase in the difficulty of the case and an increase in student thought processes and learning, would result from the inclusion of idle capacity. This introduces the question of whether to drive these costs down to the product. The students can support their answer with a numerical example. A discussion and/or use of cost hierarchy would also strengthen the case. Stu-dents can define cost hierarchy, discuss the reasoning behind the concept, and use it to determine the appropriate cost allocations. Another possible expansion is to have the stu-dents determine the percentages, and their rationale, for the first stage allocations. This would take effort on the instructor’s part to frame the question such that the students can make decisions based on some facts, but it would reinforce their understanding of the arbitrary nature of first stage allocations.
Summary
Over the years, many companies have experimented with ABC, but ultimately reverted to a traditional cost accounting system. However, accountants entering the work force need to understand the advantages and difficulties of implementing ABC. Even though many of our students will not work in a manufacturing environment, many service businesses have implemented or experimented with ABC. Like manufacturers, service businesses must determine the cost of activities before they can determine the cost of products. This case highlights the difficulties in determining the cost of the activities that go into produ-cing a good or service.
Instructors can use the case to illustrate many of the difficulties that companies encoun-ter when they attempt to implement ABC. The case illustrates deencoun-termining activities and costing them, which are both difficult problems in implementing ABC. The case empha-sizes the allocation of costs from a traditional general ledger to the activities and the selec-tion of activity drivers in the absence of perfect informaselec-tion. The case helps students
understand that many variables affect the computed per unit cost of products and that there is no exact per unit cost. More importantly, it illustrates that accounting is a directional, as opposed to a precise, discipline. In addition, students have an opportunity to analyze how management might use the output provided by ABC to make process and product decisions.
The 7 September 1998, issue ofFortunesummarized the annual ‘Management Tools and Techniques Survey’ conducted by Bain & Co (Rigby, 1998). The database included 4,137 responses and 224 personal interviews with senior managers in 15 countries. Seventy-seven per cent of the executives reported ‘management tools promised more than they delivered and even highly rated management tools varied widely in their ability to improve financial results and competitive advantage’ (Rigby, 1998, pp. 162 – 163). According to the article, management tools are more like chain saws than silver bullets since they are potentially powerful but extraordinarily dangerous when applied erroneously. Managers reported that the most dangerous management tools included ABC, knowledge management, and re-engineering. We believe this case will help in miti-gating the ‘chain saw’ possibilities of activity-based costing.
Acknowledgments
The authors would like to thank Jeff Jackson, a former student, for his assistance in the early development of this case. The authors would also like to thank the Associate Editor and two anonymous reviewers for their insightful comments. Their input signifi-cantly improved our paper.
The authors have developed an Excel spreadsheet to use in solving the case and per-forming sensitivity analysis. The authors will supply the spreadsheet and the case in a format suitable for copying and distributing to students on request.
Notes
1Although Consumer Brands (the company in the case) is not an actual company, we based the scenario in
this case on an actual company that wishes to remain anonymous.
2We based this section on discussions with Navistar personnel and a seminar one of the authors performed for
Navistar about activity-based costing.
References
Adams, S. J., Pryor, L. J. and Adams, S. L. (1994) Attraction and retention of high-aptitude students in account-ing: an exploratory longitudinal study,Issues in Accounting Education, 9(1), pp. 45 – 58.
AECC (Accounting Education Change Commission) (1990) Position Statement Number One—Objectives of Education for Accountants,Issues in Accounting Education, 6(2), pp. 307– 312.
AICPA (American Institute of Certified Public Accountants) (1999)Core Competency Framework for Entry into the Accounting Profession(New York, NY: AICPA).
Ainsworth, P. L. and Plumlee, R. D. (1993) Restructuring the accounting curriculum content sequence: the KSU experience,Issues in Accounting Education, 8(1), pp. 112– 127.
Albrecht, W. S. and Sack, R. J. (2000)Accounting Education: Charting the Course Through a Perilous Future
(Accounting Education Series, Volume No.16. Sarasota, FL: American Accounting Association). Anderson, S. W. and Young, S. M. (1999) The impact of contextual and procedural factors on the evaluation of
activity based costing systems,Accounting, Organizations and Society, 24(7), pp. 525 – 559.
Baird, K., Harrison, G. and Reeve, R. (2007) Success of activity management practices: the influence of organ-izational and cultural factors,Accounting and Finance, 47(1), pp. 47 – 67.
Banker, R. D. and Potter, G. (1993) Economic implications of single cost driver systems,Journal of Management Accounting Research, 5, pp. 15 – 31.
Bloom, B. S. (Ed.) (1956)Taxonomy of Educational Objectives: the Classifications of Educational Goals, by a Committee of College and University Examiners. Handbook I. Cognitive Domain(New York, NY: Longmans, Green).
Bromwich, M. and Hong, C. (1999) Activity-based costing systems and incremental costs,Management Account-ing Research, 101, pp. 39 – 60.
Bruesewitz, S. and Talbott, J. (1997) Implementing ABC in a complex organization,CMA Magazine, 71(6), pp. 16 – 19.
Chaffman, B. and Talbott, J. (1991) Activity-based costing in a service organization,CMA Magazine, 64(10), pp. 15 – 18.
Christ, M. Y. (2002) Developing intermediate accounting students’ analytical skills through the annual report project,Advances in Accounting Education: Teaching and Curriculum Innovations, 4, pp. 41 – 57. Christensen, J. and Demski, J. S. (1997) Product costing in the presence of endogenous subcost functions,Review
of Accounting Studies, 2(1), pp. 65 – 87.
Cooper, R. and Kaplan, R. S. (1991)The Design of Cost Management Systems(Englewood Cliffs, NJ: Prentice Hall).
Cornell, D. W. and Bushong, J. G. (2005) The financial statement approach to teaching intermediate accounting,
Advances in Accounting Education: Teaching and Curriculum Innovations, 7, pp. 329– 348.
Datar, S. M. and Gupta, M. (1994) Aggregation, specification and measurement errors in product costing,The Accounting Review, 69(4), pp. 567 – 591.
Foster, G. and Swenson, D. W. (1997) Measuring the success of activity-based cost management and its deter-minants,Journal of Management Accounting Research, 9, pp. 109 – 141.
Hansen, D. R. and Mowen, M. M. (2006)Cost Management: Accounting and Control, 5th ed. (Mason, OH: Thomson South-Western).
Harrington, J. (1996) Retooled brands, new products,The Cincinnati Enquirer, 30 June, pp. E1 – E2.
Horngren, C. T., Datar, S. M. and Foster, G. M. (2006)Cost Accounting, 12th ed. (Upper Saddle River, NJ: Pearson Prentice-Hall).
Inman, B. C., Wenzler, A. and Wickert, P. D. (1989) Square pegs in round holes: are accounting students well-suited to today’s accounting profession?Issues in Accounting Education, 4(1), pp. 29 – 47.
Ittner, C. D., Lanen, W. N. and Larcker, D. F. (2002) The association between activity-based costing and manufacturing performance,Journal of Accounting Research, 40(3), pp. 711 – 726.
Kaplan, R. S. and Anderson, S. R. (2007)Time-Driven Activity-Based Costing: a Simpler and More Powerful Path to Higher Profits(Boston, MA: Harvard Business School Press).
Mackie, B. (2006) Merging GPK and ABC on the road to RCA,Strategic Finance, 88(5), pp. 33 – 39. McGowan, A. and Kammer, T. (1997) Satisfaction with activity-based cost management implementation,
Journal of Management Accounting Research, 9, pp. 215– 235.
Nearon, B. H. (2002) A radical proposal for accounting education,The CPA Journal, 72(10), pp. 29 – 33. Noreen, E. (1991) Conditions under which activity-based cost systems provide relevant costs,Journal of
Man-agement Accounting Research, 3, pp. 159– 168.
Ostrenga, M. R., Ozan, T. R., McIlhattan, R. D. and Harwood, M. D. (1992)The Ernst & Young Guide to Total Cost Management(New York, NY: John Wiley & Sons).
Rigby, D. K. (1998) What’s today’s special at the consultants’ cafe´?Fortune, 7 September, pp. 162– 163. Schultz, J. J. (Ed.) (1989)Reorienting Accounting Education: Reports on the Environment, Professoriate, and
Curriculum of Accounting,Accounting Education Series 1(Sarasota, FL: American Accounting Association). Shields, M. D. (1995) An empirical analysis of firms’ implementation experiences with activity-based costing,
Journal of Management Accounting Research, 7, pp. 148– 166.
Zeff, S. A. (1989) Does accounting belong in the university curriculum?Issues in Accounting Education, 4(1), pp. 203 – 210.