STANDWISE CHANGE DETECTION FOR GROWING STOCK USING REPEAT-PASS
ALOS PALSAR / PALSAR-2 DATA
M. – G. Hong a, C. Kim b *
a Dept. of Applied Information Technology, Kookmin University, Seoul 02707, Korea – [email protected] b College of Forest Science, Kookmin University, Seoul 02707, Korea – [email protected]
Theme Sessions, ThS 7
KEY WORDS: Gamma-Nought, Growing Stock, ALOS PALSAR, PALSAR-2, Backscattering Coefficient, Stand Growth
ABSTRACT:
This study demonstrates the possibility of detecting the changes of growing stocks in mountainous forest stands derived from ALOS PALSAR and PALSAR-2 images. The ALOS PALSAR were obtained over the Kwangneung Experiment Forest (KEF, Korea) during the period of nineteen and a half months from the April 26, 2009 to December 12, 2010, whereas the PALSAR-2 data were acquired on the April 7, 2015. The KEF test site comprises 58 stands, which cover approximately 1,000ha and have steep slope topography. Owing to topographic effects of SAR data in mountainous areas, the DEM-assisted topographic normalized backscattering coefficient γ0 was applied to the evaluation of the relationships between the ALOS PALSAR / PALSAR-2 HV backscatter and the field inventory–based stand stock volume. The results indicate that: 1) the γ0 values for the volume obtained from ALOS PALSAR data on December 12, 2010 show a gradual increase higher than those computed from the data on April 26, 2009, here the γ0 value increases in accordance with an increase in the volume: 2) the γ0 values determined from the PALSAR-2 data increase with the same inventory-based volume, when compared with those computed from both ALOS PALSAR data. They also increase substantially as the values of the volume rise, with the exception of the volume interval from 130 m3 ha-1 to 160 m3 ha-1. This is understandable because the volume of the aforementioned interval has been reduced through clearing. Consequently, the γ0– based relationship between PALSAR-2 HV backscatter and growing stock can lead to detecting the stand growth changes in the KEF of Korea.
1. INTRODUCTION
For the last decade, the global satellite market has seen a steady growth and has been dominated by optical satellite images. However, the demand for Synthetic Aperture Radar (SAR) image is increasing. The recent improvement in the images from SAR is expected to facilitate a higher demand, while facilitating the new application market.
SAR can supplement the shortcomings of the optical images and securing data in a reliable manner regardless of the weather conditions. Therefore, it is suitable for strategic/commercial purposes for monitoring observations.
Consequently, the demand of using this method to trace the changes in vegetation is increasing. The translation of SAR imagery requires understanding the dispersion and noise characteristics uniquely found in radars and considering the topographical compensation and effects. Therefore, it requires a different set of skills that are not used in the existing optical image-based analyses.
As high-resolution SAR images became available, there is an active trend involving many forest monitoring researches over a given period of time using SAR images, both in Korea and other countries.
There are cases based on images from multiple periods, where the changes were detected using the backscatter of the objects and the correlations with them (Bruzzone and Bovolo, 2012). Some others involve detecting changes using the differences in the amplitudes and the phases (Scheucl et al., 2009). The detection of the log-ratio analyses determines the ratio of the comparable images, eventually detecting changes using statistical methods (Bovolo et al., 2013). The method of
detecting changes requires the setting of the threshold values that identifies the areas with and without changes.
The methods to set the threshold value can be divided into 6 types, which can be configured differently depending on the application of the images (Cao and Martinis, 2015).
Moreover, the studies of the forest biomass utilizing the SAR has been around since 1990. The forest biomass requires that the essential biodiversity and climate variables should be considered.
The growing stock volume is highly dependent on the above ground biomass in the forest ecosystem. In addition, a regression analysis using all of the biomass elements (the canopy, stems, branches, foliage, roots, and understory) will enable the evaluation of the entire biomass.
Various studies have reported that the backscattering coefficient at L-band saturates at about 50-150 tons/ha-1. Moreover, cross polarized backscatter appears to be most sensitive to forest biomass (Lucas et al., 2010).
In this study method, we estimate the forest biomass through a relational equation between the SAR data and the field survey data.
Furthermore, two methods were applied, as shown below, to detect changes in multi-temporal SAR images acquired between 2009-2015.
First, the gamma-nought (γ0) for each stand according to the stand volume was computed to calculate the disparity between the images.
2. STUDY DATA AND AREA
In this study, the repeat-pass ALOS PALSAR / PALSAR-2 data were used to detect changes in the growing stock.
PALSAR/PALSAR-2, which is used in this study, is one of the three sensors mounted on the earth-observation satellite, ALOS/ALOS-2 (PALSAR, AVNIR-2, and PRISM).
As the sensor provides the multi-polarization L-band, it is used for more diverse applications as compared with the Japanese Earth Resource Satellite, JERS-1, which is the first SAR of JAXA, or Japan Aerospace Exploration Agency.
Table 1 shows the characteristics of PALSAR/PALSAR-2, which we used for this study
.
and-left looking function, currently not available on ALOS PALSAR.The ALOS PALSAR data taken over the Kwangneung Experiment Forest (KEF, Korea) span nineteen and a half months, from the April 26, 2009 to the December 12, 2010, whereas the PALSAR-2 data were acquired on April 7, 2015.
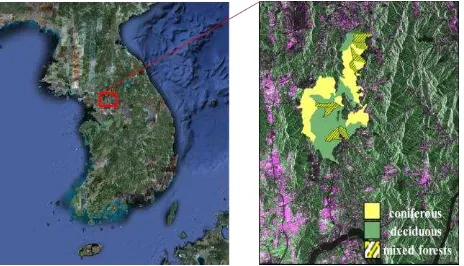
Fig. 1. ALOS PALSAR FBD34 composite of HH/HV/HV, image data acquired on March 20, 2007 over the KEF study
area overlaid with forest stand boundaries(center), DEM data(right).
Table 1. Characteristics of the used PALSAR-2 and ALOS PALSAR data ALPSRP226610740 Namyangju-si, Korea 2010.04.26
ALPSRP160160740 Namyangju-si, Korea 2010.12.12
<ALOS PALSAR data>
Fig. 1 shows the combined image of the HH/HV/HH, overlapped on the stand boundary vector of KEF
The stand size varied between 5.4 - 64.04 ha with an average of 34.34 ha. The reason why KEF has been selected as the study area are as follows.
First, the KEF is subject to five forest surveys, with the first one in 1964. This provides a good amount of data that can be used for this study.
Second, the stand volume exists with a 112-467m3/ha area, and each stand has a different stand volume, making it an ideal subject for the study.
Third, the area can serve the purpose of this study, as it contains 23 coniferous stands (with more than 75% being coniferous contents), 33 broad-leaved sands (with more than 75% being broad-leaved contents), and 9 mixed stands (the ratio of coniferous trees between 25% and 75%), totaling to 65 stands of varying types.
3. METHODOLOGY
3.1 SAR change detection using log-ratio analysis
All the PALSAR images contain noises, and the noises originating from the errors in the reflected signal off the surface can be divided into two types.
First, the errors in measurement become of noise in the SAR data can be determined using the signal to noise ratio.
The second type of noise is the speckle noise, which is caused by the interference between the electromagnetic waves, owing to the existence of a large number of reflecting bodies within the pixels in the SAR image. To extract good quality data included in the SAR data, it is imperative to remove the noise In case of the SAR images, addressing the issues such as, the diversity in the spectacle noises and the backscatter coefficient is important before detecting the changes.
During the pre-processing, the images taken over different periods of time can be co-registered, to remove the speckle noises and normalizing between the two images.
Let us assume that there are two different images I1 and I2 of the SAR amplitude obtained at different times, x and y.
(1)
(2)
The SAR system coherently processes the signals from the transmission and reception pulses. Therefore, the feed inherently contains speckle noise, rendering feed analysis difficult. To address this issue, there have been various study efforts, including (Bovolo and Bruzzone, 2007) and (Qiu et al., 2004). This study uses the Multi-Look method, which divides the sections into multiple subsections in an attempt to minimize the influence of the speckles.
Moreover, the signal strength or brightness of the SAR feed may vary significantly depending on the orbit, time, altitude, or direction of the satellite that captured the images.
Detecting the changes requires normalizing the properties of the two images.
There are active studies going on in order to develop a method that can analyze the changes automatically in all areas of the SAR images.
In this method, the images are compared mainly by normalizing the gray level of the images. The gray levels are determined by the structural or genetic properties.
As such, if the ratio of the relative strength between the video images is used, the setting of the threshold value becomes very important, to identify a change.
The threshold value can be determined depending on the type, resolution, and characteristics of the sensor.
Moreover, it can be set subjectively based on the user who wishes to perform the analysis.
The algorithm for setting the threshold value to identify a change can be designed differently depending on the type of the video or the applications. Of these the Kittler and Illingworth (K&I) method is known to provide universally consistent performances (Krylov, 2011).
The K&I method uses statistical determination theory and is designed assuming that the Gaussian distribution of the image sets the threshold value that can minimize the error.
However, the statistical distribution of a SAR image may differ depending on the characteristics of the sensors or the topology. Therefore, the K&I method that is based on the Gaussian distribution may not be appropriate for SAR images.
The method using the log-ratio algorithm may reduce the error due to the speckle noise. Furthermore, as this method sets the distribution of the images only with relative changes between the two images, it is suitable for the analysis of SAR images. Therefore, in this study, a change detecting image is created through log-ratio analysis by using the image between 2009 and 2010 and the one between 2009 and 2015; namely the SAR images that conducted the pre-treatment process.
Under the presumption of two cases that there is a change and no change, it analyzes the comparative images of increase and decrease of pixel log value intensity when the histogram of image is made of log-normal distribution.
3.2 Calculation of Gamma-nought
As well as SAR change detection based on log-ratio analysis, change detection using the disparity of the gamma-nought value of each different stand for the stand volume is performed. For this reason, we used the DEM method for this study, which resulted in the production of the topology-compensated gamma-nought. The gamma-nought images were classified by the directions, namely fore-slope and far-slope. Using this classification, their relationship with the field inventories-based stand volume was analyzed, so that the shadow effect could be minimized.
The fore-slope (here, west-facing slope) corresponded to the tilted surface toward the PALSAR sensor. The far-slope (here, east-facing slope) corresponded to the tilted surface opposite to the PALSAR sensor
Also, creating an image for comparison is necessary, to detect changes between two images. In case of the SAR images, the typical choice is either comparing the differences in the values of the pixels to measure the changes in the strength of the signals in the SAR images, or the ratio of the sizes. The method using difference the operator, has different statistical distribution based on the changes in the relative gray level and the reference gray level (Bouvet et al, 2009).
In this study, depending on the range of the stand volume, the gamma-nought values of the SAR images of different times were estimated. Then, using the ratio operator, the image to detect the changes was created.
4. RESULT AND ANALYSIS
In this study, gamma-nought disparity and log-ratio techniques were used for SAR change detection. First, conifer forests (23 stands) and deciduous forests (33 stands) were analysed, with the exception of the mixed forests (9 stands) out of the 65 stand of KEF.
After classifying SAR images by each stand, the correlations of the stand volume and gamma-nought of each stand were analyzed (refer to Fig. 2).
The gamma-nought values derived from PALSAR-2 data always had values higher than the two gamma-nought values of ALOS PALSAR data. 101212 PALSAR gamma-nought mostly showed higher values than 090426 PALSAR gamma-nought except for some stand volume section.
Moreover, gamma-nought of all SAR images showed escalating tendency as the stand volume increased.
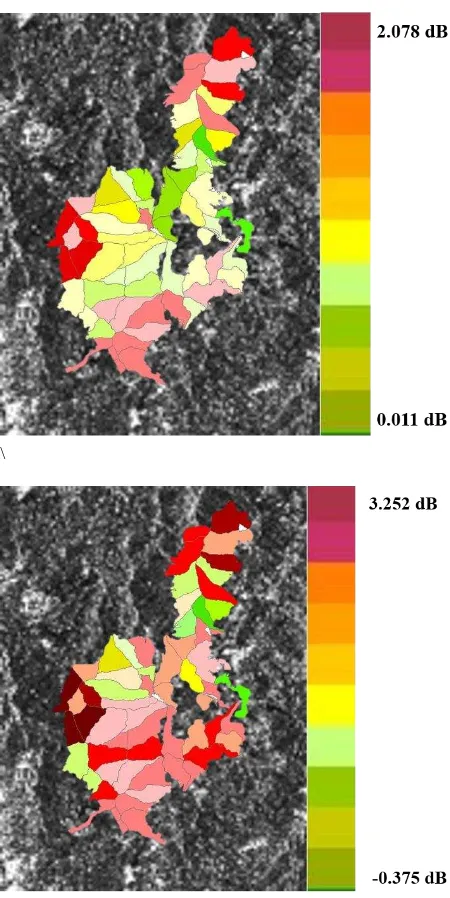
A 0.011 – 2.078 dB disparity of 090426 PALSAR gamma-nought and 101212 PALSAR gamma-gamma-nought was computed, and disparity of 090426 PALSAR gamma-nought and 150407 PALSAR-2 gamma-nought showed 0.320 – 3.252 dB (refer to Table 2).
In addition, when all gamma-nought values reach a certain stand volume, the increase is reduced, and the 310 - 340m3/ha range is decided as the critical value.
The change detection image for each stand through gamma-nought disparity of the SAR image for each period was displayed in Fig. 4. The stand volume change of the 56 stands can be analyzed, and the area with severe changes is considered as the forest area where logging or forestation projects are carried out.
This research studied the change detection based on the log-ratio analysis as well as the change detection using gamma-nought disparity.
A SAR change detection image based on the log-ratio algorithm is like the one shown in Fig. 3. Through the comparative image created, statistic distribution for each image was computed. As a result of analyzing change detection through computed statistic distribution, the distribution error of the change detection image between 2009 and 2010 was 0.1035, and the detecting probability can be created.
Additionally, the results of putting the parts where there was a change on the created change detecting map in the log-ratio image are as follow.
First, the change detection was possible through pixel histogram distribution error, and not gamma-nought disparity.
Second, only the error of a certain change, the one over critical value was detectable.
When creating the SAR change detecting image by using the log-ratio analysis, most of the SAR images were decided to have change, and the degree of change, more or less, was displayed according to the stand.
Fig. 2. Differences in the standing volume estimated from PALSAR-2 / ALOS PALSAR data
Fig.3. The SAR change detection images based on the log-ratio algorithm (2009-2010, left; 2009-2015, right)
Table 2. Gamma-nought values for the stand volume over field measurements in 2009
Stand volume (m³/ha)
090426 PALSAR
Gamma nought
101212 PALSAR
Gamma nought
150407 PALSAR-2
Gamma nought
100-130 -11.812 -11.781 -10.565
130-160 -10.934 -9.987 -10.531
160-190 -10.391 -8.313 -7.139
190-220 -7.763 -6.092 -5.774
220-250 -6.135 -5.864 -5.011
250-280 -5.524 -5.012 -4.511
280-310 -4.535 -3.874 -3.124
310-340 -3.640 -3.589 -2.412
340-370 -3.988 -3.512 -2.221
370-400 -3.452 -3.441 -3.132
400 < -3.114 -2.977 -3.439
\
Fig. 4. The change detection images for each stand through gamma-nought (2009-2010, top; 2009-2015, bottom)
5. CONCLUSION
Recently, as high resolution SAR images could be acquired, the field using SAR imagery has expanded. In particular, research in the field of vegetation detection is under brisk progress. In the past, a SAR change detecting algorithm necessitated the creation of a change detecting map. However, in the case of a high-resolution SAR image, apart from the Gaussian distribution, it has diversified distributions that are different from those of the low-resolution image thus, it cannot be presumed to be a Gaussian distribution.
Therefore, in this research, the stand volume change for each stand using multi-temporal SAR data was computed by applying change detecting techniques suitable for high resolution SAR image.
Also, the changes in the gamma-nought values of all SAR images seen through the graphs showed the threshold values at a certain stand volume.
That is, in the range of 310-340 m3/ha the gamma-nought showed almost no increase. In addition, it could decide stand volume changes by stand for the change detecting technique that has used log-ratio technique and the technique using gamma-nought disparity.
However, the log-ratio technique could not compute the stand volume amount of the change of each stand and could only check the changeability through pixel distribution error. Therefore, the stand volume statistic distribution of the SAR image shall be estimated to compute variables suitable for this case and set up the critical value.
In the case of SAR change detection at the forest area, there are errors owing to shadow effects thus, gamma-nought computation is necessary. Furthermore, the critical value for each stand shall be analyzed in the future and additional research is required for the log-ratio analysis.
ACKNOWLEDGEMENTS
This study was held under the National Research Foundation of Korea (NRF) project. ALOS PALSAR & PALSAR-2 data were provided by the JAXA Earth Observation Center.
REFERENCES
Bruzzone, L., and F. Bovolo, 2012. A Novel Framework for the Design of Change-Detection Systems for Very-High-Resolution Remote Sensing Images, Proceedings of IEEE, Vol. 101, No,3, pp.609-630.
Bouvet, A., T.L. Toan, and N. Lam-Dao, 2009. Monitoring of the rice cropping system in the Mekong Delta using ENVISAT/ASAR dual polarization data, IEEE Transactions on Geoscience and Remote Sensing, Vol. 47, No. 2, pp. 517-526.
Bovolo, F., C. Marin and L. Bruzzone, 2013. A Hierarchical Approach to Change Detection in Very High Resolution SAR Images for Surveillance Application, IEEE Transaction on Geoscience and Remote Sensing, Vol. 51, No.4, pp.2042-2054.
Bovolo, F., and L. Bruzzone, 2007. A Split-based Approach to Unsupervised Change Detection in Large-size Multitemporal Images: Application to Tsunami-Dmage, Assessment, IEEE Transactions on Geoscience and Remote sensing, Vol.45, No. 6, pp. 1658-1670.
Cao, W., and S. Martinis, 2015. SAR-based change detection using hypothesis testing and Markov random field modelling,
The International Archives of the Photogrammetry, Remote Sensing and Spatial Information Sciences, Volume XL-7/W3, 36th International Symposium on Remote Sensing of Environment, pp.783-790.
Krylov, V. K, G. Moser, S. B. Serpico, and J. Zerubia, 2011. On the Method of Logarithimic Cumulants for Parametric Probability Density Function Estimation, IEEE Transactions on Image Processing, Vol. 22, No.10, pp. 3791-3806.
Lucas, R., A. John, F. Russell, F. Rod, A. Arnon, C. Joao, and K. Jack, 2010. An Evaluation of the ALOS PALSAR L-Band Backscatter-Above Ground Biomass Relationship Queensland,
Australia: Impacts of Surface Moisture Condition and Vegetation Structure. IEEE Journal of Selected Topics in Applied Earth Observations and Remote Sensing, 3(4): 576-593.
Qiu, F, J. Berglund, and J. R. Jensen 2004. Speckle Noise Reduction in SAR Imagery Using a Local Adaptive Median Filter, GIScience and Remote Sensing, Vol. 41, pp.244-266.