MONITORING TREE POPULATION DYNAMICS IN ARID ZONE THROUGH
MULTIPLE TEMPORAL SCALES: INTEGRATION OF SPATIAL ANALYSIS, CHANGE
DETECTION AND FIELD LONG TERM MONITORING
S. Isaacson a, S. Rachmilevitchb, J. E. Ephrath b, S. Maman a , D. G. Blumberg a
a Geography and Environmental development, Ben-Gurion University of the Negev, Beer Sheva, Israel - [email protected] b French Associates Institute for Agriculture and Biotechnology of Drylands. Jacob Blaustein
Institutes for Desert Research, Ben-Gurion University of the Negev, Sede Boker, Israel
Commission VII, WG VII/5
KEY WORDS: Spatial analysis, Change detection, Long-term monitoring, Arid, Acacia trees, Remote sensing
ABSTRACT:
High mortality rates and lack of recruitment in the acacia populations throughout the Negev Desert and the Arava rift valley of Israel have been reported in previous studies. However, it is difficult to determine whether these reports can be evidence to a significant decline trend of the trees populations. This is because of the slow dynamic processes of acaia tree populations and the lack of long term continuous monitoring data. We suggest a new data analysis technique that expands the time scope of the field long term monitoring of trees in arid environments. This will enables us to improve our understanding of the spatial and temporal changes of these populations.
We implemented two different approaches in order to expand the time scope of the acacia population field survey: (1) individual based tree change detection using Corona satellite images and (2) spatial analysis of trees population, converting spatial data into temporal data. The next step was to integrate the results of the two analysis techniques (change detection and spatial analysis) with field monitoring. This technique can be implemented to other tree populations in arid environments to help assess the vegetation conditions and dynamics of those ecosystems.
1. INTRODUCTION
1.1 Background and motivation
Hyper-arid zones are characterized by highly sparse vegetation cover. Monitoring vegetation dynamics in hyper-arid zones is important, because any reduction in vegetation cover in these areas can lead to a considerable reduction in the carrying capacity of the ecological system (Saltz et al., 1999). In these environments, access is limited and long-term ground data are rarely available. Remote sensing expands the spatial and temporal database available and therefore is a powerful tool for long-term monitoring in arid zones (Tueller, 1987). However, processes regarding population dynamics such as trees growth and disappearance of dead trees are extremely slow (Shmida et al., 1986), making it hard to monitor population dynamic using classical change detection techniques. We suggest a new data analysis technique that expands the time scope of the field long term monitoring of trees in arid environments and enable us to improve our understanding of the spatial and temporal changes of these populations.
1.2 Objectives
The main goal of this paper is to study the potential of remote sensing and spatial analysis tools in detecting and monitoring drought stress in trees in hyper arid zones for long term ecological monitoring purposes.
2. METHODS AND RESULTS
2.1 Research area and Remote sensing data
The study area is located in the Southern Arava Valley, Israel, where rain events are rare and flash floods may occur once every few years as is typical in arid zones. The mean accumulated annual rainfall for this area is 30 mm, but varies significantly both in time and space (Goldreich and Karni, 2001). Since 1995 a clear decrease in the accumulated annual precipitation in this area was recorded (Ginat et al., 2011). This decline results in a decrease of flash floods to almost none and consequently leads to a reduction of soil water available to perennial plants found along the wadis (ephemeral rivers). This sequence of dry years in Ktora wadi was broken with a vast flood event on January 2010.
An aerial photograph taken on March 2010 (which was after the flood event of January 2010), was acquired for this project. The image includes three bands; green, red, near infra-red. The spatial resolution is 0.1 m. The flood impact on the acacia trees was already detectable by that time.
The International Archives of the Photogrammetry, Remote Sensing and Spatial Information Sciences, Volume XLI-B7, 2016 XXIII ISPRS Congress, 12–19 July 2016, Prague, Czech Republic
This contribution has been peer-reviewed.
Figure 1. Study area. Left:The drain basin of Ktora wadi in southern Israel marked in dark blue. Right: The aerial photograph of the study area. Flow direction is from north-west
to south-east.
2.2 Field long term monitoring
Since the year 2000, a continuous and ongoing yearly based survey of three species of acacia populations in seven different sites is conducted in the southern Arava (established by Dr. Benny Shalmon, ecologist of the Israel nature and parks authority). The seven plots represent different ecosystems and hydrological regimes. At each site, a minimum of 30 trees were marked with numbered metal tags and their location was taken using a GPS for future identification and revisits. The individual based monitoring data includes 16 successive years of measurements of tree's dimensions (trunk circumference, maximal canopy diameter and tree's height) and a qualitative distribution pattern of the trees size and foliage health status as recorded by vegetation indices such as normalized difference vegetation index (NDVI). Comparison of the tree sizes and NDVI values distribution enabled us to differentiate between the long- (decades) and the short-term (months to few years) processes that brought the population to its present state.
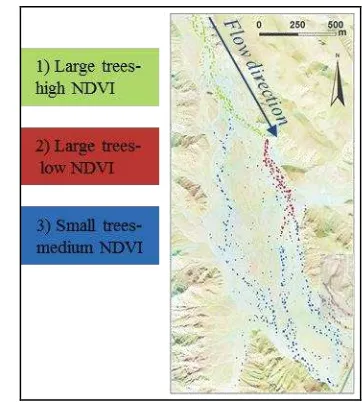
The spatial analysis revealed that tree size and NDVI distribution patterns were significantly clustered, suggesting that the processes responsible for tree size and tree health status (i.e., flash-floods spatial spreading) have a spatial expression. Furthermore, each of the attributes has a different distribution and unique clustering location. The distribution of the trees along the Wadi was divided into three distinct parts: large trees with high NDVI values, large trees with low NDVI values and small trees with medium NDVI values. Using these results, we divided the Wadi into three sections, each represent a unique combination of long and short-term geo-hydrologic processes affecting the acacia trees.
Figure 2. Grouping analysis of the acacia trees to three spatial related groups based on NDVI value and tree size.
2.4 Change detection
A corona image from 1968 and the above described CIR image were used for individual based change detection. About 85% of the trees detected at 2010, were already at a detectable size in the 1968 Corona image (hereinafter "old trees"). The rest 15% trees that is visible in the 2010 image, were either too small or germinate after 1968 (hereinafter "new trees").
2.5 Spatial analysis and change detection integration
The change detection results were examined in light of the three wadi sections defined by the spatial analysis. The proportion number of trees for each of the sections of the new trees was compared to this proportion of the old trees (Table 3). While the section of large trees with high NDVI values remained with approximately the same proportion from the entire wadi for both old (28%) and new (26%) trees, there was a significant change in the other two sections. The section characterized by large trees with low NDVI values had less new trees proportion (12%) compared with the old trees proportion (23%) of this section from the entire wadi. Correspondingly, the section of small trees with medium NDVI values, had larger new trees proportion (62%) compared with the old trees proportion (49%) of this section (Figure 4).
Table 3. Summary table of change detection and spatial analysis integration results.
The International Archives of the Photogrammetry, Remote Sensing and Spatial Information Sciences, Volume XLI-B7, 2016 XXIII ISPRS Congress, 12–19 July 2016, Prague, Czech Republic
This contribution has been peer-reviewed.
Figure 4. Outline of the spatial analysis and change detection integration technique and results.
3. CONCLUSION
In this work we have use the spatial distribution of different attributes of acacia trees as an indicator of past and present hydrological regimes within different segments of the Wadi Lack of spatial correlation between tree size and health status is as we suggest, the result of spatial-temporal changes in the water supply. Comparison of tree size distribution and NDVI values distribution revealed section in the wadi that experienced a reduction in the water availability and on the other hand, a section that was subjected to an increase in water supply in the last flash flood and possibly in last decade, in relation to the past.
The results of the change detection supported our findings of changes in the geo-hydrology regime. In the area that was subjected to a decrease of water supply, less new trees were found then would be expected if no changes in the conditions of the wadi occurred. Likewise, more new trees were found in the section that experienced improve in the water supply.
This study demonstrate the potential of remote sensing and spatial statistical analysis for identifying and explaining ecological spatial heterogeneity. The technique we suggest can be implemented to other tree populations in arid environments to help assess the vegetation condition and dynamics of those ecosystems.
4. REFERENCES
Ginat, H., Shlomi, Y., Batarseh, S., Vogel, J., 2011. Reduction in precipitation levels in the arava valley (southern israel and jordan), 1949-2009. Journal of Dead-Sea and Arava Research. 1, pp. 1–7.
Goldreich, Y., Karni, O., 2001. Climate and precipitation regime in the Arava Valley , Israel Journal of Earth Sciences. 50, pp. 53–59.
Saltz, D., Schmidt, H., Rowen, M., Karnieli, A., Ward, D., Schmidt, I., 1999. Assessing grazing impacts by remote sensing in hyper-arid environments. Journal of Range Management. 52, pp. 500–507.
Shmida, A., Evenari, M., Noy-Meir, I., 1986. Hot Desert Ecosystems: An Integrated View. Hot Deserts Arid Shrublands 12, pp. 379–387.
Tueller, P.T., 1987. Remote Sensing science application in arid environments. Remote Sensing of Environment 23, pp. 143-154.
The International Archives of the Photogrammetry, Remote Sensing and Spatial Information Sciences, Volume XLI-B7, 2016 XXIII ISPRS Congress, 12–19 July 2016, Prague, Czech Republic
This contribution has been peer-reviewed.