PRELIMINARY RESULTS OF EARTHQUAKE-INDUCED BUILDING DAMAGE
DETECTION WITH OBJECT-BASED IMAGE CLASSIFICATION
A.Sabuncua,c, Z. D. Uca Avci b, F. Sunarc
a
Bogazici University, Kandilli Observatory and Earthquake Research Institute Geodesy Department, Istanbul, Turkey ([email protected])
b
Istanbul Technical University, Department of Astronautical Engineering, Faculty of Aeronautics and Astronautics, Istanbul, Turkey ([email protected])
c
Istanbul Technical University, Geomatics Engineering Department, Istanbul, Turkey ([email protected])
Commission WG VII/4
KEY WORDS: Ercis-Van Earthquake, Object-Based Image Classification, Building Damage Detection
ABSTRACT:
Earthquakes are the most destructive natural disasters, which result in massive loss of life, infrastructure damages and financial losses. Earthquake-induced building damage detection is a very important step after earthquakes since earthquake-induced building damage is one of the most critical threats to cities and countries in terms of the area of damage, rate of collapsed buildings, the damage grade near the epicenters and also building damage types for all constructions. Van-Ercis (Turkey) earthquake (Mw= 7.1) was occurred on October 23th, 2011; at 10:41 UTC (13:41 local time) centered at 38.75 N 43.36 E that places the epicenter about 30 kilometers northern part of the city of Van. It is recorded that, 604 people died and approximately 4000 buildings collapsed or seriously damaged by the earthquake.
In this study, high-resolution satellite images of Van-Ercis, acquired by Quickbird-2 (© Digital Globe Inc.) after the earthquake, were used to detect the debris areas using an object-based image classification. Two different land surfaces, having homogeneous and heterogeneous land covers, were selected as case study areas. As a first step of the object-based image processing, segmentation was applied with a convenient scale parameter and homogeneity criterion parameters. As a next step, condition based classification was used. In the final step of this preliminary study, outputs were compared with streetview/ortophotos for the verification and evaluation of the classification accuracy.
1. INTRODUCTION
Earthquakes are the most destructive natural hazards, which result in massive loss of life, infrastructure damages, extensive destruction of the built environment and great financial losses. According to the statistics about the earthquakes, more than a million earthquakes take place around the worldwide that is equal to two earthquakes per minute. Natural disasters have brought about 780.000 deaths approximately % 60 of all mortality is due to the earthquakes between 2001-2011 (Bartels & Van Rooyen, 2011).
Remote sensing technology has been used for natural disaster research at the beginning of 70’s with the first appearance of satellite images. First studies were based on the structural geological and geomorphological research. With the recent advances in remote sensing applications, various satellite types and image data processing methods, scientists are able to monitor and understand the causes and damages of natural disasters. With the advent of very high-resolution (VHR) satellites, early post-earthquake damage assessments are being increasingly used due to ease of the interpretation of damage status of each building block or even each individual building. On the other hand, the higher internal
variability and noise within each land-cover class in the VHR satellite data, such as QuickBird-2 data, are seen as one of the main drawbacks. To overcome this problem, the object-based algorithms are being used rather than the pixel-based algorithms, although it is very difficult to find an optimal parameter set to reconstruct the objects/object sizes.
The purpose of this study is to see how well remote sensing technologies perform in detecting buildings, which have suffered after earthquake by using VHR satellite imagery. In the processing, an object-based image classification is used to detect the collapsed buildings.
2. STUDY AREA & DATA SETS 2.1 Van-Ercis Earthquake
The Van-Ercis earthquake occurred on 23 October 2011 at 13:41 local time (10:41 GMT) in the eastern part of Turkey along the city of Van with Mw=7.1 (Figure 1). The epicentre coordinates of the earthquake at 38.75N-43.36E near the Tabanlı village where is northern part of Van city centre (Kalafat, et.al., 2014). It is recorded that 604 people died and approximately 4000 buildings
The International Archives of the Photogrammetry, Remote Sensing and Spatial Information Sciences, Volume XLI-B7, 2016 XXIII ISPRS Congress, 12–19 July 2016, Prague, Czech Republic
This contribution has been peer-reviewed.
collapsed or seriously damaged by this earthquake (Utkuncu, 2013). A majority of the causalities and building damages took place in the Ercis town, which is located approximately 60 km at the northern part of the Van city centre.
Figure 1: The map of the study area (Van city centre) with the streetview data taken after the earthquake.
2.2 Data sets
In this study, different types of data sets are used. These data sets are: VHR satellite imagery (QuickBird-2), ortophotos and streetview data (Table 1). QuickBird-2 is a very popular high-resolution commercial satellite with 0.6 m panchromatic and 2.4 m multispectral mode spatial resolution. The average revisit time is 1-3,5 days. The acquisition date of the image is 14 November 2011, i.e., 21 days after the earthquake having many collapsed or heavy damaged buildings, which are still existed.
Besides VHR satellite image data, the auxiliary data such as; ortophotos and streetview images are used in the verification phase to evaluate the damage degree of the buildings. After fifteen days later the main shock, streetview data are obtained by Earthmine Inc. and the day after the earthquake, the ortophotos of the disaster areas are produced by the General Command of Mapping (GCM), the national mapping agency of Turkey (Kayı et.al., 2014).
Data type Acquisition date Resolution QuickBird-2 14 November 2011 0.6 m P
/2.4 m MS Ortophoto 24 October 2011 0.45m Streetview 9 November 2011 32 megapixel
Table 1: Specifications of the different types of data used in this study.
3. METHODOLOGY
Automatic detection and extraction of the objects from the aerial photos and/or satellite imageries have been significant research topic in the field of geomatics engineering for many years. With the advent of VHR
multispectral imagery in the last two decades and rapid computer programming, traditional pixel-based image processing is questionable due to higher internal variability and noise within each land-cover class. Object Based Image Analysis (OBIA) dates back to the 1970s however it was not used due to the limitation in the satellite spatial resolution and computation approaches (Platt & Rapoza, 2008). As an alternative to pixel-based image analysis, the object-based image processing method, which takes not only the spectral information but also the shape, contextual and semantic information is being used although it has also some limitations.
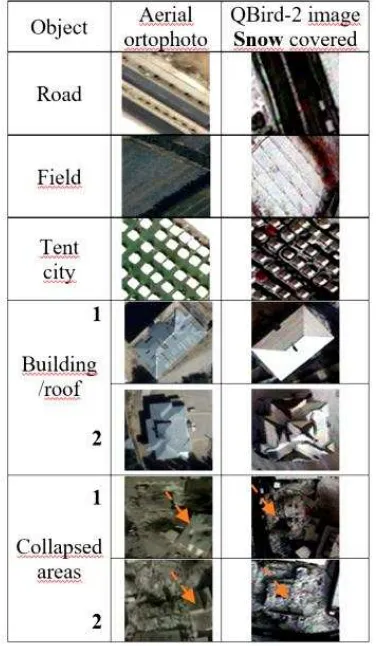
As a first step, two different land surfaces, having homogeneous and heterogeneous land covers, are selected as case study areas in the analysis. One of the main drawbacks is the seasonal effects; i.e. being covered with snow; and this has affected the success of the object detection in the image (Figure 2).
Figure 2: Seasonal effects in the land cover/use classes in the Quickbird-2 image.
Then two major steps; segmentation and classification are applied using e-Cognition software. As a final step, the verification of the damage degree of the buildings are done using the available ancillary data.
3.1 Segmentation in OBIA
Segmentation is used to create meaningful objects from the target image(s) by dividing the images into domains based on their spectral and textural characteristics. Multi-resolution image segmentation, one of the most popular
The International Archives of the Photogrammetry, Remote Sensing and Spatial Information Sciences, Volume XLI-B7, 2016 XXIII ISPRS Congress, 12–19 July 2016, Prague, Czech Republic
This contribution has been peer-reviewed.
image segmentation methods, is used in this study (Baatz & Schaepe, 2000). The quality of segmentation directly affects the object based classification results. Hence, in the segmentation step, some criteria such as scale, colour shape, smoothness and compactness need to be assigned as accurate as possible. As shown in Figure 3, the segmentation is performed by weighting of all bands equally and by using the parameters given in Table 2.
(a) (b)
Figure 3: Image segmentation in the (a) homogenous, (b) heterogeneous area.
Criteria
scale colour shape smoothness compactness
Case study area I
Homogenous 150 0.3 0.7 0.4 0.6
Case study area
II Heterogeneous 80 0.5 0.5 0.1 0.9
Table 2: Criteria used in segmentation for both case study areas.
3.2 Classification
In this study, the condition-based classification approach is applied and total 11 main classes are defined in the both case study areas. The selected classes are; agricultural land, vegetation (forest, bushes, lawn, gardens), buildings (residential and public), tent city area, collapsed buildings, debris areas, open land, playground, mixed areas, shadow and road (asphalted, main networks, turnouts, unpaved roads).
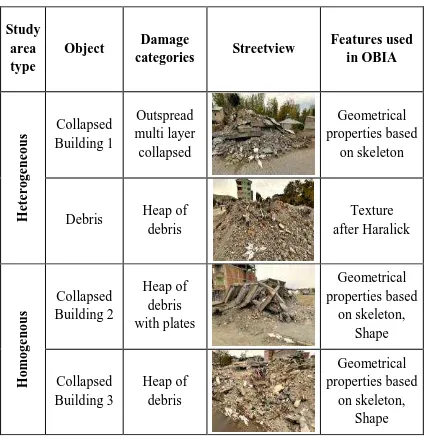
In literature, different types of collapsed buildings are categorized based on the composition of the damaged buildings after the earthquakes and damage types are shown in the damage catalogue according to its damage situation (Schweier & Markus, 2006). In this study, 3 different types of collapsed buildings and debris area are considered and related to the features used in OBIA building 1 detection, where the skeleton is structured in a main line and subordinate branches of an object. Afterwards, the evaluation is done according to the calculation of nodes that are mid-points of the triangles created by the Delaunay triangulation (Baatz et.al., 2005). For the collapsed buildings 2 and 3, shape index, which describes the smoothness of an image object border, is also used besides their geometrical properties (Table 3).
Table 3: Relationship between damage categories (Schweier & Markus, 2006) and the features used in OBIA.
The results of the land use classification for both case areas are shown in Figure 4.
Figure 4: Classification results; Case area 1 (left) and Case area 2 (right).
The collapsed buildings, debris area and tent city extracted from the streetview images for both case study areas are used in the verification of the classified images visually (Figure 5).
The International Archives of the Photogrammetry, Remote Sensing and Spatial Information Sciences, Volume XLI-B7, 2016 XXIII ISPRS Congress, 12–19 July 2016, Prague, Czech Republic
This contribution has been peer-reviewed.
4. RESULTS & DISCUSSION
In this study, the condition-based classification approach is applied using total 11 main classes in the both case study areas. As mentioned before, the seasonal effects (i.e. being covered with snow) affected the success of the classification results. Some points to note are outlined as below:
1. Ercis town consists of different variety of complex urban patterns; therefore the detection of the damaged buildings from satellite images is a complex issue. Besides, irregular sizes of buildings also affect the classification results and lead to misclassification in some parts of the study area.
2. Since the spectral characteristics of different features are similar due to being snow covered, hence, it is not sufficient to distinguish many different objects in the image. Especially, snow covered areas are seen as the main challenge in this study. Almost all building’s roofs, many open areas, agricultural lands, other vegetated areas, etc. are covered with snow. In the analysis, low spectral variation seen in different objects due to snow cover influence is overcome partly by using their textural properties. The textural properties are also used to minimize the mixing problems come across in the areas, which are darker at all, wavelengths such as shadows of the buildings, snow in the shadows, etc. However, it is observed that the textural properties are still not so adequate due to snow cover effect and are not used efficiently as much as expected.
3. Addition to the snow cover, different snowmelt rates in the building roofs (see Figure 2, Building 2 example) bring into some constraints in the object extraction in terms of spectral and textural properties. 4. Besides, due to having some areas with snow cover in the winter satellite image, some useful data products such as NDVI cannot be used to discriminate the vegetation from the other surface types in the analysis.
5. For the establishment of the relationship between damage categories and the features used in OBIA, the geometry/shape and textural properties of the objects are used to extract the collapsed building damage types (see Table 3). However, the spectral information is not used due to having similar properties observed between many collapsed buildings/debris area and roads/retained buildings.
5. CONCLUSIONS
In this study, it is aimed to see how well remote sensing technologies perform to detect the earthquake-induced buildings using an object-based image classification technique. For this purpose, different geometric and textural features in OBIA are used to detect the collapsed buildings and debris areas in the high-resolution image.
As mentioned in the application part, the object-based approach successfully detects the retained buildings but not efficiently the damaged ones. This is mainly due to having some complex features (i.e., urban patterns) in the area and also seasonal influences such as snow cover in the image.
As a final remark, since this study involve the results of the preliminary ongoing study, the additional pre-disaster information and other textural/spectral features that are not being fully tested, can lead an improved result; hence it is thought that it will be an interesting topic for future investigations.
ACKNOWLEDGEMENTS
The authors would like to thank to the Digital Globe, Inc. for providing us the QuickBird-2 data. The authors would also like to thank to the General Command of Mapping to supply the ortophotos of Van and Ercis after the earthquake and also to the Earthmine Inc. for allowing us to use streetview data of Van and Ercis.
REFERENCES
Baatz, M. and A. Schaepe, 2000. Multi-resolution segmentation. An optimization approach for high-quality multi-scale image segmentation. In: J. Strobl, T. Blaschke & G. Griesebner (eds.), Angewandte Geographische Informationsverarbeitung XII, Wichmann Verlag, Heidelberg, pp. 12-23.
Baatz M., Benz U., Dehghani S., Heynen M., Höltje A., Hofmann P., Lingenfelder I., Mimler M., Sohlbach M., Weber M., and Willhauck G., 2005. eCognition Professional: User Guide 5, Definiens-Imaging, Munich.
Bartels, S.A., and VanRooyen, M.J., 2011. Medical complications associated with earthquakes. The Lancet, 379 (9817), 748–757.
Kalafat, D., Kekovali, K., Akkoyunlu, F., and Ogutcu, Z., 2014. Source mechanism and stress analysis of 23 October 2011 Van Earthquake (Mw=7.1) and aftershocks, J. Seismology, 18, pp.371-384.
Kayı, A., Erdoğan, M., and Yılmaz, A., 2014. The role of national and international geospatial data sources in the management of natural disasters, ISPRS 2014, Volume XL-8, 2014, ISPRS Technical Commission VIII Symposium, 09 – 12 December 2014, Hyderabad, India.
Utkuncu, M., 2013. 23 October 2011 Van, Eastern Anatolia, earthquake (Mw 7.1) and seismotectonic of Lake Van area, J. Seismology, 17, pp.783-805.
Platt, R.V., and Rapoza, L., 2008. An evaluation of an object-oriented paradigm for land use/land cover classification The Professional Geographer, 60 (1) (2008), pp. 87–100.
Schweier, C., and Markus, M., 2006. Classification of collapsed buildings for fast damage and loss assessment, Bulletin of Earthquake Engineering, Vol. 4, No:2, pp:177-192.
The International Archives of the Photogrammetry, Remote Sensing and Spatial Information Sciences, Volume XLI-B7, 2016 XXIII ISPRS Congress, 12–19 July 2016, Prague, Czech Republic
This contribution has been peer-reviewed.