USER-APPROPRIATE VIEWER FOR HIGH RESOLUTION INTERACTIVE
ENGAGEMENT WITH 3D DIGITAL CULTURAL ARTEFACTS
D. Gillespie ab*, A. La Pensée a, M. Cooper a
a
Conservation Technologies, National Museums Liverpool, Conservation Centre
,
1 Peter Street
,
Liverpool, L1 6BL
[email protected]
b
Centre for Digital Entertainment, Bournemouth University, Bournemouth, Poole, Dorset, BH12 5BB
[email protected]
KEY WORDS: HCI, laser Scanning, WebGL, Scanning Heritage, Computer Graphics, Dissemination
ABSTRACT:
Three dimensional (3D) laser scanning is an important documentation technique for cultural heritage. This technology has been adopted from the engineering and aeronautical industry and is an invaluable tool for the documentation of objects within museum collections (La Pensée, 2008). The datasets created via close range laser scanning are extremely accurate and the created 3D dataset allows for a more detailed analysis in comparison to other documentation technologies such as photography. The dataset can be used for a range of different applications including: documentation; archiving; surface monitoring; replication; gallery interactives; educational sessions; conservation and visualization. However, the novel nature of a 3D dataset is presenting a rather unique challenge with respect to its sharing and dissemination. This is in part due to the need for specialised 3D software and a supported graphics card to display high resolution 3D models. This can be detrimental to one of the main goals of cultural institutions, which is to share knowledge and enable activities such as research, education and entertainment. This has limited the presentation of 3D models of cultural heritage objects to mainly either images or videos. Yet with recent developments in computer graphics, increased internet speed and emerging technologies such as Adobe’s Stage 3D (Adobe, 2013) and WebGL (Khronos, 2013), it is now possible to share a dataset directly within a webpage. This allows website visitors to interact with the 3D dataset allowing them to explore every angle of the object, gaining an insight into its shape and nature. This can be very important considering that it is difficult to offer the same level of understanding of the object through the use of traditional mediums such as photographs and videos. Yet this presents a range of problems: this is a very novel experience and very few people have engaged with 3D objects outside of 3D software packages or games.
This paper presents results of research that aims to provide a methodology for museums and cultural institutions for prototyping a 3D viewer within a webpage, thereby not only allowing institutions to promote their collections via the internet but also providing a tool for users to engage in a meaningful way with cultural heritage datasets. The design process encompasses evaluation as the central part of the design methodology; focusing on how slight changes to navigation, object engagement and aesthetic appearance can influence the user’s experience. The prototype used in this paper, was created using WebGL with the Three.Js (Three.JS, 2013) library and datasets were loaded as the OpenCTM (Geelnard, 2010) file format. The overall design is centred on creating an easy-to-learn interface allowing non-skilled users to interact with the datasets, and also providing tools allowing skilled users to discover more about the cultural heritage object. User testing was carried out, allowing users to interact with 3D datasets within the interactive viewer. The results are analysed and the insights learned are discussed in relation to an interface designed to interact with 3D content. The results will lead to the design of interfaces for interacting with 3D objects, which allow for both skilled and non skilled users to engage with 3D cultural heritage objects in a meaningful way.
1. INTRODUCTION
In recent years non-contact laser scanning has become commonly used within the cultural heritage sector, providing extremely accurate and high fidelity 3D datasets of cultural objects. It is most commonly used for the documentation of cultural objects, but the created datasets can also be used for other purposes such as replication and visualisation. Yet, the novel nature of the 3D datasets is presenting problems affecting their storage and dissemination. Due to the size of the datasets, concerns have been raised about their storage and also regarding their dissemination, especially via the internet. However, with recent improvements to internet speeds and technology, it has become a reality to embed a model directly into a webpage and share datasets via the internet. There has been an increased use of 3D content within the last couple of years (Google, 2013; Three.js, 2013, Europeana, 2012, Jung et al., 2012), and is piquing the interest of cultural heritage institutions. This is due to the fact that 3D content can
communicate the exact nature and shape of a cultural object remotely. Traditional mediums, such as images and videos, are unable to connect visitors emotionally to the original artefact to the same level as a 3D model (Schifferstein, and Zwartkruis-Pelgrim, 2008). This level of engagement is very important for cultural institutions, especially when the internet is becoming ubiquitous in their visitor’s lives (Sverdlov et al., 2012) and they wish to connect to as wide and varied an audience as possible. Moreover the way in which the world engages with information is changing - we are relying more and more on the internet to provide the information we seek (Sverdlov et al., 2012; Piazza and Bering, 2009).
However, the display of 3D content on the internet is raising many challenges around displaying high resolution models and reducing loading times, and how to create an appropriate viewer and engaging experience to a demographic that can only be identified via their operating system or their internet browser. A website visitor is able to choose which information they view
and how they interact with it (Rainie, L, 2010); it is just as important to include tools that allow them to fully engage and explore the 3D dataset. The inclusion of tools such as a changeable directional light and pan option adds another layer of depth to the exploration of the dataset while also allowing the user to create their own narrative surrounding it. They can discover details for themselves that may not have been included with the supporting information and help build upon current knowledge of the object.
This paper reports the process that Conservation Technologies has taken to create a prototype 3D interactive viewer for use within the National Museums Liverpool website. The design of the prototype revolved around the central principle of user centred design, to create a simple and easy to learn viewer. Tools were also added during the design of the viewer to deepen engagement with the 3D dataset and appeal to skilled users such as researchers and conservators
2. PREVIOUS WORK
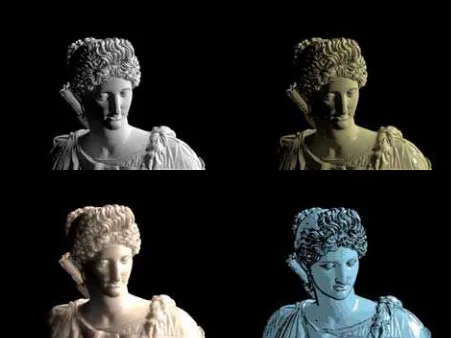
In recent years, the cultural heritage sector has begun to investigate using new and old technologies to allow visitors, researchers and conservators to explore their 3D collections in full. A popular implementation is the use of image based solutions, which takes images from different viewpoints of an object which are then ‘assembled’ to provide a ‘3D like’ interaction. This approach can offer both realistic and
unrealistic visualisations (figure 1 and figure 2) of a 3D dataset depending on what context the model will be used. This approach can also allow for multiplatform access to the content, a current problem for some technologies in current use on the internet (Khronos, 2013). These solutions are often presented in Adobe Flash, Quicktime VR and JavaScript. However, viewing of the model is restricted by the number of images that are being used in the interactive.
There are other image based approaches such as Light Fields (Levoy and Hanrahan, 1996), which allows users to choose between different viewpoints of a model, but this approach suffers from very large file sizes and is not suitable for use on the internet. A more efficient approach is the use of Surface Light Fields (Wood et al., 2000), which uses additional scanned geometry of the object alongside images. This approach allows users to interact and navigate around an object in a traditional manner but once again can be limited by large data file sizes.
A more recent approach is the use of Polynomial Texture Maps (PTM) or Reflectance Transformation Images. This provides a fixed viewpoint of the object, and allows the user to change the lighting parameters to fully understand how light interacts with the object. Mudge et al. (Mudge et al. 2010) presented a PTM viewer that combined laser scanned datasets with multiple PTM data, to allow users to explore a site and take full advantage of the PTM data. However, due to the file size of the scanned datasets and the PTM, a large amount of storage is needed for each view point.
There is however, an emerging technology for webkit browsers called WebGL, which is based on OpenGL ES 2.0 that allows 3D models to be directly embedded within a webpage (Khronos, 2013). WebGL is also becoming quite popular in its use in cultural heritage to display 3D objects (Schwartz et al 2011; Jung et al. 2012, Behr et al., 2010, Europeana, 2013).
Figure 1. Dataset of statue of Artemis (National Museums Liverpool) rendered with different shaders (clockwise from top
left - Blinn, Mental Ray stone shader, subsurface scattering shader and toon shader).
One of the popular frame works is X3DOM (Behr et al, 2010), which has been used in collaboration with various institutions such as the V & A Museum in London (3D Coform, 2013), 3D-Coform (3D 3D-Coform, 2013) and Europeana (Europeana, 2013). This framework is based on the document integration model and integrates an X3D model into a webpage. The syntax to use X3DOM is based on XML, so it is possible for
non-programmers to implement this framework, without having to learn JavaScript. As WebGL is only supported on webkit browsers, it uses Adobes Flash to allow it to work on multiple platforms (Behr, 2010). However if a model with a high resolution is used, the flash implementation can crash.
Bidirectional Texture Functions (BTF) is an approach that combines the advantages of PTM and Surface Light Fields by describing the appearance of a surface depending on both the viewing and lighting direction. Primarily this technique is used for flat surfaces, but can be used with more complex surfaces especially those seen in cultural heritage objects. A WebGL viewer has been created using this approach (Schwartz et al., 2011). The framework represents the full visual appeal of an object by interactively rendering 3D geometry, constantly improving upon surface colour and reflectance information. This is achieved via a novel progressive streaming and compression algorithm to transmit the large BTF datasets. The surface information is applied to the model over time, allowing for a smooth interaction without a large loading time for the subsequent BTF texture files.
These previous works have focused on a particular aspect of displaying a 3D dataset where they may primarily use a heavily decimated dataset or low resolution 3D model. This approach can be detrimental to the success of any dataset deployed to the internet. This paper, however, focuses on the creation of a prototype viewer through not only identifies and analyses the needs of the stakeholders but also focuses on the display of high resolution 3D datasets. The interactive viewer also provides users with appropriate tools to help them engage directly with the 3D model. The user testing for this project was split into two phases. The first phase analyzed and and attempted to understand how participants navigated both in a traditional 2D environment and in a 3D virtual environment. This was further explored with the use of low level prototyping methods,
predominantly paper prototyping; visualizing the graphical user interface for the application and the use of transitions to represent data moving within the interface.
However, as it is not possible to explore the design ideas of a 3D environment in a 2D setting (Zayas and Bustos, 2011), the second phase revolved around a computer generated prototype. This was developed on a Windows 7 machine using HTML 5 and WebGL. We conducted user testing with 8 participants (2M/6F) to evaluate the controls and usability of the viewer. Users came from a range of backgrounds including curators, conservators and non-specialists.
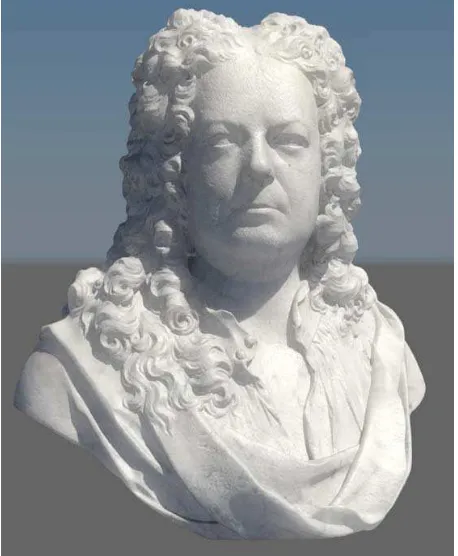
Figure 2. Rendering of a marble bust of the Architect, James Gibbs crafted by John Michael Rysbrack. This sculpture is from
the collections of the V&A Museum (museum number A.6-1988).
Participants had different levels of computer experience, ranging from having only used desktop applications to 3D software on an everyday basis. The interactive success of the application was analysed during user testing.
3. PROTOTYPING
The aim of this section was to identify usability issues at an early stage and to obtain information concerning how users navigate in a 3D virtual environment. This was conducted in two phases: a low level prototyping consisting of predominantly paper prototyping and a second stage with a generated 3D interactive viewer. These allowed for potential problems such as: usability issues, difficulties in navigation, object interaction and discovering errors to be identified early and to be resolved during additional testing.
3.1 Low Level Prototyping
The paper prototyping stage in this phase consisted of handing design authorship to the users, asking them to create an
interface they would like to interact with 3D content. In doing this it allowed the user to understand the restrictions that would be applied to the 3D prototype viewer and also allowed trends to emerge at an early stage on how people understood and categorised information. However, to limit the scope of the interface design, the participants were constrained in the use of icons and in the width and height of the space in which the interface could be implemented.
This stage allowed a suitable interface to be generated by exploring different design ideas and creating rapid prototypes. This allowed for more information to be captured during the testing, instead of asking users to write down what or how they would like to interact with 3D content. This low cost approach to user testing and prototyping also allowed participants to visualise how the interface would look and how 2D interactive scenarios (i.e. clicking an information button) could appear without programming a 3D prototype. However to fully explore the possible concepts for a 3D interactive viewer, a prototype was developed to allow users to interact with a 3D model, and detail how information may be represented within this space. The prototype was developed incrementally, first allowing for simple interactions with a 3D model, before including tools to help deepen the engagement with the model.
Figure 3. One of the paper interface designs and additional icons
3.2 Visualisation of 3D Content
The development of the interactive viewer was created in a popular framework: Three.js. Even though there are several frameworks available such as X3DOM or SpiderGL, Three.js offers versatility and features that are useful for engagement with visitors. Three.js offers the ability to write custom or implement pre-written shaders and also the ability to parse different file formats such as the Open-CTM file format: which is used in the interactive viewer. Open-CTM is a file format that can be exported directly from 3D software, or 3D model formats such as .OBJ or .PLY can be converted to Open-CTM files (Geelnard, M., 2010). The advantage of the Open-CTM format is its ability to allow for a compression ratio that makes it a fraction of the size of the original file. It is also a simple and light weight API allowing integration with WebGL. The compression technique uses a lossless reduction via a variety of differentiation operations, followed by lossless entropy encoding using the LZMA compression library (Geelnard, M., 2010). This allows highly accurate datasets of cultural objects (1 million polygons and above) to easily be rendered in a
webpage without deforming the model during the compression, reducing loading times and neither compromising the visitors bandwidth or their GPU. The framework however, is not supported on multiple platforms, it is only supported on webkit browsers (Google Chrome, Mozilla Firefox, Apples Safari) with a supported graphics card. The API used to load the .CTM file format also allows for textures to be loaded alongside the model. This can also be combined with a GLSL shader to add or vary details such as ambient colour or specular highlights. The Three.js framework also supports the use of normal maps, ambient occlusion, diffuse, specular and displacement mapping, giving the 3D content generator the ability to represent the object as they believe it should be represented.
3.3 Graphical User Interface
The central design principle for the application was to create a usable system that was simple, fun and easy to learn, focusing on user centred design (Zayas, B. 2011). The aesthetic design of the graphical user interface (GUI) and the model is also of great importance, especially for emotional experiences and product attachments (Ngo, D. 2001). The GUI in this viewer was designed to be aesthetically pleasing, communicating clearly the purpose of each control, offering natural interaction options and designed to integrate with the intended environment. Controls were denoted by icons which showed their function but a language cue was implemented next to the icon to support the information that the icon was attempting to communicate (Gentner and Nielsen, 1996).
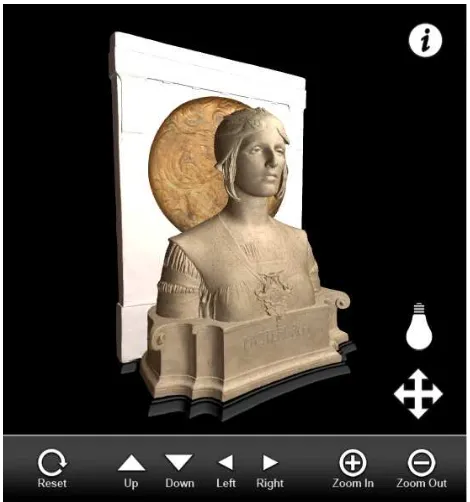
Figure 3: Mysteriarch (NML WAG 4212) within the GUI
The organization of the controls is due to the cognitive function of “chunking” (Oon-Seng, T., 2011) classifying information into a group which you associate with that data. The information, pan and lighting controls were included in the “3D” space to associate their purpose with the object. The controls included a reset, zoom functions and orientation controls that were linked independently to the orientation, lighting and panning of the object The GUI is shown in Figure 3.
4. USER TESTING
Two user testing scenarios were conducted on a Dell Precision M4600 laptop with a AMD FirePro M5950 Mobility Pro graphics card, with 8GB of RAM and standard input devices (keyboard and mouse). The success of the application was evaluated against user testing and secondary emotional responses that were elicited when using the application. Participants voluntarily participated in the user testing and came from a range of different departments within the museum. Participants had varying levels of experience of using a computer, from little or no experience to using 3D software everyday. Previous experience of interacting with 3D models was not necessary for the user testing, as the main purpose was to identify usability issues.
4.1 Scenario 1: Use of Different Interaction Styles
A small study was conducted with participants to investigate how users reacted to different interaction styles, ranging from differences in the up axis, rotation speed and engaging with a 3D model on a mobile device. Participants were observed and encouraged to verbalise their thoughts during the testing and were also asked to complete a questionnaire at the end of the testing to provide feedback on the different interaction styles.
Participants were tasked with four different scenarios to engage with a 3D model, with different interaction styles; two scenarios involved changing the Y and Z axis orientation in regards to the object; the ‘world space’ revolving around the centre of the viewer; and using a mobile device to interact with a cultural object. The participants were informed both verbally and through written instructions for each scenario. They were also informed that the aim of the testing was not to test their ability to use a computer system or engage with 3D models but to help spot any usability issues and determine their preferred interaction style. They were informed that information would be recorded during the user testing and that someone would be present with them, to note down usability issues and offer help if it was needed. Participants were given an introductory session to help get them used to the 3D viewer, before being asked to start the task.
The first two tasks involved the user being asked to navigate to certain points on the object, mimicking real world interaction with a cultural heritage object. However, as the 3D dataset allows users to interact with a cultural heritage object in new ways, these tasks were designed to understand how users preferred to navigate around an object: moving the object in relation to the user or the user moving in relation to the object. These two tasks revealed a trend that users (6 out of 8) preferred to navigate around the object, emulating real world interaction (if they moved up they would be looking down upon the object). There were some issues initially regarding navigation but this was due to a lack of experience in using 3D software, which led to some of the tasks being completed in a slow time. This was further supported in questionnaires that were completed by participants.
The third task was very similar to the first task but the navigation differed greatly. The navigation style used is commonly used in 3D software packages such as MeshLab, where the 3D “world space” revolves around the centre of the screen. It was found that users did enjoy using this approach to navigate around as it gave slightly more freedom than the first two tasks. However, when users used the pan option in
combination with this style, they became quickly disorientated and distressed. As the object had moved away from the centre of the screen, it started to revolve around the centre, which made users feel they had lost control of the navigation and that they could not reset the object to its original position.
As the first two tasks gave a wealth of information regarding interaction styles, they were performed again on a mobile device using the same participants. This was to investigate if the preferred navigation style could be used in relation to different platforms such as mobile phones or tablet computers. Participants were asked once again to navigate to certain points on the object. Analysis of the results showed that 5 out of 8 users preferred the same navigation styles as those seen on the laptop. However, there were some issues regarding gestures on the mobile device, such as when users attempted to use the zoom gesture on the device although this had not been included in the prototype.
An important trend revealed during the test was the relationship between the rotation speed of the object and the users. It is common in applications that if the rotation speed is either too sensitive or not sensitive enough that the application can be rendered unusable. In this study it was found that users would become distressed and worried for the model if the cultural heritage object was rotating too fast. This however, could be linked to their thoughts on real world objects which can be considered very fragile and vulnerable to being damaged if moved recklessly.
4.2 Scenario 2: Evaluation of Interactive Viewer
The purpose of this scenario was to evaluate the GUI and the controls, which were informed from results of the user testing. Human Computer Interaction methodologies were used for both a quantitative and qualitative approach to evaluate the prototype. The interface was evaluated by recording users’ experiences while using the interface and recording any usability issues.
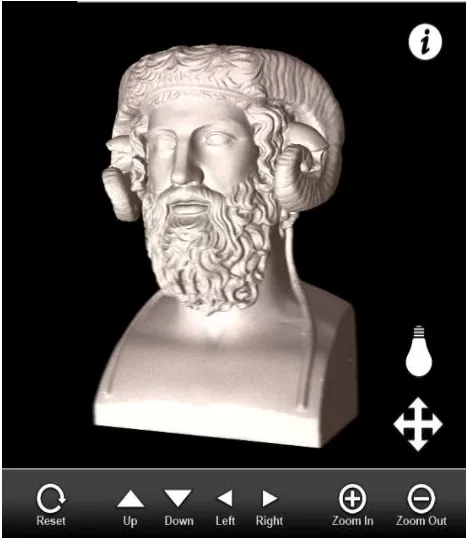
Cultural objects used within the application included the ‘Happy Buddha’ from the Stanford 3D Laser Scanning repository followed by the ‘Mysteriarch’ and ‘Zeus Ammon’ (figures 3,4) scanned by Conservation Technologies. These are accurate and sympathetic representations of the original work, fostering the same emotional attachments people have for the original piece (Schifferstein, and Zwartkruis-Pelgrim, 2008). Events that affected the performance of the user were categorized into three different categories: navigation, object interaction and perception and fidelity.
4.2.1 Results
Navigation: It was found that the frames per second (FPS) of the viewer greatly affeced how well users were able to navigate and use the viewer. The FPS of the viewer could be controlled: a high FPS gave a smooth interaction; a lower FPS left users disorientated and confused due to the lack of response. This can be highly impacting, especially for visitors who are using a computer with an old graphics card. If a visitor has a bad experience using the viewer, it could lead to fewer people using it. The GUI implemented in the viewer allowed the user to either navigate via controls or via a mouse. The functionality of the controls was clear and easy to learn. The switching between the control styles highlighted that the interface was an enjoyable experience to use. Users expressed satisfaction in
both control styles and enjoyed the ability to change different interaction styles fluidly. Feedback recorded during observation revealed that there was very little confusion over the navigation and users’ expressions were never confused or dissatisfied. Further comments from the participants in the questionnaire expressed their pleasure at using the viewer navigation controls.
Figure 4. Zeus Ammon (National Museums Liverpool) in the interactive viewer.
Object Interaction: The use of the controls implemented in the GUI allowed participants to complete the tasks quickly. A positive side effect of the controls was that they involved the users more than a simple orientation of the object to points. The controls allowed the user to see more details in the model whether it was through a combination of controlling the pan and orientation or using the lighting to see additional details. The overall experience for everyone was positive. Loading time for the model was due to the size of the model: the Happy Buddha and Zeus Ammon have roughly 1 million polygons and Mysteriarch has close to 1.7 milllion polygons. They were compressed in order : Happy Buddha: 81.6Mb (OBJ) to 3.26 MB; Mysteriarch: 343 MB (OBJ) to 8.07 MB; Zeus Ammon: 82.5 MB (OBJ) to 3.48 MB. The time taken to load each model was dependent on internet speed; the Happy Buddha and Zeus Ammon loaded in approximately 20 seconds. If the user needs to wait for a model to load, a message appears informing them that a model is loading. Participants believed that the GUI was simple and clear, provoked an emotional response of trust and clearly communicated what each of the controls did. The interface was also fun, intuitive and easy to learn, offering a natural interaction with cultural heritage objects in an unnatural environment.
5. CONCLUSION
This paper has presented a methodology for prototyping a 3D interactive viewer taking into account both user and stakeholder needs.
This workflow is based upon using low level prototyping, to identify usability issues that may occur at an early stage. This process also allows us to understand how users would like to navigate in a 3D environment and how users categorise information. The low level prototyping also allows small cultural institutions to quickly generate ideas and experiment very easily at an affordable cost. This approach can be used to tailor an interactive viewer to a specific audience, i.e. conservators, general public, researchers etc.
To directly tackle usability issues in a 3D virtual environment a 3D viewer has been developed to explore different interaction methods. Through the use of HCI evaluation methods during user testing, it was possible to identify usability issues at an early stage and help to inform the design of the final prototype. This made it possible to keep the interactive viewer very simple but still offer a deep engagement with users. This approach can also be applied to other viewers and has been applied to an image viewer to be used with another project at National Museums Liverpool. Further research is needed in order to fully investigate navigational and usability within a wider and varied audience.
6. REFERENCES
3D Coform, 2013. 3D content,
http://www.3d-coform.eu/index.php/3d-content (16 Jun. 2013).
3D Coform, 2013. 3D Data Record,
http://www.3dcoform.eu/x3domCatalogue/ (15Jun. 2013).
Adobe, 2013, “Stage3D”
http://www.adobe.com/devnet/flashplayer/stage3d.html (10 Apr. 2013).
Behr, J., Jung, Y., Keil, J., Drevensek, T., Zoellner, M., Eschler, P. & Fellner, D. 2010. A scalable architecture for the HTML5/X3D integration model X3DOM. Proceedings of the 15th International Conference on Web 3D Technology. Los Angeles, California: ACM.
Europeana, 2013 “Explore Europe’s cultural collection” http://www.europeana.eu/portal/search.html?query=3d&qf=TY PE:3D (15Jun. 2013).
Geelnard, M. 2010, “OpenCTM”
http://openctm.sourceforge.net/ (9 Apr. 2013).
Gentner, D. and J. Nielsen (1996). ‘The Anti-Mac interface’ .Communications of the ACM 39(8): 70-82.
Google, 2013 “Chrome Experiments”
http://www.chromeexperiments.com/ (15Jun. 2013)
Hess, M, Millar, F, Robson, S, MacDonald, S, Were, G, & Brown, I., 2011, 'Well connected to your digital object? E-curator: A web-based e-science platform for museum artefacts', Literary And Linguistic Computing, 26, 2, p. 193-215
Honderich, T., 1995, The Oxford Companion to Philosophy. Oxford University Press, Oxford, UK.
Jung, Y., J. Behr, and H. Graf, 2012. X3Dom As Carrier of the Virtual Heritage. ISPRS - International Archives of the Photogrammetry, Remote Sensing and Spatial Information Sciences, XXXVIII-5/W16: p. 475-482.
Khronos, 2013. “WebGL – OpenGL ES 2.0 for the Web”, http://www.khronos.org/webgl/ (11 Apr. 2013).
La Pensée, A., 2008 3D Laser Scanning in 3D Documentation and Digital Reconstruction of Cultural Heritage, JISC 3D Visualisation in the Arts Network - 3DVisA Bulletin Issue 4
Levoy, M, & Hanrahan, P 1996, ‘Light field Rendering, Proceedings Of The 23Rd Annual Conference: Computer Graphics & Interactive Techniques, p. 31
Mudge, M., Schroer, C., Earl, G., Martinez, K, Pagi, H., Toler-Franklin, C., Rusinkiewicz, S., Palma, G., Wachowiak, M., Ashey, M., Mathews, N, Noble, T. and Dellepian, M. (2010) Principles and practices of robust, photography-based digital imaging techniques for museums. In, 11th VAST International Symposium on Virtual Reality, Archaeology and Cultural Heritage,
Ngo, D., Byrne, J., 2001. Application of an aesthetic evaluation model to data entry screen. Computers in Human Behaviour 17, 149–185.
Oon-Seng, T 2011, Problem-based Learning Approach to Human Computer Interaction, World Academy Of Science, Engineering & Technology, pp. 462-465
Piazza, J. and J.M. Bering, 2009 Evolutionary cyber-psychology: Applying an evolutionary framework to Internet behavior. Computers in Human Behavior, 25: p. 1258-1269.
Rainie, L 2011. How Users of social media have changed the ecology of information, Vala Libraries 2010 Conference, Melbourne, Australia.
Schifferstein, H, and Zwartkruis-Pelgrim, E.., 2008 Consumer-Product Attachment: Measurement and Design Implications, International Journal Of Design, 2, 3, pp. 1-13,
Schwartz, C., Ruiters, R., Weinmann, M. and Klein, R. 2011. WebGL-based Streaming and Presentation Framework for Bidirectional Texture Functions. 2312.
Sverdlov, G., Reitsma, R., and Jaddou, S. 2012 Understanding the changing needs of US Online Consumers 2012. North American Consumer Technographics
Three.JS, 2013 “Three.JS 3D JavaScript 3D Library”, https://github.com/mrdoob/three.js/ (10 Apr. 2013).
Wood, D. N., Azuma, D. I, Aldinger, K., Curless B., Duchamp, T., Salesin, D. H. and Stuetzle, W., 2000. Surface Light Fields for 3D Photography. Proceedings of the 27th annual conference on Computer graphics and interactive techniques. ACM Press/Addison-Wesley Publishing Co.
Zayas, B., Bustos, J. V. (2011), “Designing a 3D Desktop Virtual Environment for Teaching,” Proceedings of the 2011 International Conference on Computers and Computing, Bangkok, pp.125-130.