DETECTION OF DRY INTRUSION ON WATER VAPOR IMAGES OVER CENTRAL
EUROPE – JUNE 2010 TO SEPTEMBER 2011
J. Novotny a, K. Dejmal a, F. Hudec a , P. Kolar a
a
Department of Military Geography and Meteorology, University of Defence, Kounicova 65, Brno, The Czech Republic - (josef.novotny, karel.dejmal, frantisek.hudec, petr.kolar2)@unob.cz
Commission VIII, WG VIII/3
KEY WORDS: Potential Vorticity Anomaly, WV Satellite Imagery, Dry Intrusion, Tropopause, Severe Convection, ISIS Method
ABSTRACT:
The knowledge of evaluation of the intensity of cyclogenesis which could be connected with the weather having a significant impact on Earth’s surface is quite useful. If, as one of the basic assumptions, the existence of connection between dry intrusions, dry bands, tropopause height and warm dark areas distribution on water vapor images (WV images) is considered, it is possible to set up a method of detecting dry intrusions on searching and tracking areas with higher brightness temperature compared with the surrounding environment. This paper covers the period between June 2010 and September 2011 over Central Europe. The ISIS method (Instrument de Suivi dans I’Imagerie satellitaire), originally developed for detection of cold cloud tops, was used as an initial ideological point. Subsequently, this method was modified by Michel and Bouttier for usage on WV images. Some of the applied criteria and parameters were chosen with reference to the results published by Michel and Bouttier as well as by Novotny. The procedure can be divided into two steps: detection of warm areas and their tracking. Cases of detection of areas not evidently connected with dry intrusions can be solved by filtering off based on the connection between detected warm areas to the cyclonic side of jet streams and significant lowering of the tropopause.
1. INTRODUCTION
Knowledge of potential vorticity distribution is quite a useful tool for cyclogenesis processes study. Although favorable conditions for convection development are mostly subjected to processes of large scale, the smaller surface formations and effects tending to be the initiating mechanism are usually insufficiently recorded by the model and thus also formable. A convection which is the result of dynamic processes at upper troposphere layers, whether on a synoptic or a mesosynoptic scale, is reflected in a higher degree of its organization and consequently in a better predictability (Hoskins, 1997), (Santurette & Georgiev, 2005).
Formations of such phenomena tend to be well-distinguishable on WV images or satellite image composites containing WV channels. Such places manifested by tropopause lowering and areas of dry or descending stratospheric air appear as small dark patches, points or belts on VW images or reddish areas on RGB composite called Airmass (Eumetcal, 2016), (Eumetrain, 2016). These features are important factors in the development of dynamically induced convection. In these places the stratospheric air with low θw (wet bulb potential temperature) moving over the low-laid layer of warm air with high θw generates an area of potential instability at middle levels (Fritz & Laszlo, 1993), (Mansfield, 1996).
If, as one of the basic assumptions, the existence of connection between potential vorticity structure, dry intrusions, dry bands, tropopause height and suitable warm areas distribution associated with dry intrusions on so called Airmass RGB composites (Red is the WV6.2 - WV7.3 brightness temperature difference, Green is the IR9.7 - IR10.8 brightness temperature difference, Blue is the WV6.2 channel) is considered, it is possible to set up a method of detecting dry intrusions on
searching areas with higher brightness temperature compared to surrounding environment and some additional criteria.
2. DETECTION AND TRACKING OF DRY INTRUSIONS
2.1 Used Data
Satellite images taken by Meteosat Second Generation in the spectral channels 5 (6.2 µm), 6 (7.3 µm), 8 (9.7 µm) and 9 (10.8 µm) combined to RGB composites as mentioned were used as a basic source of processed data. The temporal resolution of the sequence was 60 minutes, spatial resolution 3 x 3 km at nadir (approximately 4 x 6 km in the Central Europe). Images were stored in Latitude/ Longitude projection and in GRIB format.
Investigated period covered the time from 1st June 2010 00:00 UTC till 29th
September 2011 23:00 UTC. Approximately 31 % of data could not be included in the processing due to their unsatisfactory quality or total absence.
2.2 Methodology
The ISIS method (Instrument de Suivi dans I’Imagerie satellitaire), originally developed for detection of cold cloud tops, was used as an initial ideological point. Subsequently, this method was modified by Michel and Bouttier for usage on WV images. Some of the applied criteria and parameters were chosen with reference to the results published by Michel and Bouttier (Bouttier & Michel, 2006) as well as by Novotny (Novotny, 2008).
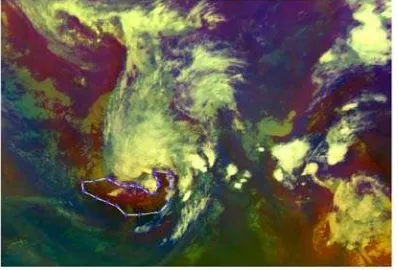
After creation of Airmass RGB composites (process described e.g. in (Eumetsat, 2016)) 72 situations were selected where areas with dry intrusions were subjectively marked off (see an example in Figure 1). Consequently, the appearance of RGB The International Archives of the Photogrammetry, Remote Sensing and Spatial Information Sciences, Volume XLI-B8, 2016
XXIII ISPRS Congress, 12–19 July 2016, Prague, Czech Republic
This contribution has been peer-reviewed.
colour combination inside subjectively outlined areas of dry intrusions occurrence was compared with the global appearance of such colour combination on the whole RGB image. Both types of matrixes of occurrence were smoothed by rotationally symmetric Gaussian lowpass filter of size 7 x 7 x 7. As a result, the probability of appearance of aforesaid colour combination in connection with the occurrence of dry intrusion was obtained.
Figure 1. RGB composite image dated 5. August 2010 18:00 UTC. An example of subjective marking off (white line) a dry
intrusion (reddish areas in the rear of cyclone)
As a first criterion the temperature limitation was used. With respect to conclusions in (Novotny, 2008) only values of brightness temperature exceeding 235.15 K were taken into consideration. In conformity with the theoretical concept of relationship of dry intrusion to cyclogenesis - e.g. described in (Browning, 1997) (Santurette & Georgiev, 2005) – another two criteria were applied. The conditions were stated as presence of dry intrusions on the cyclonal side of jet stream and presence of dry intrusions in vicinity of lowered tropopause. Aerological measuresments provided the data for localization of jet streams and analysis of tropopause height. In the case of jet stream this condition was regarded as accomplished if the velocity of upper wind in 300 hPa level surpassed 25 m.s-1 and the detected area was located in distance less than 200 pixels (px) on the left side of downwind, where the condition of minimal velocity of upper wind had been fulfilled. The size of processed pixels was 1 x 1.5 km. For the analysis of tropopause height field a biharmonic spline interpolation was utilized. Then the local minimums of height were set. In case of tropopause lowering this condition was regarded as accomplished if the detected area was also located in the distance shorter than 200 px.
2.3 Results
The highest frequency of detection of areas (more than 90 % of available dates) was registered in July 2010. The lowest frequency then falls to December 2010 which also clearly demonstrates a substantial deficit of data. An interesting fact is, that the number of detections differs significantly in the consecutive winter months December 2010 and January 2011, despite the comparable data deficit, While in December 2010 (data available only for a few days in the beginning of month) a marginal number of situations with detections was monitored (even judging within the whole data set), in the following month (January 2011) the detected cases were distinctively more numerous and the frequency of detection again neared 90 %. The number of available dates remained relatively low, not exceeding 30 %. The frequency of detection for individual months in 2010 and 2011 depending on the available data is demonstrated in Figure 2.
Figure 2. The frequency of detection for individual months in years 2010 and 2011 depending on the number of available data
(dates) – green line. The columns present the percentage of available data (dates) from the studied month that were in fact at
our disposal
Figure 3 presents an overview of all dates and situations. Apart from the dates when the areas with the occurrence of dry intrusions were detected (in green) a considerable part is attributed to such dates, when the dates were available, but no detections were recorded (blue). This is especially noticeable in March and April 2011, when data deficit was minimal. Red colour marks the dates with no or incomplete data. The impact of data deficit on our evaluation was significant in December 2010, January 2011 and July 2011, where more than a half of the dates was missing. The smallest group is represented by such cases, where the data was complete, but the dates had to be manually discarded due to an erroneous RGB composite assembly (yellow)
Figure 3. The occurrence of detected areas in individual months. Axis X – day of the month, Axis Y – month and year. Red color – not all channels are available, Yellow color – data available
but images are manually discarded due to an erroneous composite, Blue color – all data available but no area detected,
Green color – an area is detected
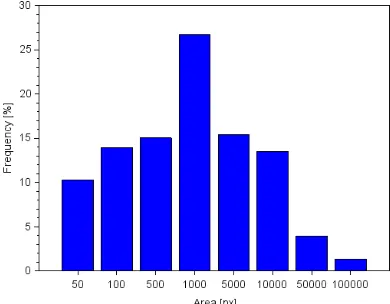
The distribution of size of detected areas is shown in Figure 4. The most frequently detected were the areas as large as 750– 3000 px. On the other hand the least recorded cases comprised The International Archives of the Photogrammetry, Remote Sensing and Spatial Information Sciences, Volume XLI-B8, 2016
XXIII ISPRS Congress, 12–19 July 2016, Prague, Czech Republic
This contribution has been peer-reviewed.
the detected surfaces greater than 30000 px. This means that the criteria of process methodology considerably reduced the scenarios of false detections forming into zonally oriented belts in the southern part of examined area where the atmosphere is generally warmer.
Figure 4. Distribution of size of detected areas in px. Intervals 10–75, 75–300, 300–750, 750–3000, 3000–7500, 7500–30000, 30000–750000 a 750000–3000000
Figure 5 depicts the size of the detected areas on the image by month. There is behaviour average value (Mean), median (Med), and the maximum value (Max) on the image of the month.
The largest surfaces of detected areas (sum of all detected pixels on one image) were on average registered in February, counting around 60000 px. In this month a case occurred when the total detected surface on the image reached approximately 280000 px. The smallest surface of detected areas, if we omit the month of December, when the data for the whole month lacked significantly, was registered in October. This month the total pixels and detected areas did not supersede 50000 (again leaving out December).
Figure 5. The size of detected area on images from individual months
Comparison of the success of the application of the individual criteria and their combination in detecting dry intrusion is shown in Table 1. That compares the detection rate of areas of dry intrusions by using suggested criteria with 72 selected situations where dry intrusions were manually (subjectively) marked off. The criterion BT means that in the case of
limitation to the criterion brightness temperature 235.15 K and the condition that the given combination of colours from the RGB composite image occurs with greater than 70% probability within highlighted intrusions. Table 1 shows the number of true detection of areas of dry intrusions through application of this criterion BT on subjectively selected and marked off dry intrusions (NOK) and the number of false detections FD is approximately the same. By adding another condition of nearby lower tropopause (BT + Tropo), the portion of true detection increased to 67 %. In case of addition of the criterion regarding the cyclonic side of jet stream (BT + Jet), the proportion of true detection is about 70 %. And if all the criteria were applied simultaneously (BT + Tropo + Jet), the proportion of true detection rises to 75 %. It means that the application of all criteria significantly reduced the proportion of false detections.
Criterion DMDI AD FMDI NADA
NFD
FADA
NOK % %
BT 52 55 107 38 8934 42
BT+Tropo 16 32 48 17 2418 12
BT+Jet 22 53 75 26 5916 28
BT+Tropo
+ Jet 13 40 53 19 3756 18
Σ 103 180 283 100 21024 100
Table 1. Summary of successful detection of dry intrusions based on selected criteria. BT - Criterion of local maxima in the
field of brightness temperature, Tropo - Criterion of local minimum in height of tropopause, Jet - Criterion of left side of
jet stream, DMDI - Detection within manually determined intrusions, AD - Any detection, FMDI - Frequency of manually
determined intrusions, NADA - The number of all detected areas, FADA - Relative frequency of all detected areas
The geographic distribution of incurrence rate of detected areas recognized through a combination of criteria BT+Tropo+Jet is presented in Figure 6. Apparently, the highest number of detected areas was recorded in western Mediterranean, above the Ligurian and Tyrrhenian Sea. The works (Tyrlis & Lelieveld, 2013) or (Raveh-Rubin & Wernli, 2015) manifest that dry intrusions in this region occur and play an important role during the episodes with remarkable weather.
Figure 6. The frequency of occurrence position of detected areas of a combination of criteria BT + Tropo + Jet (see text)
More frequent cases of detection were also registered over the Central Europe. That complies with the assumption, since most The International Archives of the Photogrammetry, Remote Sensing and Spatial Information Sciences, Volume XLI-B8, 2016
XXIII ISPRS Congress, 12–19 July 2016, Prague, Czech Republic
This contribution has been peer-reviewed.
cyclones and associated frontal systems pass the European continent in prevailing zonal airflow from west. The geographic distribution of incurrence rate of detected areas based on the other criteria combinations (Figures non present) did not bring results that would meet the expectations.
3. CONCLUSION
The work aimed to ameliorate the detection of dry intrusions in Europe on the – if possible – continuous series of data (not only selected suitable situations), while using data ordinarily accessible in routine operation (that is information coming out of observations and measuring, not model data).
In comparison with the results published earlier (Novotny, 2008), the combination of criteria integrating conditions of local maximum of brightness temperature, cyclonal side of jet stream and proximity of lowered tropopause, led to an improvement of reliability of detection. This was evidenced especially by a substantial reduction in the number of false detections, a consequence of generally warmer atmosphere in southern parts of Europe. The geographic distribution of detected areas obtained through this combination best responds to the expectations. The utilization of RGB composites, that facilitate the distinction of dry stratospheric air in dry intrusions from other areas merely characterized by low water vapour content, contributed to an improvement.
However, the significant number of cases of missing data included in the examined data series represents a non-negligible deficit. Another weak point can be attributed to the usage of data from aerological measurements in order to ascertain the position of jet stream and tropopause height, as the density of such measurement network is not very high.
A comparison of distribution of detected areas with model fields of distribution of potential vorticity in the level matching the height of dynamic tropopause should take place in the following step. The comparison of detected areas with the weather progress in the ground level focusing on extreme weather events will be very interesting as well.
REFERENCES
Bouttier, F., & Michel, Y. (2006). Automated tracking of dry intrusions on satellite water vapour imagery and model output.
Q.J.R.Meteorolog. Society, 132, pp. 2257-2276.
Browning, K. A. (1997). The dry intrusion perspective of extra tropical cyclone development. Meteorological Applications, 4(4), pp. 317–324.
Eumetcal. (2016). MSG support on cyclogenesis monitoring: RGB images and high PV air mass identification. (T. Siili, Producer, & Finnish Meteorological Institute (FMI)) Retrieved March 3, 2016, from Eumetcal: http://www.eumetcal.org/re-sources/ukmeteocal/cyclomed/www/english/msg/ciclomed/msg/ msg1.htm.
Eumetrain. (2016). Meteorological Products based on WV imagery. (A. Wirth, Producer, & Zentralanstalt für Meteorologie und Geodynamik) Retrieved Februar 15, 2016, from Eumetrain: http://www.eumetrain.org/data/3/306/nav-menu.php?tab=9&page=4.0.0.
Eumetsat. (2016). Eumetsat. Retrieved January 2016, from MSG channels, Interpretation Guide: http://oiswww.eu-metsat.org/WEBOPS/msg_interpretation/msg_channels.php.
Fritz, S., & Laszlo, I. (1993). Detection of watter vapour in the stratosphere over very high clouds in the tropics. Journal of geophysical research, 98, pp. 22959 – 22967.
Hoskins, B. (1997, 12). A potencial vorticity view of synoptic development. Meteorological Applications, 4, pp. 325-334.
Mansfield, D. (1996). The use of potential vorticity as an operational forecast tool. Meteorological Applications, 3, pp. 195-210.
Novotny, J. (2008). Detection and tracking of warm areas on water vapour 6.2 um images. Advances in Military Technology, 3, pp. 25-36.
Raveh-Rubin, S., & Wernli, H. (2015). Large-scale wind and precipitation extremes in the Mediterranean: a climatological analysis for 1979-2012. Quarterly Journal Of The Royal Meteorological Society, 141(691), pp. 2404-2417.
Santurette, P., & Georgiev, C. G. (2005). Weather analysis & forecasting: Applying satellite water vapor imagery & potential vorticity analysis. London: Oxford Academic Press.
Tyrlis, E., & Lelieveld, J. (2013, November). Climatology and Dynamics of the Summer Etesian Winds over the Eastern Mediterranean. Journal Of The Atmospheric Sciences, 70(11), pp. 3374-3396.
The International Archives of the Photogrammetry, Remote Sensing and Spatial Information Sciences, Volume XLI-B8, 2016 XXIII ISPRS Congress, 12–19 July 2016, Prague, Czech Republic
This contribution has been peer-reviewed.