OFFICIAL CRIME DATA VERSUS COLLABORATIVE CRIME MAPPING AT A
BRAZILIAN CITY
P. L. Brito a, *, E. G. V. Jesus a, R. M. S. Sant’Ana b, C. Martins c, J. P. M. Delgado a, V. O. Fernandes d
a
UFBA, Federal University of Bahia. R. Aristides Novis, n.2, Federação, Salvador, Bahia, Brazil - [email protected], [email protected], [email protected]
b
Bahia State Governament. 3ª Avenida, nº 390, Plataforma IV, 1º andar, CAB, Salvador, Bahia, Brazil - [email protected]
c
Cada do Agrimensor. Edf. A.M Profissional, Sl 202, Rio Vermelho, Salvador, Bahia, Brazil - [email protected]
d
UFRRJ, Federal Rural University of Rio de Janeiro. Rodovia BR 465 - Km 7, Campus Universitário - Seropédica, Rio de Janeiro - [email protected]
KEY WORDS: Collaborative mapping, crime mapping, Kernel, pedestrian robbery, Salvador, map algebra
ABSTRACT:
In July of 2013 a group of undergraduate students from the Federal University of Bahia, Brazil, published a collaborative web map called “Where I Was Robbed”. Their initial efforts in publicizing their web map were restricted to announce it at a local radio as a tool of social interest. In two months the map had almost 10.000 reports, 155 reports per day and people from more the 350 cities had already reported a crime. The present study consists in an investigation about this collaborative web map spatial correlation to official robbery data registered at the Secretary of Public Safety database, for the city of Salvador, Bahia. Kernel density estimator combined with map algebra was used to the investigation. Spatial correlations with official robbery data for the city of Salvador were not found initially, but after standardizing collaborative data and mining official registers, both data pointed at very similar areas as the main hot spots for pedestrian robbery. Both areas are located at two of the most economical active areas of the city, although web map crimes reports were more concentrated in an area with higher income population. This results and discussions indicates that this collaborative application is been used mainly by mid class and upper class parcel of the city population, but can still provide significant information on public safety priority areas. Therefore, extended divulgation, on local papers, radio and TV, of the collaborative crime map application and partnership with official agencies are strongly recommended.
* Corresponding author. This is useful to know for communication with the appropriate person in cases with more than one author. 1. INTRODUCTION
The Brazil is today one of the countries that is prominent in the world stage for its contradictions. At the same time that presents one of the major emerging economies of the globe is also part of the Group of countries with the highest crime rates. In 2010 the rate of homicides were more than 20 homicides per 100 000 inhabitants (ninth position among the 100 countries analyzed and eighth worst brand in the international context, with statistics considered relatively confident about the subject), United Nations-UN (WAISELFISZ, 2013) considers the rate of 10 homicides bearable. However the situation of the State of Bahia is even worse than the national average, reaching in 2010 the rate of 34 murders per 100,000 inhabitants, being the rate at the State capital, the city of Salvador, approximately 60 murders, being the fourth among the capitals of Brazil and especially in 20th position in the ranking between the towns with over 20,000 inhabitants. In the case of insults such as theft or burglary, it is estimated that these occur in a number of approximately 6 times more than the number of homicides (SSP, 2013). Thus, public security sets in the main concerns of the Brazilian population it takes the second place (33%), followed by the drugs issues (31%), it is only behind the health (52%). (IBOPE, 2011).
It is also added to these statistics the concern with the underestimated crimes, those lower importance crimes in particular (like theft), since majority cities registration report process in official organs is not simplified, the population disbelieve the benefits of such report. The victims’ tendency to notify the crime may vary with number of factors and circumstances it is also related to the victims’ perceptions, to the police system, the type of the crime or to the belongings lost.
According to the national survey of Victimization, the underreporting of average annual victimization in Brazil, considering only the 12 types of crimes listed on the study, is 80.1%. The lowest rates of notification, generally speaking, are located in the Northeast (15.8%), particularly in the States of Paraíba (11%), Bahia (13.7%), Rio Grande do Norte (14.2%) and Pernambuco (14.6%). The most recurrent reason for registering the incident is the hope of repossession the lost belongings (29.3%), especially in cases of burglary and theft of motorcycles (71.4% and 68,6%, respectively) and automobiles (59.5% and 51%, respectively) (DataFolha, 2013).
Part of the disrepute of the population about the benefits of the official record of the incident takes place on the basis of little or no disclosure of criminal statistics and their consequent note of The International Archives of the Photogrammetry, Remote Sensing and Spatial Information Sciences, Volume XL-2, 2014
improvements in public safety of those sites that stand out by highest rates
Aiming to put the disposition of the population an instrument where they can register misdemeanors and monitor statistics in spatial scale of municipality under the concentration of these crimes, a group of young students developed the collaborative mapping application called "Where I've been robbed". The application has won national projection and has been used by citizen of dozens of Brazilian cities.
This article aims to investigate whether the registered crimes in the application are somehow related to crimes recorded in official organs of the State, identifying possible reasons for the low or high correlation. With these objective analysis to indicate how this application, or similar applications, can have their use increased for the benefit of improvement of public safety for citizens.
For this a study of the crimes were conducted in the city of Salvador, State of Bahia, Brazil, where the application was created and first disclosed and used. Official data of the Ministry of Public Security-SSP of Bahia State, were used and compared with the data provided by the managers of the site Where I have been robbed. The study contemplated that the spatial correlation analysis were also included between occurrences and the concentration of the population according to income and demographics
Thus, this work required on responding mainly to the questions that follows. What are the areas with greatest instances of theft according to the SSP? What are the areas with greatest instances of theft according to the website where I’ve been robbed? Are these areas correspond? In there a link between the areas with services of their corporations. Based on spatialization of occurrences it is possible to identify patterns that assist in the identification and apprehension of criminals as in identifying factors that are related to the crime that may be mitigated by resulting in the prevention of crimes.
To approximately the late 80s when the computer resources were not easily reached as today (geographic information systems software, GPS, aerial photographs scanned), most of the mapping of crimes were made with pins nailed on printed maps. This technique was very limited, as it was difficult enough, for instance, the temporal comparisons in order to analyze the migration or evolution of the crimes occurred. Today with the technological improvement, this method of marking points of incident in a map, can be done on the computer, and it is represented with a graphical icons such as pin. (Harries, 1999). May also have linked to them a number of attributes (like day, time, type of crime, victim profile, for example) that allows the spatial scan statistics analysis based on location of the crime and also on the characteristics of the same. Normally, the maps are designed only for display or as a mere theme preview. What not everyone knows is that the maps play an important role in the process of research, analysis and
decision making in preventing and fighting crime. The Public Security Bureau of Bahia, for example, this process begins with the registration of the police report (BO), after that it goes through a specialized data processing squad, and it is entered into a database and finally it is specialized in a criminal map. In this subject, too, one realizes the importance of the police report (BO). It is through the information contained on the document that leads to police or judicial authority crime news, providing them with a series of data (names of agents, victims, witnesses, evidence, instrumentalities and proceeds from crime, among others). So the police also examine critical areas of the town and develop security schemes for these areas. If the victims don't register occurrences, numbers will be much smaller than in reality and the analyses can be distorted. Many victims do not record the BO due the police stations are very far, believing that it's a very bureaucratic process or even believing that this effort will not result in anything.
The importance of mapping crime is also used to correlate with other factors. It is possible, for example to trace the perimeter of critical areas based on above-average percentages, identify the presence of schools, health centers, police stations and other urban facilities which tend to contribute to the reduction of crime. It can also correlate critical areas with population density, sanitation, lighting and also used to other spatial data as a reference, the example of satellite images and aerial photographs.
As stated by Beato (1995), "the combination of data in geographic space provides opportunity for exploration and analysis of data which there is not in geographical data. Although this information can be found in different database, both can be combined in GIS, and the locations, subjected to analysis. The possibilities offered by this type of spatial analysis are practically limitless: analysis of hot spots of crime, the direction and distance of the recovery of stolen property, identification of gang territories, calculations of rates specific to the area, construction of the area of criminality, network analysis, determination of borders, among other "(BEATO, 1995).
In this way the criminal mapping can subside actions of the public security departments, governmental actions, as well as civil society actions that are aimed at combating violence and crime.
3. COLLABORATIVE MAPPING
With the progress of internet the last twenty years there has been a great popularization of geographic information. Today there are approximately six billion sensors - human beings - on earth who collectively possess a wealth of knowledge of geographic phenomena, and about 4,6 billion users of mobile phones.
The increased storage capacity and online traffic information caused the geoportals to become a major source of geographic information and has conquered an increasing number of users. The distribution and popularization of this information has been streamlined by tools like the virtual globes and geobrowsers, such as the Google Earth, Google Maps, ArcGIS Explorer, Bing Maps and has been relying on thousands of contributors as producers of information beyond the official agencies.
Collaborative mapping is one of the terms used for the process of sharing geographic information generated by a group of users. It is usually assigned for the collaboration that takes place on a voluntary basis, which relates to the term VGI (Volunteer Geographic Information) presented by Goodchild (2007), and around a more specific theme (noise mapping, flood mapping, among other examples).
However, collaborative maps can be produced without the geographic information collaborator being fully aware of their participation (eg. most users of traffic apps like Waze do not realize that they are continuously sending their data positionto website developers). In such cases you lose one of the potentials of Geocollaboration witch is the territorial education process. The active participation of the collaborators demands an effort to understand the space in which they operates. This aspects were already applied in the 90s, with the promotion movement called PPGIS - Public Participation Geographic Information Sistems where citizens were stimulated to participate building maps at a offline GIS tool.
On the other hand, passive collaboration allows the acquisition of a much larger volume of data, a higher number of users, in a shorter time, simply by requiring the minimum effort from the collaborator (most of the cases this will operate by simply installing software on the mobile device and have it active). These collaborative mapping features are also known as 'crowdsourcing' or 'participatory sensing' applications, since they are capitalizing on the power of the masses (or 'crowds') and relying on citizen participation to achieve their goals" (Boulos, 2011)
There are still collaborative mappings developed without a specific theme. They are developed focusing on the creation of cadastral maps, like Wikimapia and Open Street Map applications, where the developer will design and assign qualities to features such as lots, buildings, road systems, vegetation, urban features, among others.
Collaborative maps may be used for health, safety, education, environment, transportation, management and for endless other assessments. For example they can help assisting in disaster response, identifying risk areas, environmental crimes and areas lacking security, or disseminating and promoting citizens organization, as it is shown on maps published in the Catalogue of Brazilians Collaborative Maps (Brito, 2011) the WikiMapps (Wikinova Solutions, 2014) and the Mootiro Maps (IT3S, 2014) or the ones indicated at community map developpers websites (Vertices, 2014) or with the help of the Croudsoursing.org organization website that offers a large online repository of news, articles, videos, and site information on the topic of crowdsourcing and crowdfunding (Crowdsourcing LLC, 2014).
There are a large number of initiatives for collaborative mapping crimes throughout the world, although not all of them offer citizens the possibility to visualize a map with the spatial distribution of all the crime reports of a area. Applications like CrimePush (CrimePush, 2014), JustEvidence (JustEvidence, 2014) and the Large Event Emergency Digital Information Repository (LEEDIR, 2014) provide those citizen that uses a mobile device a tool to report a crime, or a crime evidence, using text, photos, videos and coordinates (obtained strait from their smart-phones GPS receiver or having the user locating the crime on the map). They also allow users to activate an alert developed an application called CrimeView that is been used by many U.S. corporations (The Omega Group, 2014).
Citizen collaborations were incorporated at the application Map Contra el Crime (PNH, 2014) operated by the Honduran National Police and other non governmental initiatives, such as the Guatemalarian map Alertos (Pixmenta) and Uruguaian CityCop (Citycop Inc.). The CityCop application was launched in 2014, it records the occurrence and allows viewing the crimes on a map, it also directs reports, both anonymously and with identification, strait to law enforcement and disseminate them in social networks.
The first and most recognised collaborative crime map created in Brazil is called WikiCrimes. It was developed by a Brazilian university professor and released in 2008. Since then, the application has gained new tools such as measuring reliability of reports, and giving feedback to the user, providing more statistics on violence in a particular area of interest and the possibility of generating the QRcode that can be printed and pasted into a bus stop, for example, making it possible to see in loco the statistics local crimes. (TEDxSudeste, 2010).
Nowadays other initiatives of mapping crimes are found in Brazil, like the one that focus om the stare violence, like ParáCrimes (Projeto Cultural Origens, 2014); or focus on local crimes, such as USP (Yoshida, 2012), created by a student who used Google Maps to map and disclose crimes that were going on at his university. There is also the experience of mapping conflict at the urban area of Niterói and São Gonçalo (Rio de Janeiro region) (CEU, 2014) created also at a university environment, with the aim of helping the community and the police in recognition of the most dangerous places in the city and who are the violence victims.
The "Enough Fiu Fiu" Map (“Chega de Fiu Fiu” in portuguese) has been congregating denounces of women who have suffered some kind of violence or intimidation (ThinkOlga, 2014). The B.O. Collective map (Wagner et. all, 2014) allows registration of various types of crimes, and describes that their primary goal is to empower citizens with a tool which takes advantage of communication with the community in which it is inserted. Application "Onde Fui Roubado" is foccused on the record of burglaries and thefts actions and has gained a large number of contributions throughout the country.
4. COLLABORATIVE CRIME MAP "WHERE I WAS ROBBED"
In July of 2013 the group of undergraduate students from the Federal University of Bahia, Brazil, officially launched the collaborative crime map application for computers called "Where I Was Robbed" In English "Where I was robbed." Their initial efforts in publicizing their web map were restricted to announce it at the local radio as a tool of social interest. In two months the map had almost 10,000 reports, 155 reports per day and more people from the 350 cities had already Reported the crime (TEDxSudeste, 2010).
The collaborative map “Onde Fui Roubado” is powered by anonymous citizens. The map runs on a web page that directs the user first to the city of interest. The following page provides the user a map of points (coloured symbols by type of occurrence) regarding the incidents of the past 90 days, with the possibility to filter them by period or by type of crime. It also provides national statistics on the gender of the victim, time of occurrence, percentage of victims who reported the occurrence in the official newspaper, and buttons for displaying window with the rank of objects and districts with the highest number of occurrences in the county, buttons for viewing more statistics for the county and to access to the national ranking of cities with the highest number of records.
To file a complaint the user need only fill out a form that displays the questions and fill options as shown in Table 1, with address and description contemplating criminal activity and its localization.
Question Filling options 1 ) Address
Location mark point directly on map or by typing the address
2 ) Crime Information
Type of crime Select from: Theft, armed robbery, assault Collective, Lightning Kidnapping, Burglary Vehicle, Household Burglary, Commercial Burglary Retail, Banking saucy, Vehicle Theft
Date of crime Mark the date on calendar
Time Enter hours and minutes
Occurrence title Open text field
Objects robbed Select from: Wallet, Purse / backpack, Mobile, Documents, Notebook, Tablet, MP4/IPOD, Credit Card, Alarm, Bicycle, other 3 ) Additional Information
Estimated Loss (in R$ ) Select integer for scrollbar Victim sex Select between: male, female Registered a police
E- mail (optional) Open text field
Security Question Reply result of the sum of two numbers provided
Table 1. Questions and options for filling registration form
Once the occurrence is recorded, the website staff performs the validation procedure by analyzing the suspicious IP logs patterns, and verifying texts with abuse.
Website developers reported that the data has also been requested by the Secretariat of Public Security of Belo Horizonte, besides the research team that worked on this article. According to Vicente, one of the developers of the “Eu fui Roubado” website, The Police has already beginning to awaken interest in the data submitted by the citizens: "some officers and delegates from various cities informally contacted us and said they also use our data on crime statistics, because many complaints on the site do not arrive at the station" (Constancio, 2014).
Sociologist Bruno Cardoso highlights that one of the interesting aspect of this tool is the fact that it supports society and security management of cities, guiding in a illustratively way where are the higher crime rates. "For most people, the police report is just a bureaucratic thing. Applications are based on the community and create a bank of relatively neutral data and with easy access that can be used to think local security" Cites the, the Center for the Study of Citizenship, Conflict and Urban Violence (NECVU/UFRJ) (Constancio, 2014).
Although we can say that the use of websites such as the "Onde Fui Roubado" is easy and important, developers encourage the recording of occurrences in police official bulletins, because, according to the Military Police, they are the ones who guide
5. OFFICIAL CRIME MAPPING ON PUBLIC SECURITY BUREAU (SSP)
The Public Security Bureau of Bahia (SSP/BA) uses the Geotechnology as strategic management instrument in the area of security, because these techniques allow increasing the speed and accuracy in managerial decision-making.
One of the methodologies used for this technique is the Division of the State in areas of integrated public safety – AISP. The AISP's are grouped into territorial segments formed by municipalities, municipal districts or neighborhoods, considered for the definition of principles, methods and procedures in the actions of judicial police, blatant police and forensics. These areas constitute a territorial unit of implementing integrated plans of action of all the operating units of public security (civil police, military police, police and firemen technique), for preventing and combating crime, seeking to confer greater effectiveness to police activity and enabling the achievement of a more effective control focused on constant assessment of strategic indicators defined on the basis of law nº 12,371/2011. (Criminal intelligence Yearbook, 2012)
In Salvador there are 16 AISP. Each AISP is composed of one or more Territorial Police stations and one or more than one Integrated Company of military police-CIPM. Several AISP form a RISP-Integrated Public Security Regions. Bahia is divided into 8 RISP, RISP inside: 4 being North, South East and RISP, RISP RISP West, 1 in the metropolitan area: RISP RMS, and 3 in the capital: RISP, RISP RISP and Central Atlantic Baía de Todos os Santos.
The AISP have gained greater significance in 2011, when it was engrafted into Bahia the Pact Program for life. With this engraftment has been creating a new model of management by results, focusing on the achievement of targets and on the modernization of cops and their ways of working. It is through the Secretariat of Public Security which has been made permanent and continuous monitoring of homicide records by AISP, as well as the measurement of the performance of operating managers from the homicide reduction goal.
In this context, is the Statistical Management System of Civil Police-SGE/PC, where daily are centered Intentional Lethal violent Crimes information – and violent Crimes against CVLI equity – FMC, that are inserted and stored data and information officers. All of this information is processed in spreadsheets, statistical analysis and GIS software, giving rise to the production of charts, tables, maps and comparative tables, allowing the indication of the areas that presented increase or decrease of the indexes of the main offenses that make up the indicators CVLI and FMC.
In this context, is the Statistical Management System of Civil Police-SGE/PC, where daily are centered Intentional Lethal violent Crimes information – and violent Crimes against CVLI equity – FMC, that are inserted and stored data and information officers. All of this information is processed in spreadsheets, statistical analysis and GIS software, giving rise to the production of charts, tables, maps and comparative tables, allowing the indication of the areas that presented increase or decrease of the indexes of the main offenses that make up the indicators CVLI and FMC.
Data collection for the SGE is held through the police report bulletin-BO. Information are collected as the victim's name, date, time, gender, age, street address, neighborhood, AISP, geographical coordinates, authorship and motivation. It is worth mentioning that for the mapping of occurrences it is essential to the correct address. The geographical coordinates are generated from the centroid of each patio. With this are generated points for preparation of criminal spots. The very large thoroughfares that cross more than one neighborhood are divided into sections, for more accurate results.
It is through these spots that are identified "hot spots", which is done by Kernel Density. The map of Kernel is a statistical method which estimates the density of surface by smoothing and serves to identify hot areas. The intensity of the color scale plotted reports on the concentration of crime in each point of the map. (Sauret, 2012). The map presents stronger colors in areas where the density of criminal events is greater, IE, the hot areas. As the density decreases, the colors get lighter shades. so there are spots on the map that indicate areas where crime is most concentrated.
From this method is possible to analyze the movement and spatial distribution patterns of violence more detailed form. Before, the statistical analysis were the regions with the highest incidence of crimes with some level of detail. Now with georeferencing techniques, it is possible to identify concentrations of crimes committed in a single street or some other area Specifies, subsidizing it faster and accurate operational responses in areas with increased criminal activity.
6. MATERIALS AND METHODS
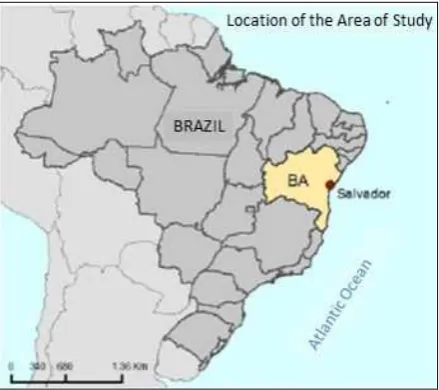
The study was conducted for the city of Salvador, capital of Bahia state, city where the application was created and first published and used. The municipality has a population estimated, in 2013, of over 2.8 million inhabitants (according to the IBGE) and has centroid located at coordinates 12.921°S - 38.444°W (Figure 1).
Figure 1. Map of the location of Salvador
Official data from the Public Security Bureau of Bahia (SSP) of the year 2012 (2013 data were not yet available) and collaborative data from the website “Onde Fui Roubado”, both for the second half of the year (July-December) was used. Population and household income data from the 2010 Census tract were obtained at IBGE (2010).
The SSP data were provided in shapefile format, with a total of 26,302 reports and attribute table consisting of the following information: date of occurrence, type of crime, address, district and coordinates of the centroid of the street. Collaborative data from the “Onde Fui Roubado” were received in a Microsoft Exel table consisting of 337 occurrences and and the following information: date and time of occurrence, address, description of fact, the victim's gender, amount of loss, BO record and type of offense and coordinates (latitude/longitude). In both databases only a selection of crimes occurred to the passerby, since this was the most frequent type of occurrences on the site “Onde Fui Roubado”, and that coincided with one of the types of crimes recorded by the SSP. Density maps using the technique of Kernel estimator was performed with the 7,886 points selected from the official source instances and with the 288 registers of the collaborative source.
The same estimator was used to visualize the distribution of population density in the municipality and of the population with low income.
In order to assess critical areas of agreement and discrepancy between the two sources, the method of map algebra was carried out. To do so, kernel values of collaborative crime concentration map where multiplied by a factor in order to match the magnitude of the values obtained with the kernel of the occurrences of crimes passer of SSP. Than, “Eu Fui Roubado” weighted kernel values were subtracted from the values obtained with the kernel estimator applied to SSP selection.
Spatial analysis and map were prepared in software Arcgis 10, on the scale of 1:150000.
7. RESULTS
The analysis of spatial concentration of occurrences (using the kernel estimator) show three areas that stands out in relation to the occurrence of crimes to passer-by in Salvador (indicated in Figures 2-6 as areas A, B and C) based on the official data and on the collaborative data.
Figure 2. Map of population density. Note: kernel estimation based on census block population density).
The area A corresponds to the traditional economic center of the city, where there is a large concentration of commercial and institutional buildings and financial headquarters, surrounded by old residential neighborhoods. The area consists of the neighborhoods: Nazaré, Barbalho, Centro, Barris, Tororó, Saúde, Macaúbas and Matatu.
The area B is known as the new economic center of the city, this area contains state's largest shopping malls and large commercial buildings, all of them considered of high standard. There is also the city’s bus station. The area encompasses the neighbourhoods: Costa Azul, Pituba, Stiep, Iguatemi, Caminho das Árvores and Jardim Armação.
Area C consists of an important commercial center for the people with lower income, the region has a large number of street stores, street vendors and offices of service providers. It consists of the districts: Calçada, Mares, Uruguai, Curuzu, Liberdade, Pero Vaz, Fazenda Grande do Retiro, Jardim Cruzeiro, Massaranduba and Bonfim.
Figure 3: Map of areas with greater concentration of households with income equal or below the minimum wage. Note: kernel density estimation based on percentage of households with this
low income within the census tract.
The maps shown in Figures 2 and 3, evidence that areas with higher population densities are also the areas with the greatest percentage of the population with incomes up to minimum wage, with an emphasis on C area and its surroundings and on area B.
The maps shown in Figures 4 and 5, helps in the identification of areas with lower concentrations of occurrences (yellow and green) and areas with higher concentrations (areas in orange and red) according to the official data and collaborative data, respectively.
Both maps show concentrations of occurrences in the main economic centers of the cities. The areas with the highest number of occurrences of crimes according to official data are indicated by the letters A and C in Figure 4, and the areas with the highest number of occurrences of crimes under the collaborative data are indicated by the letters A and B in Figure 5.
It should be noted that, according to official data (Figure 4), the area of traditional street shopping, have a much higher concentration of crimes if compared to other areas of concentration, therefore crime voncentrations at other parts of the city, such as the south (Barra and Rio Vermelho neighborhoods) middle part and northeast part (Itapoã) are Considered as a medium-low concentration area, but it also has a representative difference against Considered low areas (represented in the map with a neutral tone).
Therefore it is possible to verify that official data hotspots pretty much contains Collaborative date indications of hotspots. The International Archives of the Photogrammetry, Remote Sensing and Spatial Information Sciences, Volume XL-2, 2014
Figure 4. Map of concentration of crimes to the transient reported to official police agencies.
Figure 5. Map of concentration of crimes to the transient registered at the website “Onde Fui Roubado”.
In order to ascertain the greatest differences found between the two sources of crime data, the technique of map algebra was conducted. The resulting map (Figure 6) shows areas where SSP data indicate higher crime concentration (in red) and areas wher "Onde Fui Roubado” website indicates higher concentration (in pink).
Main differences (just as it was expected, based on visual interpretation of figures 4 and 5) were found in areas C and B. Area C, a popular commercial center, highly populated, and with low income households concentrations, was pointed as a hotspot by official data. Area B, on the other hand, a region with low population density, and fewer people earning the minimum wage or less, was pointed as the collaborative data hotspot.
Figure 6. Map of the main differences between areas of concentrated crime indicated by official data (SSP/BA) and
collaborative information (“Onde Fui Roubado”).
8. CONCLUSIONS
Hot spots found at crimes concentration map based on collaborative information are coherent with reality, when pointing to areas with a high number of pedestrians, as well as it was pointed by the map based on official data, since the type of crime studied was those that victimize the pedestrian.
Two aspects indicates that “Onde Fui Roubado” website is used by people with higher income: absence of the of crime concentration area C, and the fact of notification index (46%) is more then three times above the notification index for the state (13%).
This bias is expected because of the kind of advertisement used at that time by the developers of the website (their social network, mostly undergraduate students and higher educated professionals) and the class of public of the radio channel and of the newspapers that published materials about the collaborative map application. All these were spontaneous publicity, thus prevalence of higher income participation does not means that citizens with lower income are not interested or not have the access to this kind of tool. Further studies needs to be held in these directions.
On the other hand, literature review shows that the use of such interactive tools, between citizens and law enforcement, is an international and national trend that promotes agility and The International Archives of the Photogrammetry, Remote Sensing and Spatial Information Sciences, Volume XL-2, 2014
massive source of information as well as promotes government transparency. Therefore, extended divulgation of the crime mapping and collaborative partnership with official agencies are strongly recommended.
9. REFERENCES
SSP - Secretária de Segurança Pública. Anuário de Informações Criminais. v.2, 2012. Salvador: Secretária de Segurança Pública, 2013 Anual.
Apresentação Onde Fui Roubado – “Encontro de
Empreendedorismo” #E2 – UFBA. 2013.
http://pt.slideshare.net/OndeFuiRoubado/apresentao-onde-fui-roubado-encontro-de-empreendedorismo-e2-ufba (16 May, 2014)
B. O. Coletivo. Wagner, Lucio; Pinheiro, Paula; Maluf, Ricardo. http://www.bocoletivo.org (17 May, 2014)
BAHIA - Secretária de Segurança Pública. Estatísticas. 2013. http://www.ssp.ba.gov.br/2013-2 (25 April 2014).
Beato, Cláudio C. Indexicalidade e literalidade nas Descrições Sociais. In Dados: Revistas de Ciências Sociais, V. 38, IUPERJ. p: 309-328, 1995.
Brito, P., 2011. Catálogo de Mapas Colaborativos Brasileiros. www.catalogodemapascoletivosbr.crowdmap.com (15 May, 2014)
CEU – Informações sobre conflitos no espaço urbano. www.uff.br/sky-ineac/sg/main (14 May,2014)
Citycop Inc. 2013 http://citycop.org (14 May, 2014)
Constancio, Thaise - O Estado de S. Paulo. 2014. “Site colaborativo ajuda a mapear ocorrências criminais em todo Brasil”. http://www.estadao.com.br/noticias/cidades, site- colaborativo-ajuda-a-mapear-ocorrencias-criminais-em-todo-brasil,1153651,0.htm (13 May, 2014)
CrimePush. http://crimepush.com (14 May, 2014)
Crowdsourcing LLC. http://www.crowdsourcing.org/navigate-search?q=crime 20Reports% (15 May, 2014)
DATAFOLHA. Pesquisa Nacional de Vitimização: sumário executivo SENASP. Maio 2013.
Grupo Estado. http://www.estadao.com.br (13 May, 2014)
Harries, Keith. Mapping Crime: Principle and Practice. CMRC, 1999. https://www.ncjrs.gov/html/nij/mapping/pdf.html. Acesso em 13 Abril 2014.
IBOPE. Pesquisa CNI. Retratos da sociedade brasileira: segurança pública – outubro 2011. Brasília: CNI, 2011. 65 p. http://www4.ibope.com.br/download/111019_cni_seguranca.pd f. Acesso em 27 abril 2014.
IT3S – Instituto de Fomento à Tecnologia do Terceiro Setor. http://maps.mootiro.org/project (16 May, 2014)
JustEvidence. https://www.justevidence.org/login.php (14 May, 2014)
L. Yoshida. Assaltos USP – São Carlos. 2012. https://maps.google.com.br/maps/ms?ie=UTF8&oe=UTF8&ms a=0&msid=208052693050079787899.0004c3da7f677d6f806ce &dg=feature (14 May, 2014)
LEEDIR - Large Emergency Event Digital Information Repository. http://www.leedir.us (14 May, 2014)
Pixmenta. http://alertos.org (14 May, 2014)
Policía Nacional de Honduras.
http://www.mapacontraeldelito.hn (14 May, 2014)
Projeto Cultural Origens.
http://wikimapps.com/index.php/a/4e328a7b87300/show# (14 May, 2014)
Sauret, Gerard Viader. 2012. Estatísticas pela vida: a coleta e analises de informações criminais como instrumentos de enfrentamento da violência letal. Recife: Bagaço Desing.
TEDxSudeste. 2010. Palestra proferida em 08/05/2010 Called: Vasco Furtado - O valor da colaboração na web. https://www.youtube.com/watch?v=QAVUhyJTFMM (14 May, 2014)
The Omega Group
http://www.theomegagroup.com/police/crimeview_community_ listing.html (14 May, 2014)
Think Olga. Chega de Fiu Fiu. http://chegadefiufiu.com.br/ (16 May, 2014)
Ushahidi 2014. https://crowdmap.com (16 May, 2014)
Vertices. http://www.vertices.com/home/tag/community-mapping (15 May, 2014)
Waiselfisz, Júlio Jacobo. Mapa da Violência 2013: mortes matadas por armas de fogo. CEBELA: Flacso Brasil, 2013. http://www.mapadaviolencia.org.br/pdf2013/MapaViolencia20 13_armas.pdf (25 April, 2014).
Wikinova Solutions. http://wikimapps.com (16 May, 2014) The International Archives of the Photogrammetry, Remote Sensing and Spatial Information Sciences, Volume XL-2, 2014