INVESTIGATING PERFORMANCE OF AIRBORNE LIDAR DATA FILTERING
WITH TRIANGULAR IRREGULAR NETWORK (TIN) ALGORITHM
M. UYSALa, N. POLATa,*
aAKU,Faculty of Engineering GeomaticsDep, 03200 Afyonkarahisar, TURKEY - (muysal, npolat)@aku.edu.tr
ISPRS WG VII/7 KEY WORDS: Airborne Lidar, Filtering, TIN Algorithm, DEM.
ABSTRACT
Digital Elevation Model (DEM) is an important topographic product and essential demand for many applications. Traditional methods for creating DEM are very costly and time consuming because of land surveying. In time, Photogrammetry has become one of the major methods to generate DEM. Recently, airborne Light Detection and Ranging (LIDAR) system has become a powerful way to produce a DEM due to advantage of collecting three-dimensional information very effectively over a large area by means of precision and time.
Airborne LIDAR system collects information not only from land surface but also from every object between plane and terrain that can reflect the laser beam. So filtering out nonground points from raw point clouds is the major step of DEM generation. There are many filtering algorithm due to several factors that affect the filtering prosedures. The performanses of these filters change based on the topographic features of area.One of these algorithm is called Triangular Irregular Network (TIN).
In this study the TIN algorithm is used to filter Lidar point cloud that are collected from two different sites. While one of these sites is a rural area, the other site is an urban area; therefore these sites have different topographic features. In addition, the reference DEMs are available for these sites. In order to test the performance of TIN algorithm, the Lidar point clouds are filtered and used to generate DEM for the sites. Finally, the generated DEM are compared with the reference DEM for each site. The comparison results show that the TIN filtering algorithm perform more effectively in urban area than rural area in terms of correlations with reference DEMs
.
1. INTRODUCTION
The development of Airborne Light Detection And Ranging(LiDAR) system makes the acquisition of three-dimensional surface information more conveniently and directly. Basicly in LiDAR technology, the distance between objects on the ground and LiDAR sensor isdetecting by measuring the time of a pulse that transmitted energy takes to return to the LiDAR sensor. Compared with traditional surveying and mapping systems, including photogrammetric systems, LiDAR technology provides a fast and accurate alternative (Liu, 2008; Kukko and Hyyppä, 2009) for mapping large areas at high resolution and is gradually being adopted as the primary technique to generate Digital Elevation Models (DEMs) (Hill et al., 2000). Besides, the less limitation of weather and time of a day to enable a LiDAR measurement assignment also makes LiDAR more and more popular in obtaining 3D information (Shan and Sampath, 2005).
Since the raw data of LiDAR encodes the 3D coordinates already, the usage area covers hydrologic modeling, coastal monitoring, forest inventory (Popescu and Zhao, 2008; Zhao and Popescu, 2009; Zhao and Popescu, 2009b ), urban three-dimensional visualization (Kraus and Otepka, 2005; Alharthy and Bethel, 2002), land-cover and land-use classification, and object detection (Ma and
Meyer, 2005; Aumann et al. 1991; Cho et al., 2004; Sohn and Dowman, 2007).
DEM generation using Airborne LiDAR data can be simplified only by filtering non-ground points out from point clouds and gets the ground points. Many methods about filtering have been proposed. Some of these methods have compared by Sithole and Vosselman (2004).
In this study, the performance of Adaptive TIN Model filtering algorithm developed by Axelsson (2000) is investigated for two seperate test site.
2. STUDY AREAS
There are two study sites withdifferent topographic features. The site F21 is selected a rural region of Istanbul. In F21 site, wooded areas,secondary roads, boundaries of the fieldsand valley between smooth hills are available (Fig 1).
The International Archives of the Photogrammetry, Remote Sensing and Spatial Information Sciences, Volume XL-7, 2014 ISPRS Technical Commission VII Symposium, 29 September – 2 October 2014, Istanbul, Turkey
This contribution has been peer-reviewed.
Figure 1. Rural part of study area, site F21.
The second region called G21 is selected from inside the city of Istanbul. It contains buildings, roads, mosqiue, cars and cemetery (Fig 2).
Figure 2. Urban part of study area, site G21.
Reference DEM data are available for both F21 and G21study sites.
3. ADAPTIVE TIN MODEL FILTERING ALGORITHM
Theadaptive TIN filtering process developed by Axelsson (2000) and works by densifying a sparse TIN created from selected seed points.The algorithm has three main step: Parameter estimation, Seed point selection and Densification of TIN.
3.1 Parameter Estimation
Parameters for the TIN densification, distance to TIN facets and angels to the nodes, are derived from data. Aforest area has different characterisitcs compared with an urban area. The statistics from data for par parameter estimation is collected in the form of discrete histograms of surface normal angles and elevation differences (Axelsson, 2000).
3.2 Seed Point Selection
Seed points are selected whitin a user- defined grid, which grid size is based on the largest structure in the study area (Axelsson, 2000). For an urban area, the grid size should be determined based on largest building.
3.3 Densification of TIN
For each iteration, one point at a time in each TIN facet is added if it meets the criteria of threshold parameters. Distance to the facet planes and angles to the nodes are the main values compared (Fig 3). Threshold values are computed for each iteration. Edges are easily cut off since the threshold values exceed (Fig 4)(Axelsson, 2000).
Figure 3. Facet planes and angles to the nodes (Axelsson, 2000).
Figure 4. Edge cutting (Axelsson, 2000).
Points within the threshold value, are mirrored to the nearest node point and then new TIN facet is calculating (Fig 5). This process is made iteratively and TIN model expands after each time (Axelsson, 2000).
Figure 5. Mirroring points (Axelsson, 2000).
The iterative process stops acording to threshold values wy adding no more points to TIN model.
4. APPLICATION 4.1 F21 site
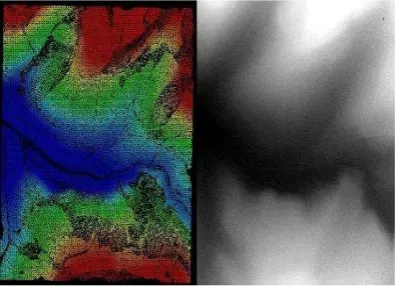
Raw Lidar data (over 9 million point) for F21 site is filtered with TIN model algorithm. The filtered LiDAR data is used to generate0.5 m resolution DEM in ENVI software (Fig 6).
Figure 6. Filtered LiDAR data and generated DEM for F21 site.
The International Archives of the Photogrammetry, Remote Sensing and Spatial Information Sciences, Volume XL-7, 2014 ISPRS Technical Commission VII Symposium, 29 September – 2 October 2014, Istanbul, Turkey
This contribution has been peer-reviewed.
The generated DEM and reference DEM for the site of F21 is compared in raster format. The correlation between these DEMs are calculated as 0.81734.
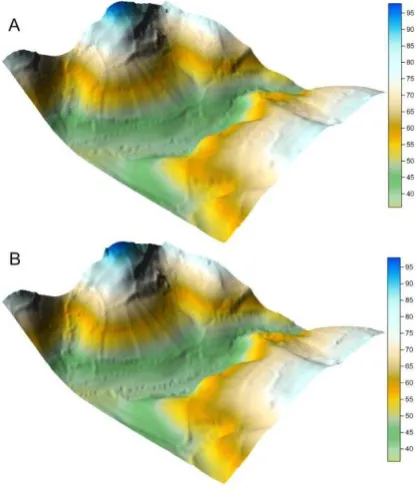
3D visualization of generated and referance DEMs allow to examine results with naked eyes (Fig 7). If the study area divided into sub-regions the differences between models can be detected more clearly.
Figure 7. 3D representing of TIN Model (A) and reference DEM (B) for F21 site.
4.2 G21 site
Raw Lidar data (over 2.7 million point) for F21 site is filtered with TIN model algorithm. The filtered LiDAR data is used to generate 0.5 m resolution DEM in ENVI software (Fig 8).
Figure 8. Filtered LiDAR data and generated DEM for G21 site.
The generated DEM and reference DEM for the site of F21 is compared in raster format. The correlation between these DEMs are calculated as 0.90638.
3D visualization of generated and referance DEMs allow to examine results with naked eyes (Fig 9). If the study area divided into sub-regions the differences between models can be detected more clearly.
Figure 9. 3D representing of TIN Model (A) and reference DEM (B) for G21 site.
5. CONCLUSION
In this study raw LiDAR data for both different F21 and G21 sites are filtered with TIN Model algorithm to generate DEM.The performance of TIN algorithm is examined by comparing generated DEM and reference DEMs. Comparison is made both statisticaly and 3D visualization. The results are promising.
The applications show that the algorithm works satisfactory (or relatively good based on purpose) in both sites. The results can differ other at users process. Because all results are depand on the estimated threshold values and all threshold values are determined by users. So with a more suitable decided parameters, the results can be more accurate.
ACKNOWLEDGEMENTS
This study was supported by AKU project numbered 13.FEN.BİL.37.
6. REFERENCES
Alharthy, A.; Bethel, J. Heuristic filtering and 3d feature extraction from lidar data. In Proceedings of PCV02, Graz, Austria, 2002.
Aumann, G.; Ebner, H.; Tang, L. Automatic derivation of skeleton lines from digitized contours. ISPRS J. Photogramm. Remote Sens. 1991, 46, 259-268.
The International Archives of the Photogrammetry, Remote Sensing and Spatial Information Sciences, Volume XL-7, 2014 ISPRS Technical Commission VII Symposium, 29 September – 2 October 2014, Istanbul, Turkey
This contribution has been peer-reviewed.
Axelsson, P., 2000. DEM generation from laser scanner data using adaptive tin models. International Archives of Photogrammetry and Remote Sensing, XXXIII, Part B3, 85-92.
Cho, W.; Jwa, Y.; Chang, H.; Lee, S. Pseudo-grid based building extraction using airborne LIDAR data. Int. Arch. Photogramm. Remote Sens. 2004, 35, 378-381.
Hill, J.M.; Graham, L.A.; Henry, R.J.; Cotter, D.M.; Ping, A.; Young, P. Wide-area topographic mapping and applications using airborne light detection and ranging (LiDAR) technology. Photogramm. Eng. Remote Sens. 2000, 66, 908-914.
Kukko, A.; Hyyppä, J. Small-footprint laser scanning simulator for system validation, error assessment, and algorithm development. Photogramm. Eng. Remote Sens. 2009, 75, 1177-1189.
Liu, X. Airborne LiDAR for DEM generation: some critical issues. Prog. Phys. Geog. 2008, 32, 31-49.
Ma, R.; Meyer, W. DTM generation and building detection from Lidar data. Photogramm. Eng. Remote Sens. 2005, 71, 847-854.
Pfeifer, N.; Stadler, P.; Briese, C. Derivation of digital terrain models in the SCOP++ environment. In Proceedings of OEEPE Workshop on Airborne Laser Scanning and Interferometric SAR for Digital Elevation Models, Stockholm, Sweden, 2001.
Popescu, S.; Zhao, K. A voxel-based lidar method for estimating crown base height for deciduous and pine Trees. Remote Sens. Environ 2008, 112, 767-781.
Shan, J. and A. Sampath, 2005. Urban DEM Generation from Raw Lidar Data: A Labeling Algorithm and its Performance. International Journal of Remote Sensing 71, pp. 217-222.
Sithole, G. and G. Vosselman, 2004. Experimental comparison of filter algorithms for bare-Earth extraction from airborne laser scanning point clouds. ISPRS Journal of Photogrammetry and Remote Sensing 59(1-2), pp. 85-101.
Kraus, K.; Otepka, J. DTM modelling and visualization—the SCOP approach. In Proceedings of Photogrammetric Week 05, Heidelberg, Germany, 2005; pp. 241-252.
Sohn, G.; Dowman, I. Data fusion of high-resolution satellite imagery and LiDAR data for automatic building extraction. ISPRS J. Photogramm. Remote Sens. 2007, 62, 43-63.
Zhao, K.; Popescu, S. Lidar-based mapping of leaf area index and its comparison with satellite GLOBCARBON LAI Products. Remote Sens. Environ. 2009, 113, 1628-1645.
Zhao, K.; Popescu, S.; Nelson, R. Lidar remote sensing of forest biomass: a scale-invariant approach using
airborne lasers. Remote Sens. Environ. 2009b, 112, 182-196.
The International Archives of the Photogrammetry, Remote Sensing and Spatial Information Sciences, Volume XL-7, 2014 ISPRS Technical Commission VII Symposium, 29 September – 2 October 2014, Istanbul, Turkey
This contribution has been peer-reviewed.