AUTOMATIC REGISTRATION OF MULTI-SOURCE MEDIUM
RESOLUTION SATELLITE DATA
L. Barazzetti a, M. Gianinetto a, M. Scaioni b
a Politecnico di Milano, Department of Architecture, Built Environment and Construction Engineering Via Ponzio 31, 20133 Milano, Italy
[luigi.barazzetti, marco.gianinetto]@polimi.it
b Tongji University, College of Surveying and Geo-Informatics, 1239 Siping Road, 200092 Shanghai, P.R. China [email protected]
Commission VII
KEY WORDS: Automation, Data Fusions, Matching, Medium-Resolution Satellite Imagery, Registration
ABSTRACT:
Multi-temporal and multi-source images gathered from satellite platforms are nowadays a fundamental source of information in several domains. One of the main challenges in the fusion of different data sets consists in the registration issue, i.e., the integration into the same framework of images collected with different spatial resolution and acquisition geometry. This paper presents a novel methodology to accomplish this task on the basis of a method that stands out from existing approaches. The whole data (time series) set is simultaneously co-registered with a two-dimensional multiple Least Squares adjustment with different geometric transformations implemented. Some tests were carried out with different geometric transformation models (including similarity, affine, and polynomial) and variable matching thresholds. They showed a sub-pixel precision after the computation of multiple adjustment. The use of multi-image corresponding points allowed the improvement of the registration accuracy and reliability of a time series made up of data imaged with different sensors.
1. INTRODUCTION
The growing interest towards Earth Observation from space has led to the availability of an impressive number of images from satellites. Consequently, multi-source data is nowadays a fundamental source of information needed in several application domains.
According to Phol and Van Genderen (1998), ‘image fusion aims at the integration of disparate and complementary data to enhance the information apparent in the images as well as to increase the reliability of the interpretation’. Wald (2002) defined data fusion as a ‘formal frame work in which are expressed means and tools for the alliance of data originating from different sources. It aims at obtaining information of greater quality; the exact definition of greater quality will depend upon application”. Hall (1992) describes data fusion as ‘a process dealing with data and information from multiple sources to achieve refined/improved information for decision making’. Starting from these definitions, it is clear that the idea behind data fusion relies on the integrated use of more data in order to obtain better information than that achievable with a single-source data set. In this context, multi-source data could be defined as multi-sensor, multispectral, multi-resolution, or multi-temporal data.
Overall, data fusion can be divided into two steps: (i) image registration and (ii) data integration (Lu and Weng, 2007). Both are complex tasks, especially in the case of data sets with different geometric resolution and spectral information (e.g., high-resolution optical images along with coarse resolution radar data).
The registration problem can be intended as the estimation of a mapping function between several images aimed at recovering the overlap. Automated image registration procedures (Le Moigne et al., 2011) are available in most commercial software
packages used in Photogrammetry and Remote Sensing. Some examples are MicroImages Auto-register, ENVI, ERDAS IMAGINE AutoSync or PCI Geomatics. Typically, these software packages use different mathematical models for matching corresponding features on specific spectral bands selected by the user. However, many other image matching techniques have been proposed in literature, such as correlation-like methods (Pratt, 1991), mutual information (Pluim et al., 2001), Fourier methods (Castro and Morandi, 1987), or relaxation methods (Price, 1985).
In the case of optical satellite data, the registration phase is generally based on similarity, affine, polynomial homographic or rational function model (Poli and Toutin, 2012). The choice of the mapping function depends on the level of pre-processing of the data: from raw information up to terrain geocoded orthophotos.
This paper deals with the problem of 2D-to-2D geometric registration with an automatic method of several medium resolution images. It should be mentioned that this step is mandatory to run the data fusion of the radiometric component, because accurate pixel-to-pixel correspondence is required for integrating together data collected from different platforms, with different viewing angles, spatial resolution, field-of-view and information content.
The use of unregistered multi-temporal data is not possible for further analysis. Image pixels with same coordinates would not represent the same object (Goshtasby, 2005; Gianinetto and Scaioni, 2008; Le Moigne et al., 2011; Gianinetto, 2012) and it is well known that even a small mis-registration in the input data may produce large errors in the final outputs (Townshend et al., 1992) or false results in change detection (Khorram et al., 2013).
The new approach for image co-registration that is described in this paper differs from other existing techniques for the The International Archives of the Photogrammetry, Remote Sensing and Spatial Information Sciences, Volume XL-7, 2014
simultaneous use of the whole data set. In fact, standard methods for image registration are based on the pairwise registration of any ‘sensed’ images to one adopted as ‘reference’ image. This is also the procedure usually implemented in commercial software packages. The principle of multi-image registration here described is analogous to photogrammetric bundle adjustment (Kraus, 2007), but with a different mapping model (Barazzetti et al., 2014b).
2. THEORETICAL BACKGROUND
2.1 Extraction of multi-image features
Although features from images can be manually extracted, in current Remote Sensing some reliable automatic image matching methods are needed. They should be able to provide accurate results, also in the case of data sets made of a large number of satellite images with both geometric and radiometric deformations.
The current implementation of the automatic extraction of multi-image correspondences is carried out with SURF operator (Bay et al., 2008). This is based on a Hessian matrix measure for the detector and the distribution of the first-order Haar wavelet responses for the descriptor. The detector/descriptor matching strategy is used to find feature and to characterize each of them by a multi-dimensional vector to be used for matching. The original SURF code (available at www.vision.ee.ethz.ch/~surf/) was adopted and integrated with a robust procedure for outlier rejection based on RANSAC (Fischler and Bolles, 1981). Particular attention was paid to the threshold for blob response of the SURF operator. The number of points used in the data processing and their distribution is strongly dependent on this parameter
Then, two strategies for comparing the descriptors are available: a quadratic matching procedure (slower but rigorous) and a kd-tree (Samet, 1990) procedure (faster but approximate). The user can select both the detector-descriptor functions and the procedure to compare the vectors and to extract corresponding features. This choice depends on the number of the images and extracted features.
Given two images i and j, in which m and n features were detected (each of them with descriptors Dm and Dn) the
quadratic matching procedure compares all descriptors of the image i with all those of the image j. Then the Euclidean distance between both descriptors is estimated as a measure of the difference. Moreover, a constraint between the first-best and the second-best candidates is added to be more distinctive. The method can be summarised as follows:
Each descriptor Dm is compared with all the descriptors
Dn by estimating the Euclidean distance dmn =||Dm–Dn||;
All the distances dmn are sorted from the shortest (dmn)1
to the largest (dmn)n;
An image correspondence is accepted if (dmn)1<t(dmn)2.
In our study, the threshold t was set to 0.75. This choice is a good compromise that ensures a sufficient distance between the first and second candidates. It provides distinctive matches and is useful for a preliminary removal of wrong correspondences. The choice of an exhaustive search in the whole set of features ensures a good robustness but is computationally expensive. The second strategy to compare the descriptors is based on a kd-tree approach, widely-used in digital-photography applications such as for automatic panorama generation from unoriented images (Brown and Lowe, 2003). The kd-tree approach can be defined as a binary search tree where every node is a
k-dimensional point. For two generic images i and j, the procedure creates a kd-tree with the descriptors (Dm) of the image j and the
descriptors (Dn) of i are compared by using the kd-tree. Then,
the test on the Euclidean distance between the first two candidates is applied. Two fast computational codes are the approximate nearest neighbour (ANN) library (Arya et al., 1998) and the fast library for approximate nearest neighbours (FLANN) (Muja and Lowe, 2009).
2.2 Mapping function
Given a set of n images from which m multi-image correspondences xij = [xij, yij] can be matched with respect to a
reference image (i is the feature index, j is the index of a generic sensed image, while the letter R refers to the reference image), the image registration is given by a set of invertible mapping functions as follows:
{ �= ℎ�( , )
�= ℎ�( , )
(1)
This means that any images have to be co-registered to the reference (or ‘master’), which also sets up the datum for the whole data set.
The extension towards a simultaneous multi-image method can be carried out by introducing the image correspondences (features) between a generic image pair h and k (h≠k≠R):
{ ℎ= ℎ ,
ℎ= ℎ , (2)
The use of such correspondences provides (n2-n)/2 image combinations for the whole data set. It should be mentioned that the additional group of Eqs. (2) are not strictly needed to write down the final system of equations to solve for the registration parameters with respect to the reference image R. Indeed, the group of Eqs. (1) already includes these additional features by assuming that the image coordinates in R have unknown values. If a feature is matched in N images (N = 2,3,…) that do not include the reference image R, two additional unknowns are introduced (the coordinates of this feature in R). On the other hand, this feature provides 2N equations.
The first multi-image mapping function proposed in this implementation was the similarity transformation (Barazzetti et al., 2013; 2014a; 2014b):
[ ℎℎ] = [
�ℎ ��ℎ −�ℎ �� �ℎ ℎ
�ℎ �� �ℎ �ℎ ��ℎ ℎ ] [ ] (3)
where shk is the scale factor, αhk is the rotation angle, chk and dhk
are translation parameters between images h and k, respectfully. However, this method can be extended to encompass other geometric models in order to find a better fitting between the images of the data set being processed. For instance, polynomial functions can be implemented. Such transformations can be expressed in compact notation as:
{ ℎ= ∑ ∑=0 −
� =0
ℎ= ∑�=0∑ =0 −
(4)
where p is the degree of the polynomial.
The unknown coefficients (ahk, bhk) become 6, 12, and 20 for the
1st, 2nd and 3rd degree polynomial functions, which are the most commonly used for image alignment.
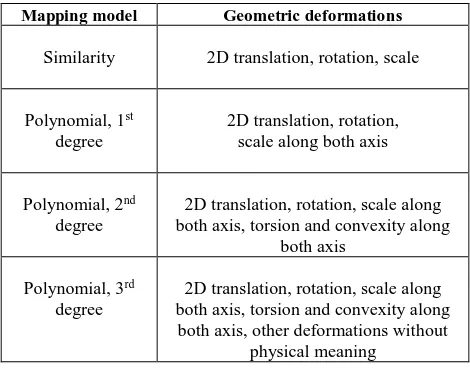
Table 1 summarizes the geometric distortions that can be taken into consideration using these transformations models.
Other examples of mapping functions can be encapsulated in the generic form:
{ ℎ= ∑�=0∑�=0 ℎ= ∑�=0∑�=0
(5)
Among them, the bilinear (p=1) was implemented in the proposed algorithm (8 parameters per each image). The case of p=2 (bi-quadratic) was also considered and is based on 18 parameters per each image.
Mapping model Geometric deformations
Similarity 2D translation, rotation, scale
Polynomial, 1st degree
2D translation, rotation, scale along both axis
Polynomial, 2nd degree
2D translation, rotation, scale along both axis, torsion and convexity along
both axis
Polynomial, 3rd degree
2D translation, rotation, scale along both axis, torsion and convexity along both axis, other deformations without
physical meaning
Table 1. Deformations modelled by different mapping functions.
3. EXPERIMENTAL SECTION
3.1 Test site and data
The chosen test site it the city of Las Vegas (Nevada, USA). The multi-source data set is made up of five satellite images collected by three different satellites/sensors: Terra/ASTER, Landsat-5/TM and EO-1/ALI.
Only the reflective bands were considered. All of them have a similar geometric resolution (from 15 m to 30 m for Terra/ASTER and 30 m for both Landsat-5/TM and EO-1/ALI), but with different signal quantization level (8 bit for Terra/ASTER and Landsat-5/TM and 12 bit for EO-1/ALI) and different spectral band configuration. Table w summarizes the adopted data set.
The study was carried out by using spectral band 1 for Terra/ASTER (0.520-0.600 µm), band 2 for EO-1/ALI (0.525-0.625 µm) and band TM2 for Landsat-5/TM (0.520-0.600 µm). No atmospheric correction was applied beforehand (Barazzetti et al., 2013; 2014a; 2014b).
ID Satellite/Sensor Date Spatial
Resolution #1 Terra/ASTER 10th November 2002 15 m #2 EO-1/ALI 23rd May 2003 30 m #3 EO-1/ALI 22nd December 2013 30 m #4 Landsat-5/TM 15th July 2006 30 m #5 Landsat-5/TM 2nd April 2009 30 m
Table 2. The multi-source data set available for the case study.
3.2 Setting the thresholds
The implemented algorithm needs some thresholds to be set for the multi-image matching procedure. One of the most important parameters is the threshold for the blob detection by the SURF operator. A low threshold leads to a large number of blobs with a large CPU time during descriptor comparison. On the contrary, high threshold could give a limited number of points with a bad distribution in the images (Valgren and Lilienthal, 2007; Mikolajczyk and Schmid, 2005; Mikolajczyk et al., 2005).
As data could contain a large percentage of gross errors, the test used to remove outliers is the robust estimation of the geometric model between pairs of images. Different robust estimators are available and are used in commercial or scientific image matching implementations (Agarwal et al., 2009; Cornelis and Van Gool, 2008; Rousseeuw and Loroy, 1987; Snavely et al., 2008a-2008b; Torr and Murray, 1993; Torr, 1995-2002; Torr and Zisserman, 1995-1998).
The proposed procedure is based on the RANSAC approach, that was coupled with a preliminary normalization of the image coordinates to overcome some issues relating to the use of pixel coordinates and images with a different spatial resolution. A preliminary normalization applied to all the images independently was implemented as follows: image coordinates (often provided in pixels with origin on the top-left corner) are translated so that their centroid is the origin and are then scaled so that the average distance from the origin is equal to √ (Hartley, 1997; Hartley and Zisserman, 2004). This reduces some numerical instability problems found with polynomial transformation of degrees 2 and 3.
The proposed normalization, along with a procedure for de-normalization after the parameters estimation, overcomes these drawbacks during Least Squares adjustement, proving its suitability also for noisy data sets.
4. RESULTS AND DISCUSSION
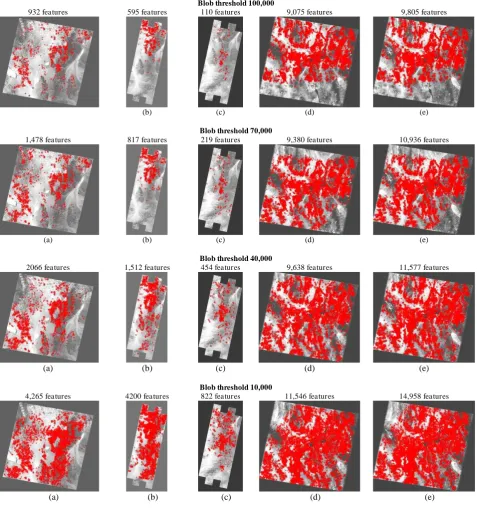
Figure 1 shows the multi-matching result for the case of the affine transformation (polynomial 1st degree). It shows only the features that have been detected in at least two images of the time series.
The initial threshold for the blob detection (100,000) was progressively reduced (70,000, 40,000, 10,000) to increase the number of matched features.
The use of a maximum number of extracted features with a random decimation procedure has a direct impact on the total number of matched features. Although the threshold for blob response is varied of a factor ten (from 10,000 to 100,000), there is no significant change in the final number of features. Indeed, the matched feature for the different pairs cannot be more than 8,999 (in the current implementation). This choice is a prefixed parameter at the moment, but its variability will be addressed in future work.
Figure 2 shows the corresponding connection graphs that give an overall graphical representation about the structure of corresponding points in the data set. Results show several connections for the proposed multi-source data set, where in some cases the maximum number of features for a single pair (8,999) was reached.
It should be mentioned that a low threshold increases the number of points between weak image combinations (e.g., images 1-2, 2-3, 3-4) whereas does not modify strong connections (e.g., images 4-5).
Blob threshold 100,000
932 features 595 features 110 features 9,075 features 9,805 features
(b) (c) (d) (e)
Blob threshold 70,000
1,478 features 817 features 219 features 9,380 features 10,936 features
(a) (b) (c) (d) (e)
Blob threshold 40,000
2066 features 1,512 features 454 features 9,638 features 11,577 features
(a) (b) (c) (d) (e)
Blob threshold 10,000
4,265 features 4200 features 822 features 11,546 features 14,958 features
(a) (b) (c) (d) (e)
Figure 1. Multi-image features matched with a variable threshold for the blob detection. (a) Terra/ASTER ID #1; (b) EO-1/ALI ID #2; (c)
EO-1/ALI ID #3; (d) Landsat-5/TM #4; (e) Landsat-5/TM #5
Blob threshold 100,000 Blob threshold 70,000 Blob threshold 40,000 Blob threshold 10,000
(a) (b) (c) (d)
Figure 2. Connection graphs for the affine mapping function computed for different blob detection thresholds. The International Archives of the Photogrammetry, Remote Sensing and Spatial Information Sciences, Volume XL-7, 2014
The estimation of registration parameters was carried out for the different mathematical models. The multi-image corresponding features used in Least Squares adjustment correspond to the threshold combinations illustrated in Figures 1 and 2.
Although different geometric models were described in section 2.2, the resulting systems of equations are linear. The only exception is the approach based on the similarity transformation, where a solution for linearization can be found in Barazzetti et al. (2014b).
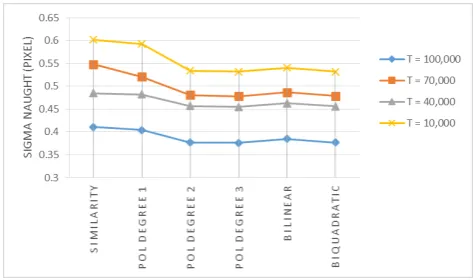
The general problem can be solved via Least squares obtaining the unknown parameter vector (transformation parameters and features for slave-to-slave pairs reprojected on the reference) and the variance-covariance matrix. Figure 3 shows the registration results using different mapping functions and different thresholds used for blob extraction.
The sigma-naught of least squares adjustment showed a sub-pixel accuracy, that was better in the case of low thresholds.
Figure 3. Multi-image registration results using different mapping functions and thresholds for blob calculation. Image ID #5 was assumed as reference image.
The (small) improvement achieved with a low threshold can be due to the limited number of points extracted in this configuration. These features have a better response and therefore are more distinctive. The precision of localization (x, y pixel coordinates) is better and gives an overall improvement of the global registration.
On the other hand, it should be mentioned that the use of a high threshold leads to a small worsening of registration precision. Sub-pixel precision was always achieved and points had a more homogenous distribution in the data set.
The results obtained for the proposed case study (images already terrain corrected) showed that all the proposed geometric model are valid for data registration because data are mainly affected by a similarity transformation, notwithstanding slightly better results were obtained with high order polynomial implementations.
5. CONCLUSIONS
This paper describes a new method for the registration of multi-source satellite images with medium geometric resolution. Some experimental tests were accomplished using a medium-resolution data set made up of Terra/ASTER, Landsat-5/TM and EO-1/ALI multispectral images collected during over a period of twelve years.
The multi-image registration technique proved to be resistant to changes in scale, land-cover, illumination conditions and atmospheric effects. The use of the different thresholds set in
the blob calculation phase, the ratio of descriptors vector, the maximum numbers of points in image pairs, and the normalization of pixel coordinates was investigated as well. Experimental results showed that a low threshold for blob detection provided only a little improvement of the solution (from 0.6 to 0.4 pixels). On the other hand, restrictive thresholds correspond to less homogenous point distribution in the images, with a less reliable estimate of transformation parameters. The advantage of high thresholds concerns the fast data processing, that mainly depends on the number of images and points. On the other hand, these issues can be solved with ad-hoc implementations based on intelligent strategies for keypoint description and matching. This means that a moderate thresholds should be preferred, as they provide better geometric point distributions without significantly degrading the overall accuracy of image alignment.
Acknowledgements
This research is supported by the Italian Ministry of Education, University and Research (MIUR) within the grant FIRB 2010 entitled: ‘Subpixel techniques for matching, image registration and change detection with applications to civil and environmental engineering’. Acknowledgements also go to the National Basic Research Programs of China (973 Programs No. 2012AA121302 and No. 2013CB733204).
REFERENCES
Agarwal, S., Snavely, N., Simon, I., Seitz, S.M. and Szeliski, R., 2009. Building Rome in a day. Proceedings of International Conference on Computer Vision, Kyoto, Japan. 8 pages.
Arya, S., Mount, D.M., Netenyahu, N.S., Silverman, R., and Wu, A.Y., 1998. An optimal algorithm for approximate nearest neighbor searching fixed dimensions. Journal of the ACM, 45(6): 891-923.
Bay, H., Ess, A., Tuytelaars, T., Van Gool, L., 2008. SURF: Speeded Up Robust Features. Computer Vision and Image Understanding, 110(3): 346-359.
Barazzetti, L., Scaioni, M., and Gianinetto, M., 2013. One-to-many registration of Landsat imagery. International Archives of the Photogrammetry, Remote Sensing and Spatial Information Sciences, Vol. XL, Part 7/W2, pp. 37-42.
Barazzetti, L., Gianinetto, M., and Scaioni, M., 2014a. Automatic co-registration of satellite time series via Least Squares adjustment. European Journal of Remote Sensing, 47: 55-74.
Barazzetti, L., Gianinetto, M., and Scaioni, M., 2014b. Simultaneous least-squares registration of satellite time series. In: Proc. 6th Workshop on Hyperspectral Image and Signal Processing: Evolution in Remote Sensing (WHISPERS 2014), Lausanne (Switzerland), 24-27 June, 4 pages (e-doc).
Brown, M., and Lowe, D.G., 2003. Recognizing Panoramas. International Conference on Computer Vision, 2: 1218-1225.
Castro, E.D., and Morandi, C., 1987. Registration of translated and rotated images using finite Fourier transform. IEEE Transactions on Pattern Analysis and Machine Intelligence, 9: 700-703.
Cornelis, N. and van Gool, L., 2008. Fast Scale Invariant Feature Detection and Matching on Programmable Graphics Hardware. Workshop on Computer Vision and Pattern Recognition. 8 pages.
Fischler, M.A., and Bolles R.C., 1981. Random Sample Consensus: A Paradigm for Model Fitting with Applications to Image Analysis and Automated Cartography. Communications of the ACM, 24: 381-395.
Gianinetto, M., and Scaioni, M., 2008. Automated Geometric Correction of High-Resolution Pushbroom Satellite Data. Photogrammetric Engineering & Remote Sensing, 74(1): 107-116.
Gianinetto, M., 2012. Automatic Co-Registration of Satellite Time Series. The Photogrammetric Record, 27(140): 462-470.
Gosthtasby, A., 2005. 2-D and 3-D image registration. John Wiley & Sons, Hoboken (NJ - United States), 258 pages.
Hall, D. L., 1992. Mathematical techniques in multisensor data fusion. Norwood, Artech House Inc.
Hartley, R., 1997. In Defense of the Eight-Point Algorithm. IEEE Transactions on Pattern Analysis and Machine Intelligence archive, Volume 19 Issue 6, pp. 580-593.
Hartley, R., and Zisserman, A., 2004. Multiple View Geometry in Computer Vision. Cambridge University Press.
Kraus, K., 2007. Photogrammetry: Geometry from Images and Laser Scans. Walter de Gruyter, Berlin (Germany), 459 pages.
Khorram, S., Nelson, S.A.C., Cakir, H., and van der Wiele, C.F., 2013. Digital Image Acquisition: Preprocessing and Data Reduction. Handbook of Satellite Applications, pp. 809-837.
Le Moigne, J., Netanyahu, N.S., and Eastman, R.D., 2011. Image Registration for Remote Sensing. Cambridge University Press, United Kingdom, 484 pages.
Lu, D., and Weng, Q, 2007. A Survey of Image Classification Methods and Techniques for Improving Classification Performance. International Journal of Remote Sensing, 28: 823-870.
Mikolajczyk, K. and Schmid C., 2005. A performance evaluation of local descriptors. IEEE Transactions on Pattern Analysis and Machine Intelligence, 27(10): 1615-1630.
Mikolajczyk, K., T. Tuytelaars, C. Schmid, A. Zisserman, J. Matas, F. Schaffalitzky, T. Kadir, L. Van Gool, 2005. A Comparison of Affine Region Detectors. International Journal of Computer Vision, November 2005, Volume 65, Issue 1-2, pp. 43-72.
Muja, M., and Lowe, D., 2009. Fast approximate nearest neighbours with automatic algorithm configuration. In: Proc. of Int. Conf. on Computer Vision (ICCV ’09), Kyoto, Japan, September 27 - October 4, 10 pages.
Pluim, J.P.W., Maintz, J.B.A., and Viergever, M.A., 2001. Mutual information matching in multiresolution contexts. Image and Vision Computing, 19: 45-52.
Pohl, C., and Van Genderen, J.L., 1998. Multisensor image fusion in remote sensing: concepts, methods and applications. Remote Sensing, 19(5): 823- 854
Poli, D., and Toutin, T., 2012. Review of developments in geometric modelling for high resolution satellite pushbroom sensors. The Photogrammetric Record, 27(137): 58-73.
Pratt, W.K., 1991. Digital Image Processing. 2nd ed.. John Wiley & Sons, Inc. New York (NJ - United States).
Price, K.E., 1985. Relaxation matching techniques - a comparison. IEEE Transactions on Pattern Analysis and Machine Intelligence, 7: 617-623.
Rousseeuw, P.J. and Leroy, A.M. ,1987. Robust Regression and Outlier Detection. John Wiley, New York. 329 pages.
Snavely, N., Seitz, S.M. and Szeliski, R., 2008a. Modeling the world from internet photo collections. International Journal of Computer Vision, 80(2): 189-210.
Snavely, N., Seitz, S.M. and Szelinski, R., 2008b. Skeletal sets for efficient Structure from Motion. Proceedings CVPR2008. 11 pages.
Torr, P.H.S. and Murray, D.W., 1993. Outlier detection and motion segmentation. SPIE 2059: 432-443.
Torr, P.H.S. and Zisserman, A., 1995. MLESAC: a new robust estimator with application to estimating image geometry. Computer Vision and Image Understanding, 78(1): 138-156.
Torr, P.H.S. and Zisserman, A., 1998. Robust computation and parametrization of multiple view relations. Proceedings of the 6th International Conference on Computer Vision, Bombay. Pages 727-732.
Torr, P.H.S., 2002. Bayesian model estimation and selection for epipolar geometry and generic manifold fitting. International Journal of Computer Vision, 50(1): 35-61.
Samet, H., 1990. The Design and Analysis of Spatial Data Structures. Addison-Wesley, Reading, MA.
Valgren, C. and Lilienthal, A., 2007. SIFT, SURF and Seasons: long-term outdoor localization using local features. Proceedings of 3rd European Conference on Mobile Robots, pages 253-258.
Wald, L., 2002. Data Fusion: Definitions and Architectures. Les Presses de l’Ecole des Mines, Paris (France).