158
Determinan The Evaluation of Work Unit Application System
(
Sistem Aplikasi Satker (SAS)
:
An Information System of Success Model Approach
Pandu Krida Laksana Bambang Subroto
Zaki Baridwan Universitas Brawijaya [email protected]
Abstracts: This study aims at examining and analyzing the effects of system quality, information quality, the significance of system on user satisfaction partaking as mediating variables. The survey was carried through by way of census mode (total sampling) in all individuals using SAS and were employed in work units (Satker) partnering with KPPN Sidoarjo in fiscal year 2016, with the number of 86 research subjects. The used analysis methods was SEM-PLS with the assistance of WarpPLS Software 5.0. The results showed that there was a positive effect of the system quality, the importance of the system, and the usability of the system on users’ satisfaction, but the information quality was not empirically proven effective on user satisfaction. The system quality and information quality positively effected on the usability of the system, but the importance of the system did not affect the usefulness of the system.
Keywords: Usability, user satisfaction, information quality, system quality, significance of the system.
INTRODUCTION
Rapid advancement of the technology eminently provides feasibility upon administration
organization activities through the development of information system. In illustration,
Accounting Information System. The development of Accounting Information System carried
out by the administration is Work Unit Application System (SAS) employed by DIPA APBN
recipients work unit. SAS is a technology-based information system whose role is vital in the
performance of APBN (State Budget Revenue/ Government Budget) due to generating output in
form of warrant pay (SPM), state treasurer’accountability statement or other information.
JOURNAL OF ACCOUNTING AND BUSINESS EDUCATION
159
Despite the fact that information system is believed to be able to improve organization
performance, the implementation of SAS faces multiple problems such as SAS application
update difficulty, data posting problem, SAS error application, the difficulty in data input to
SAS, and the difficulty in correcting SAS data.
The hindrances in operating SAS will surely bring about negative responses on SAS so
that it would affect satisfaction of SAS users. Mulyono (2009), Istianingsih and Utami (2009), as
well as Radityo and Zulaikha (2007) discovered that application user satisfaction had an
influence on user performance, user performance would affect on organization performance to
reach out objectives. Thereby, it is imperative to discover the factors contributing on the
satisfaction of SAS users.
Seddon and Kiew (1996) argued that to assess the successful implementation of
information systems simply by way of measuring the level of user satisfaction of the information
system. Therefore, it is necessary to analyze the factors that affect the satisfaction of use to know
the extent of user satisfaction system. Through the development of the successful model of
information systems DeLone and McLean (DM) (1992), Seddon and Kiew (1996) stated that
user satisfaction was influenced by information quality, system quality, system importance, and
usability.
LITERATURE REVIEW AND HYPOTHESES
The accounting information system is an integrated activity that transforms financial data
into financial information in a report availing to the parties who need (Mardi, 2014). A system
will be deemed good should it be able to generate performance and useful for its users. So is the
accounting information system that is expected to produce performance and value for the
organization. Then the question arises, how to measure the success of an accounting information
system. Several studies were conducted to determine the factors that affect the success of
information systems. One of the most prominent and comprehensive studies is the research
undertaken by DeLone and McLean (Hartono, 2011).
DeLone dan McLean (1992) concluded that there were six variables that could influence
and assess a particular information system. Those variables were system quality, information
McLean incorporates influencing variable on the success of information system into the entire
success mode of information system.
Figure 1
DM Information System Success Mode
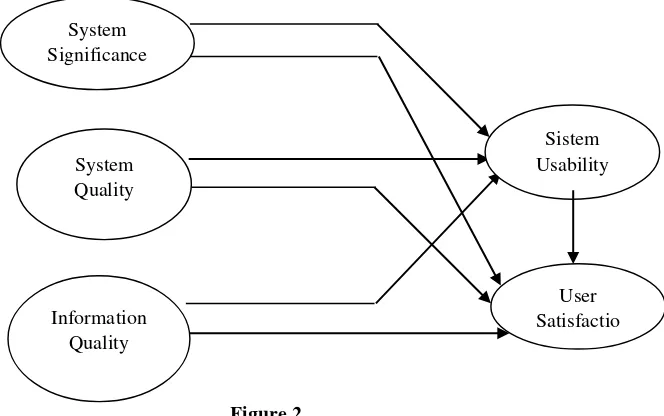
Seddon and Kiew (1996) carried out a partial research of DM information system success
model. They took the initial part of DM mode, namely user satisfaction, use, system quality, and
developed that mode, which was the substitution of use variable into usability variable, added
new variable namely the significance of the system, and causal relation between usability and
user satisfaction were substituted into one-way relationship.
.
Figure 2
Seddon dan Kiew Information System User Satisfaction Mode
System Quality
Informatio n Quality
User Satisfaction
Use
Individual Impact
Organizatio n Impact
System Significance
User Satisfactio Information
Quality System Quality
161
SAS is an application launched by General Directorate of Treasury of the Ministry of
Finance in 2015 as a renewal of teh previous applications. SAS is an application that functions in
the process of disbursement of DIPA funds and the accountability process.
System Quality and System Usability
Seddon and Kiew (1996) stated that system quality is related to whether there is a "bug"
in the system, the consistency of "user interface", ease of use, system response, documentation,
and quality and program maintenance in the system. The usability of the system itself according
to Davis (1989) was the extent to which a person's belief in employing a particular information
system could improve their performance.
A system that has fast response characteristics, not many bugs, and easy to use will often
be used because the system users are helped by the existence of the system. This indicates that
the existing system has a good quality and is able to assist users in working. So with high system
quality, users will feel the system is useful and can improve their performance.
Sumiyati, et al. (2013), Supriatna (2012), and Floropoulos, et al. (2010) found that with
the increase system quality, the useability of the system would refine. Based on the description,
the researcher proposes hypothesis as follows:
H1: The quality of the system positively affects the usability of the system
Information Quality and System Usability
Information quality is a tool to measure the quality of output from an information system
(Hartono, 2007). Characteristics of quality information according to Ahituv (1980), among
others, the timeliness, content, and format of information. Seddon and Kiew (1996) suggested
that increased quality of information would improve the usability of the system. With the output
of an information system that is current, relevant, accurate, and timely then the user feels the
generated information system useful. The quality of useful information can improve the
usefulness of a technology-based information system. Thus, over improving information quality,
users will more often utilize the technology-based information system in their work that will
ultimately amplify the usability of the system.
Rai's research, et al. (2002), Rana, et al. (2015), and Shuqin, et al. (2016) found that the
the description and the results of previous research, the researcher proposes these following
hypothesis:
H2: The quality of information positively affects the usability of the system.
System Quality and User Satisfaction
The satisfaction of information user is a stage as to how far the user trusts available
information system with user’ expectation (Ives, et al., 1983). On the other hand, according to
David, et al. (1989) in Istiangingsih and Utami (2009) is a perception of ease in the use of the
system. This shows that if users of information systems find it easy to use the system, they will
not need much effort to use it so that users can take advantage of their time to do other things
that can increase their satisfaction in using information systems.
Studies undertaken by Miss (2014), Machanda and Mukherjee (2014), and Freeze, et al.
(2010) figured out if the quality of the system increased the user satisfaction of information
systems also increased accordingly. In assent with the abovementioned statement, the researcher,
thereby, suggested this following hypothesis:
H3 : System Quality affects positively on usere satisfaction.
Information Quality and User Satisfaction
With regard to DM information system success model, the quality of information affects
user satisfaction. Thus, the quality of information that has the characteristics of the present,
adequacy, comprehension, free of bias, timeliness, reliability, and relevance can improve the
ability of system users in decision-making, work effectiveness, and improve the quality of work
so that with the increase of information quality, user satisfaction will also increase in response .
Wang and Liao (2008), Nursudi and Sudarno (2013), and Khayun, et al. (2012) about the
information system found the result that the increased quality of information, user satisfaction
will increase. Based on the description, the researcher proposes the following hypothesis:
H4: Information Quality positively affects user satisfaction
System Significance, Usability and User Satisfaction
The variable system significance was adopted by Seddon and Kiew (1996) in reference of
163
involvement in information systems was a subjective psychological state when information
system users deemed that the system was significant and relevant. Had an information system
user feel that an information system was significant, they would consider the system useful.
Larcker and Lessig (1980) in his study of the usefulness of information reveal that the
perception of "importance" reflects the quality that can reflect the relevant information according
to the needs of decision makers. If the generated information matches the need required to
complete the job, the quality will increase the usefulness of the system. Thus, with increased
"importance" perceptions, the usefulness of the system will also increase. Seddon and Kiew
(1996) stated that the availability of an information system to complete a job, the more
significant the work was, the better the satisfaction of information systems use. When a system
was available trivial jobs, the usability of user satisfaction may be low.
Research conducted by Armstrong, et al. (2005) found out that the importance of the
system has a positive effect on the use of the system and user satisfaction. Darmawan (2010) and
Triono, et al (2013) in his research to get the result that the importance of the system has a
positive influence on the usefulness of the system. Based on the above description, the researcher
proposes the following hypothesis:
H5: The importance of the System positively affects System Utility
H6: The Importance of the System positively affects User Satisfaction
Usability and User Satisfaction
Everyone has expectations about the benefits that an information system will provide.
Neither the information system can meet or can not meet one's expectations, the information
system is expected to be useful. The more useful information systems, the more likely users are
satisfied because the information system is able to provide benefits in line with expectations.
Research conducted by Istianingsih and Wijanto (2008), Floropoulos, et al. (2010), and
Jiang and Ji (2015) have found that high levels of system usability can increase the satisfaction
of system users. Based on the above explanation and previous research, the researchers proposed
the following hypothesis
METHODS
This research is an explanatory research. This research is a quantitative research that
measure or test the variables through hypothesis testing by using statistical test. The unit of
analysis in this study is the individual working on the working unit Satker KPPN Sidoarjo and
become a user of SAS. KPPN Sidoarjo was chosen because it is the best KPPN in East Java in
2012 (Setiawan, 2012). The intended SAS user is the individual dealing with the operation of
SAS in view of DIPA satker implementation.
The population in this study are individuals who use Satker Application System (SAS)
application and work on Satker who become partners of KPPN Sidoarjo in fiscal year 2016.
Based on data of KPPN Sidoarjo, the number of working units that are partners is 86 Satkers and
with the existence of an application operator SAS at each satker, the total population in this study
were 86 individuals. This research uses saturation sampling technique, in which all member of
population are used as sample (Sugiyono, 2005).
This study uses primary data. The methods of data collection in this study uses survey
method. The data were collected by way of questionnaire research instrument. The distribution
of questionnaires is done by way of drop off delivery. In addition, this method is selected
because according to Sugiyono (2005) submission of questionnaires with face to face with
respondents would bring about decent condition so that the research subjects would be willing
and responsive to hand in objective data.
This research uses Structural Equation Modeling (SEM) method - Partial Least Square
(PLS) to analyze data. PLS is a method of structural equation analysis that can be used to analyze
the effect of exogenous variables on endogenous variables. In addition, PLS is also able to
analyze several research variables simultaneously or simultaneously so that PLS is considered
better than multiple regression.
Model evaluation in this research is done by Partial Least Square (PLS) approach by
evaluating outter model and inner model. Outter model is used to measure validity and reliability
value of model while inner model is used to evaluate causality relationship between latent
variable. The tests of structural model or inner model is performed by evaluating the coefficient
of determination or R-Squares (R2) of each endogenous latent variable / dependent variable. In
addition to looking at the magnitude of R-Squares, inner model evaluation can be done with
165
In this research the used hypothesis is one-tailed hypothesis (one-tail). The statistic
significance test is performed to determine whether the hypothesis is accepted or rejected. If the probability value is less than the alpha value (α), it can be concluded that the test results are statistically significant so that the researcher can accept the hypothesis (Abdillah and Hartono,
2015). This study uses alpha (α) value of 5%.
RESULTS
The number of the distributed questionnaire was 86 and there were 2 unreturned. It was
owing to the fact that there existed re-organized work units and complicated bureaucracy issue to
meet the research subjects. There were 78 questionnaires that could be processed ana analyzed
out of 84. Whereas, 6 of them could not be processed due to incomplete filling process.
The characteristics of the research subjects with regard to their sex were that of male got
more number than female with 51 or 65.38% and 27 or 34.62% for female. Age wise, 48
respondents or 61.54% were 40-year-old, 15 respondents or 19.23 were younger than
31-year-old, and the respondents from older than 40 category were 15 people or 19.23%.
The majority of respondents were the undergraduate consisting of 44 (56.41%), then
highschoolers 19 (24.36%), Diploma (10) or 12.82%, and 5 (6.41%) from graduate. The majority
of respondents had worked for 6-10 years with a total of 34 people or 43.59%, employment
under 6 years of 21 people or 26.92%, 11-15 years working period of 12 people or 15.38% and
over 15 years as many as 11 people or 14.10%. The majority of respondent's working period was
more than 5 years so it indicates that respondents are experienced in the use of technology-based
accounting information system.
The majority of respondents had experienced in operating SAS or SPM (application
before SAS) less than 3 years as many as 38 people or 48.72%, 3-4 years there were 24 people or
30.77 people, 5-6 years there were 10 people, and there were 6 people with more than 7 years
experience.
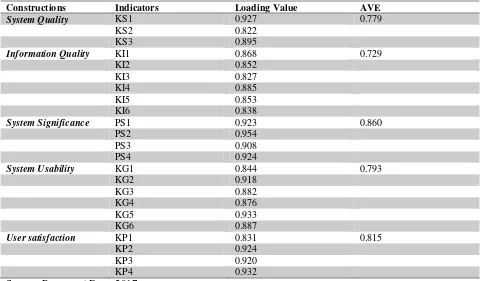
Validity Test
Variable’ validity test undergoes two stages. Firstly, convergent validity with more than
0.70 or Average Variance Extracted (AVE) bigger than 0.5 of indicator loading value
while for AVE was bigger than 0.5. Hence, it could be concluded that all instruments in this
research have met the criterions of convergent validity test.
Table1. The Values of Loading Factor and AVE
Constructions Indicators Loading Value AVE
System Quality KS1 0.927 0.779
KS2 0.822
KS3 0.895
Information Quality KI1 0.868 0.729
KI2 0.852
KI3 0.827
KI4 0.885
KI5 0.853
KI6 0.838
System Significance PS1 0.923 0.860
PS2 0.954
User satisfaction KP1 0.831 0.815
KP2 0.924
KP3 0.920
KP4 0.932
Source: Processed Data, 2017
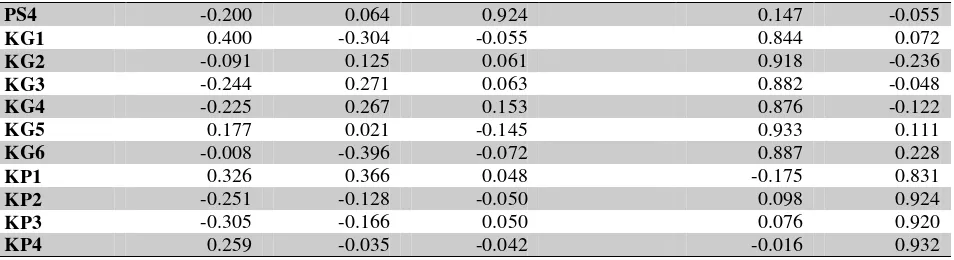
Stage two, discriminant validity with loading value parameter, indicator to construct was
167
Construct was deemed reliable unless cronbach’s alpha value or composite reliablity stood bigger than 0.7. In view of table 3, Cronbach’ Alpha Value and Composite Reliability Value were bigger than 0.7 for all constructs, thus, all constructs could be concluded reliable.
Table 3. Cronbach’s Alpha and Composite Reliability
variable. The value of R2 reflects the predictive power of the structural model, the higher the R2
value the better the prediction model of the research model.
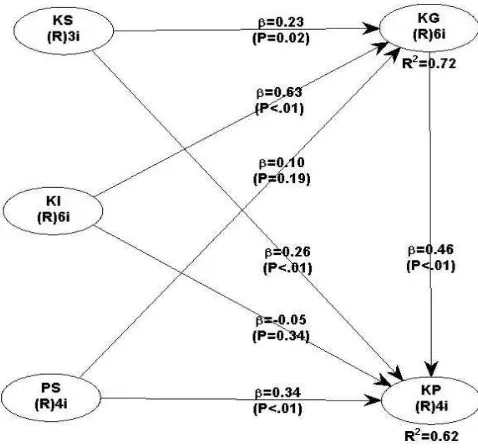
Based on Table 4, the latent variables of system usability have R2 of 0.718. It can be
interpreted that latent variables of system quality, information quality, and importance of the
system can explain variant variables of latent variability in system usability by 72%, while the
remaining 28% is influenced by other variables not covered in this study and error.
The value of R2 for the latent variable of user satisfaction is 0.623. It can be interpreted
that latent variable of system quality, information quality, system importance and system
usability can explain variant of latent variable variation of user satisfaction by 62%, while the
Table 4. R-Squares Value Constructs R-Squares Value
System Usability 0.718
User Satisfaction 0.623
Inner model evaluation was also performed by way of assessing predictive relevance value
(Q2) with this following calculation: Q2 = 1 - (1-R
12) (1-R22) .... (1-RP2) Q2 = 1 - (1-0,718) (1-0,623) Q2 = 0,893686
Based on the abovementioned calculation, the value of Q2 is 0.893686 or 89.37%, so it
can be interpreted that the research model has predictive relevance. This explains that the data
variant that can be explained by this research model is 89.37%, while the rest of 10.63% is
explained by other factors not covered in this research and error.
Hypothesis testing of this research used structural equation method by way of WarpPLS
5.0 analysis tool. The size of the significance of the hypothesis support could be seen through the
probability value. Should the probability value be less than the alpha value (α), it could be
concluded that the test results are statistically significant so that the hypothesis was accepted.
This study had a 95% confidence level or α = 0.05 so the hypothesis could be accepted if P value
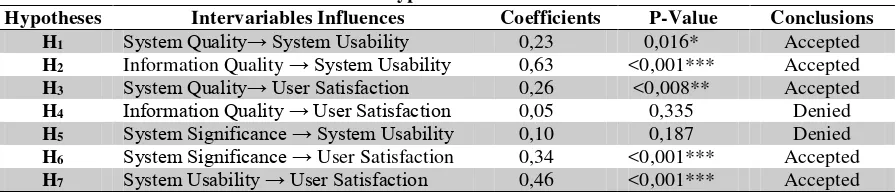
is less than 0.05. Here are the test results that have been brought off.
169
H1 System Quality→ System Usability 0,23 0,016* Accepted
H2 Information Quality → System Usability 0,63 <0,001*** Accepted
H3 System Quality→ User Satisfaction 0,26 <0,008** Accepted
H4 Information Quality → User Satisfaction 0,05 0,335 Denied
H5 System Significance → System Usability 0,10 0,187 Denied
H6 System Significance → User Satisfaction 0,34 <0,001*** Accepted
H7 System Usability → User Satisfaction 0,46 <0,001*** Accepted
Significance Level is represented as ***, **, and * based one one-side test (one tail) on the error level 0,1%, 1%, and 5 %.
Based on Table 5, hypothesis 1 (H1) which states that the quality of the system positively
affect the usefulness of the system whose a p-value smaller than 0.05, that is equal to 0.02 so it
can be concluded that H1 accepted. The coefficient value of 0.23 indicates that the latent variable
of system quality can explain the latent variable of system usability of 23%.
Based on Table 5, hypothesis 2 (H2) which states that the quality of information
positively affect the usefulness of the system of which a p-value smaller than 0.05, that is <0.01
so it can be concluded that H2 accepted. The coefficient value of 0.63 indicates that latent
variable of information quality can explain the latent variable of system usability of 63%.
Based on Table 5, hypothesis 3 (H3) which states that the quality of the system has a
positive effect on user satisfaction of which p-value smaller than 0.05, that is <0,01 so it can be
concluded that H3 accepted. Coefficient value of 0.26 indicates that latent variable of system
quality can explain latent variable of user satisfaction equal to 26%.
Based on Table 5, hypothesis 4 (H4) which states that the quality of information has a
positive effect on user satisfaction whose p-value greater than 0.05, that is 0.34 so it can be
concluded that H4 is rejected.
Based on Table 5, hypothesis 5 (H5) which states that the importance of the system
positively affect the usability of the system has a p-value greater than 0.05, that is equal to 0.19
Based on Table 5, hypothesis 6 (H6) which states that the importance of the system has a
positive effect on user satisfaction whose p-value smaller than 0.05, that is <0,01 so it can be
concluded that H6 accepted. The coefficient value of 0.34 indicates that the latent variable
importance of the system can explain the latent variable of user satisfaction by 34%.
Based on Table 5, hypothesis 7 (H7) which states that the usability of the system has a
positive effect on user satisfaction having p-value smaller than 0.05, that is <0,01 so it can be
concluded that H7 accepted. The coefficient value of 0.46 indicates that the latent variable of
system usability can explain the latent variable of user satisfaction by 46%.
DISCUSSIONS
The Effect of System Quality on Usability
The results of this study are consistent with previous studies conducted by Floropoulos, et
al. (2010), Supriatna (2012), and Sumiyati (2013) stating that the increasing quality of
technology-based accounting information system is reflected in the level of convenience, the
level of response, consistency of "user interface in using accounting information system, will
further improve the usability system to improve performance.
The quality of the SAS system improves the usability of SAS indicates that SAS is an
easy-to-use application because there are menus that support user work such as budget
realization reports, work contracts with third parties, book keeping, etc. The SAS user interface
is simple enough for users to easily learn. System maintenance is done consistently as regular
application updates to adjust to the latest regulations.
The usability of SAS is measured through 6 dimensions, ie faster finished work,
increased performance, increased productivity, increased effectiveness, easier job, and job
benefits. Ease, simple user interface, and consistent system maintenance support the use of SAS
as measured through the 6 dimensions. Thus, the increasing quality of SAS systems will improve
the usefulness of SAS.
The Effect of Information Quality on Usability
These results are in concerts with findings of Seddon and Kiew (1996), Rai, et al. (2002),
171
user's belief in the quality of information. Quality of information in question is the output of the
information system that is current, relevant, accurate, and timely.
SAS generates information relevant to the disbursement work and financial
responsibilities of the Working Unit, such as a Pay Order (SPM), a General Cash Book, a
Subsidiary's Cashbook, and an Accountability Report. Information generated by SAS also
adjusts to current conditions, such as a salary increase for civil servants. Working Paper and
State Ministry / Institution Budgets are also available on SAS, so SAS is able to provide accurate
information.
Characteristics of information generated SAS as described above can provide benefits to
users in doing their work, such as improving performance, productivity, effectiveness and
efficiency of work. Thus, the increased quality of SAS information through relevance, accuracy,
updated information from SAS, SAS usability levels are.
The Effect of System Quality on User Satisfaction
The results of this study in accordance with the theory of success DM information system
that states that the quality of information affect the satisfaction of users of information systems.
The results of this study support the research of Miss (2014), Machanda and Mukherje (2014),
and Freeze, et al. (2010) which states that if the quality of the system increases then user
satisfaction system also increases.
The satisfaction of SAS users is the level of user response to certain factors that exist in
SAS in regard with their expectations. The quality of SAS systems is influenced by several
factors, such as user interface and system maintenance. These factors give users ease in using
SAS, users do not require excessive effort in using SAS. Users benefit according to their
expectations of using SAS, that is easy to use, easy to learn, and support their work. The
fulfillment of SAS User’ expectations will create a feeling of satisfaction on them. Thereby, by
improving the quality of the system, user satisfaction will elevate.
The Effect of Information Quality on User Satisfaction
These results do not support the studies of Seddon and Kiew (1996), Wang and Liao
higher the user information system satisfaction. However, the results of the research were in
concert with the research of Radityo and Zulaikha (2007).
Darmawan (2010) argued that the quality of information systems information was
mandatory, not necessarily appropriate to measure the level of user satisfaction. This happens
because user satisfaction is an attitude that comes from within and is not a force as in the
application of information systems that are mandatory. Expectations from each user of the
information system differ in interacting with the information system which is mandatory. Some
are satisfied, some are dissatisfied and some are very satisfied with the information system. This
happens because the ability of individuals in mastering the system affect the benefits gained from
the system. Very likely if a system is already available properly but the user can not operate or
master the system optimally, then there will be no benefits obtained, so that no effect on user
satisfaction.
Muharor, et al (2015) in his research addressed that the quality of information was meant
for the benefit of the work unit, but do not necessarily represent the personal interests of the
respondent so that the quality of information is not a positive effect on user satisfaction.
The results show that the quality of SAS Information has no contribution in improving
user satisfaction. This is allegedly because the information generated by the SAS can not
necessarily be directly submitted to the KPPN. Information in the form of Computer Data
Archive (ADK) of SPM and contractual data must be converted first in reference with the
financial software applications used by KPPN. This problem seems simple, but it seems
ineffective and inefficient because the data can not be directly received KPPN applications, must
be through data conversion, so that although the current SAS generated information, relevant and
accurate, this situation can lead to dissatisfaction of SAS users.
The Effect of System Significance to Usability
The results of this study are similar to the Oktavia (2016) study which states that the use
of systems viewed from how often users use the system, is not influenced by the attitude of the
users who consider the system important. This is because the frequent use of the system is more
due to the compulsory nature of compulsory systems and the lack of user understanding of the
systems used. When the ability to use a computer owned by someone is not the same, then
173
tend to be because the interest based on the obligation to use SAS is not based on the user's
attitude, that is, the individual's positive or negative perceptions of the SAS implementation.
As a result, hence, the results of the study indicate that the significance of SAS system
has no contribution in improving the usability of SAS. Users only employ SAS on which it is
necessary if they have a lack of interest even though SAS is an information system provided to
accomplish important tasks.
The Effects of System Significance to Usability
The results of this study are in line with the study of Seddon and Kiew (1996) which
states that the availability of an information system to complete a job, then with the more
important the job, the user satisfaction of information systems will increase. The results of this
study are consistent with Armstrong's research, et al. (2005), Darmawan (2010), and Triono, et al
(2013) which states that the importance of the system has a positive effect on user satisfaction.
Thus, the results of the study show that if SAS users consider the system important, then
SAS users will benefit from the existence of SAS and ultimately get satisfaction. For example,
one of the functions of SAS is a means to complete the treasurer's job in accounting for the
Satker's finances so that as a SAS user, the treasurer feels SAS is important and helpful in
assisting his work. The experienced benefits by the treasurer as a SAS user will certainly
increase the treasurer's satisfaction with SAS.
The Effect of Usability on User Satisfaction
The results of this study is in concert with the theories of DM information systems
success stating that the use of information systems increases will increase user satisfaction. The
results of this study are consistent with the study of Istianingsih and Wijanto (2008),
Floropoulos, et al. (2010), and Jiang and Ji (2015) stating that usability perceptions have a
positive effect on user satisfaction.
Rukmiyati and Budiartha (2016) stated that usability perception is a measurement of trust
should an information system provide many benefits for its users. If the user of the information
system believes that the used information system is useful, the user will feel satisfied and use the
users would hold back to use that system. The result of the research, thereby, shows that SAS can
be worthwhile for its users, the users feel that satisfied, as what is expected.
CONCLUSION
In view of the addressed hypotheses tests and discussions, the conclusions would be as
follows: High quality ststem can enhance user satisfaction. SAS quality, boosting satisfaction
indcates that SAS users deem it easy to learn SAS, and easy to use it so that users do not need to
exert effort to use SAS. The users benefit it as what they expect in operating SAS so that they
feel satisfied using it; The result also proves that SAS information quality does not effect on SAS users’ satisfaction. This might be due to the fact that SAS is mandatory so that it is not feasible to measure the level of user satisfaction; The result of this research figures that high
significance of the system can boost user satisfaction. The availability of SAS to assist the task
of DIPA budget disbursement, work unit accountability, and other functions can enhance the
satisfaction of SAS users as the tasks they work on are vital for Work Unit financial
management.
The following research is that high usability can improve SAS users satisfaction. Users
frequently operate SAS for their professional basis in view of it is able to boost productivity,
effectiveness, and performance. Hence, the more helpful SAS, the bigger the likelihood for the
users to experience satisfaction since SAS is able to generate benefits as what the users expect.
REFERENCES
Ahituv, N. (1980). A Systematic Approach Toward Assesing the Value of an Information System. Management Information Systems Research Center, 4(4), 61-75.
Armstrong, B., Fogarty, G.J., Dingsdag., dan Dimbleby, J. (2005). Validation of a Computer user Satisfaction Quisionnare to Measure IS Success in Small Business. Journal of Research and Practice in Information Technology, 37(1), 27-42.
175
Darmawan. (2010). Pengaruh Pentingnya Sistem, Kualitas Sistem dan Kualitas Informasi Terhadap Kegunaan dan Kepuasan Pengguna dalam Pengembangan Sistem Informasi Manajemen Keuangan Daerah Kabupaten Sragen. Tesis tidak dipublikasikan. Universitas Sebelas Maret. Surakarta.
DeLone, W.H., dan Mclean, E.R. (1992). “Information System Success: The Quest for the
Dependent Variable”. Information System Research, 60-95.
Floropoulos, J., Spathis, C., Halvatzis, D., dan Tsipouridou, M. (2010). Measuring the Success of the Greek Taxation Information System. International Journal of Information Management, 30, 47-56.
Freeze, R., Alshare, K.S., Lane, P.L., dan We, H.J. (2010). IS Success Model in E-Learning Context Based on Student Perception. Journal of Information Systems Education, 21(2), 173-184.
Hartono, J. (2007). Model Kesuksesan Sistem Teknologi Informasi (Edisi 1). Yogyakarta, Indonesia: Penerbit Andi.
Hartono, J. (2011). Sistem Tatakelola Teknologi Informasi. (Edisi 1). Yogyakarta, Indonesia: Penerbit Andi.
Hartono, J. dan Abdillah, W. (2015). Partial Least Square (PLS) - Alternatif Structural Equation Modeling (SEM) dalam Penelitian Bisnis. (Edisi 1). Yogyakarta, Indonesia: Penerbit Andi.
Istianingsih dan Utami, W. (2009). Pengaruh Kepuasan Pengguna Sistem Informasi Terhadap Kinerja Individu (Studi Empiris pada Pengguna Paket Program Aplikasi Sistem Informasi Akuntansi di Indonesia). Simposium Nasional Akuntansi 12.
Istianingsih dan Wijayanto, S.H. (2008). Pengaruh Kualitas Sistem Informasi, Perceived Usefulness, dan Kualitas Informasi Terhadap Kepuasan Pengguna Akhir Software Akuntansi. Simposium Nasional Akuntansi 11.
Ives, B., Olson, M.H., dan Baroudi, J.J. (1983). The Measurement of User Information Satisfaction. Communication of the ACM, 26(10), 785-793.
Jiang, X., dan Ji, S. (2015). E-Goverment Web Portal Adoption: The Effects of Service Quality. e-Service Journal, 9, 43-62.
Khayun, V., Ractham, P., dan Firpo, D. (2012). Assesing e-Excise Success with DeLone and
McLean’s Model. The Journal of Computer Information Systems, 52(3), 31-40.
Manchanda, A., dan Mukherjee, S. (2014). An Empirical Application of DeLone and McLean Model in Evaluating Decision Support System in the Banking Sector of Oman. Journal of International Technology and Information Management, 21(2), 47-58.
Miss, M.B.A. (2014). Information Systems User Satisfaction: A Survey of the Postgraduate School Portal, University of Ibadan, Nigeria. Library Philosophy and Practice.
Muharor, L. A., Busaini., dan Fitriah, Nur. (2015). Determinan Kesuksesan Aplikasi SIA Komdanas pada Satuan Kerja di Koordinator Wilayah Pengadilan Tinggi Mataram. Jurnal InFestasi, 11(2), 151-170.
Mulyono, I. (2009). Uji Empiris Model Kesuksesan Sistem Informasi Keuangan Daerah (SIKD) Dalam Rangka Peningkatan Transparansi dan Akuntabilitas Keuangan Daerah. Simposium Nasional Akuntansi 12.
Nursidi, A., dan Sudarsono. (2013). Faktor-Faktor yang Mempengaruhi Tingkat Kepuasan Pengguna Aplikasi Pelaporan Keuangan Pemerintah. Diponegoro Journal of Accounting, 2(3), 1-12.
Oktavia, D.D., Saraswati, Erwin., Baridwan., Zaki. (2016). Faktor-Faktor yang Mempengaruhi Kesuksesan Sistem Informasi Manajemen Daerah dengan Pendekatan Model DeLone dan McLean yang Dimodifikasi. Jurnal Riset & Aplikasi Akuntansi dan Manajemen. 1(3).
Rai, A., Lang, S.S., dan Welker, R.B. (2002). Assesing the Validity of IS Success Models: An Empirical Test and Theoretical Analysis. Information Systems Research, 13(1), 50-69.
Radityo, D., dan Zulaikha. (2007). Pengujian Model DeLone dan McLean dalam Pengembangan Sistem Informasi Manajemen (Kajian Sebuah Kasus). Simposium Nasional Akuntansi 10.
Rana, N.P., Dwivedi, Y.K., Williams, M.D., dan Weerakkody, V. (2015). Investigating Success of an e-Govermnet Initiative: Validation of an integrated IS Success Model. Inf Syst Front, 17, 127-142.
Rukmiyati, N.M.S., dan Budiartha, I. K. (2016) Pengaruh Kualitas Sistem, Kualitas Informasi, dan Perceived Usefulness pada Kepuasan Pengguna Akhir Software Akuntansi (Studi Empiris pada Hotel Berbintang di Provinsi Bali). E-Jurnal Ekonomi dan Bisnis Universitas Udayana. 5(1), 115-142.
Seddon, P.B., dan Kiew, M. (1996). A Partial Test and Developmentof Delone and McLean’s Model of IS Success. Australian Journal of Information Systems, 4(1), 90-109.
Setiawan, I. (2012, September 26). KPPN Sidoarjo Masuk Tiga Besar Terbaik. Retrieved from http://www.antarajatim.com/lihat/berita/95944/kppn-sidoarjo-masuk-tiga-besar-terbaik.
Shuqin, B.H.M.C., Qamar, S., dan Mattiullah, B. (2016). Examining Success of Land Record Information Systems (LRMIS) in Pakistan: Validating an Incorporated IS Success Model.
177
Sholihin, M., dan Ratmono, D. (2013). Analisis SEM-PLS dengan WarpPLS 3.0 untuk Hubungan Nonlinier dalam Penelitian Sosial dan Bisnis (Edisi 1). Yogyakarta, Indonesia: Andi Offset.
Sugiyono. (2005). Metode Penelitian Administratif (Edisi 13). Bandung, Indonesia: Alfabeta.
Sumiyati, L., Yuliansyah, Y., dan Dewi, F.G. (2013). The Effect of Information System Quality, Information Quality, and Perceived Usefulness on Accounting Software User Satisfaction.
Simposium Nasional Akuntansi 16.
Supriatna, I. (2012). Pengaruh Kualitas Sistem Informasi dan Kualitas Informasi terhadap Persepsi Kegunaan dan Kepuasan Pengguna. Jurnal Ekonomi, Keuangan, Perbankan, dan Akuntansi, 4(1), 45-60.
Triono, A., Mustika, I.W., dan Adhipta, D. (2013). Evaluasi Implementasi Library Information System (UMSLibrary) dari Perspektif Mahasiswa di Universitas Muhammadiyah Surakarta (UMS). Komuniti, 5(1), 10-16.