O R I G I N A L P A P E R
Comprehensive Stability Evaluation of Rock Slope Using
the Cloud Model-Based Approach
Zaobao Liu•Jianfu Shao •Weiya Xu•Fei Xu
Received: 13 March 2013 / Accepted: 28 October 2013
Springer-Verlag Wien 2013
Abstract This article presents the cloud model-based approach for comprehensive stability evaluation of com-plicated rock slopes of hydroelectric stations in moun-tainous area. This approach is based on membership cloud models which can account for randomness and fuzziness in slope stability evaluation. The slope stability is affected by various factors and each of which is ranked into five grades. The ranking factors are sorted into four categories. The ranking system of slope stability is introduced and then the membership cloud models are applied to analyze each ranking factor for generating cloud memberships. After-wards, the obtained cloud memberships are synthesized with the factor weights given by experts for comprehensive stability evaluation of rock slopes. The proposed approach is used for the stability evaluation of the left abutment slope in Jinping 1 Hydropower Station. It is shown that the cloud model-based strategy can well consider the effects of each ranking factor and therefore is feasible and reliable for comprehensive stability evaluation of rock slopes. Keywords Rock slopeStability evaluationCloud modelsMembership cloudAnalytical hierarchy processJinping 1 Hydropower station
1 Introduction
Stability acts as an important and permanent issue during the design and construction of slopes in hydropower sta-tions, especially the dam abutment slopes in mountainous areas. The abutment slope over the dam is a geological structure having complex stability problems. The slope failure would result in high risk to the safety of the dam. For arch dams, the abutment slope is even an essential part of the resisting system to undertake the loads transferred from the dam. Thus, geological engineers and researchers have paid special attention to the stability of the abutment slopes in the dam area. During the last decades, substantial works have been approached for evaluation of slope sta-bility: the empirical method (Hoek and Bray 1981; Bie-niawski1979; Goodman1989; Aydan et al.1989; Romana et al.2003; Rodrigo and Hu¨rlimann2008; Pantelidis2009; Taheri and Tani 2010; Jhanwar 2012), the analytical ana-lysis (Hoek and Bray 1991; Lam and Fredlund1993; Na-wari et al. 1997; Bye and Bell 2001; Rodrigo and Hu¨rlimann2008; Liu et al.2008; Latha and Garaga2010; Saada et al.2012) and the numerical modeling (Goodman and Shi 1985; Hoek and Bray 1991; Jeongi-gi and Kulat-ilake 2001; Wang et al. 2003; Hatzor et al. 2004; Stead et al.2006; Kveldsvik et al.2009; Alejano et al.2011) just to mention a few. These methods generally propose a deterministic approach for slope stability analysis. In practice, these different kinds of methods are often used in a coupled way in order to perform a reliable stability evaluation of complex rock slopes.
However, it is recognized that uncertainty is the main characteristic of most engineering problems such as hydropower stations. Nothing is assured except for the uncertainty itself (Li and Du 2007). Slope engineering deals with natural data that are filled with uncertainties
Z. Liu (&)J. ShaoW. Xu
Geotechnical Research Institute, Hohai University, Nanjing 210098, China
e-mail: [email protected]
Z. LiuJ. Shao (&)
Laboratory of Mechanics of Lille, University Lille
1-Science and Technology, 59655 Villeneuve d’Ascq, France e-mail: [email protected]
F. Xu
(Liu et al.2012). The fundamental features in uncertainties are the randomness and the fuzziness which are discussed in probability theory and fuzzy mathematics, respectively. As known, either of the two theories is capable of accounting for randomness or fuzziness but insufficient to handle both alone. Based on this point, in the past decade, some uncertainty methods have been proposed and applied in slope stability evaluation, e.g., the fuzzy method (Park and West2001; Park et al.2005,2012; Jimenez-Rodriguez et al. 2006; Aksoy and Ercanoglu 2007; Duzgun and Bhasin 2009; Abbas et al. 2011), the matter-element method (Wang and Pan2004). Generally, there are three steps for implementation of these methods: (1) collecting data related to slope stability; (2) ranking related factors; (3) realization of comprehensive evaluation of slope sta-bility. In these evaluations, slope stability is often ranked as five grades which are shown in Table1.
Most of the uncertainty methods are developed based on certain mathematical models which describe the uncer-tainty effects of the factors on slope stability. Also, the analytical hierarchy process (AHP) (Saaty1980) is utilized in some methods to give comprehensive evaluations of all factors related to slope stability. For example, the fuzzy methods that deal with the fuzziness are applied to give fuzzy memberships which show the degrees of one eval-uating factor belonging to the ranking grades. However, the fuzzy method is incapable of expressing the randomness in the slope data.
The concept of ‘‘cloud’’ is proposed on the basis of probability theory and fuzzy mathematics to account for the fuzziness and randomness simultaneously (Li et al. 1998a). The cloud model portrays the randomness and fuzziness as well as their relationships in linguistic terms (Li et al. 1998b). The cloud model synthesizes the char-acteristics of fuzzy and probability theory and thus can generate results with fuzzy and random signification (Li et al.2009). In this study, we apply the cloud models to the evaluation of slope stability. A new analysis strategy is proposed. We first utilize the cloud models to generate cloud memberships which demonstrate the degree of each evaluated factor belonging to the five ranked grades. Also, we consider the varying contributions of different factors by introducing the weight matrix which is obtained by
expert opinions. Then we apply the AHP, like in fuzzy methods, to obtain a comprehensive evaluation of slope stability.
2 Slope Stability Ranking System
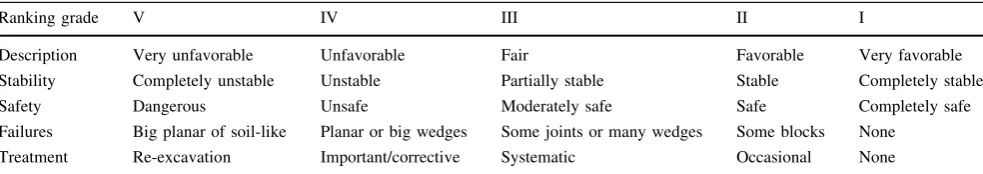
The slope is commonly ranked into five grades in stability evaluations, which is shown in Table 1 (after Romana 1985; Toma´s et al. 2007; Abbas et al. 2011) with some descriptive statements of rock slope behaviors. Based on this, the factors related to slope stability are also classified into five grades according to their value range. There are various factors that affect rock slope stability. These affections are often showing characteristics with random-ness and fuzzirandom-ness since they would change with time or circumstances and cannot be quantified easily. The impactions of the factors have been considered in many classification systems for rating rock mass quality.
A rearrangement of the characteristics of the existing rock mass classification systems (Bieniawski 1976; China tMoWRotPsRo 1995; Rodrigo and Hu¨rlimann 2008; Pantelidis 2009) leads to the following findings: (1) the factors related to the general condition of rock slopes and the condition and geometric characteristics of discontinu-ities constitute the base of the existing classifications; (2) the factors commonly adopted are related to the geometric, excavation process and supports of the rock slope; (3) the factors relevant to the environmental changes such as the precipitation and the seismic characteristics are also listed in most rating systems. In a general situation, a large number of factors could have potential influences on the stability of rock slopes due to variability and divergence of engineering backgrounds. In this study, we try to give a comprehensive but not exhaustive list of parameters in relation with the rock slope stability analysis. However, our investigation is mainly limited to rock slopes involved in hydroelectric engineering in mountainous regions.
Deformation modulus and the UCS of rock are widely used to specify the basic mechanical behaviors of rock mass and thus listed in Table2 for stability evaluation of rock slopes. Many parameters have been used to specifying the fracturing of rock mass, such as the rock quality
Table 1 Slope stability ranking and empirical description (after Romana1985; Toma´s et al.2007; Abbas et al.2011)
Ranking grade V IV III II I
Description Very unfavorable Unfavorable Fair Favorable Very favorable
Stability Completely unstable Unstable Partially stable Stable Completely stable
Safety Dangerous Unsafe Moderately safe Safe Completely safe
Failures Big planar of soil-like Planar or big wedges Some joints or many wedges Some blocks None
destination (RQD), the number of fractures per cubic meter rock (Jv), the integrity index (Kv), the cracking coefficient and the average spacing of joints (dp). And there are some empirical relations for connecting these parameters. But such relations are generally qualitative and there are no theoretical demonstrations. Moreover, each of the param-eters has certain limitations in specifying the failure of rock
mass (China tMoWRotPsRo 1995). For example,Kv can-not exactly quantify the joint number; Jv and dp cannot account for the bonding degree and in particular the opening degree as well as the filled material features of joints. Based on these, we adopt RQD,JvandKvas the key parameters for the stability evaluation of rock slope in Table2.
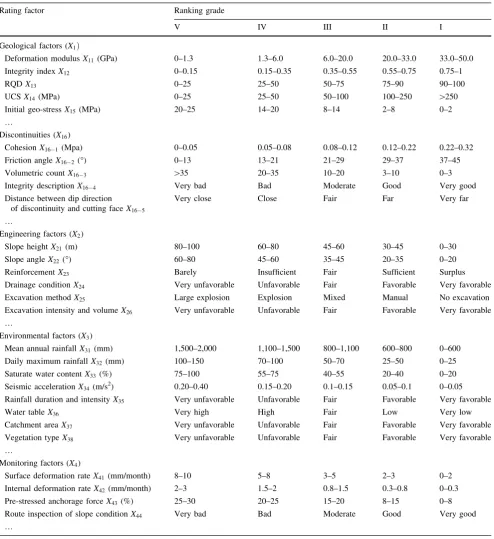
Table 2 Classification of evaluating factors [after (Bieniawski1976; China tMoWRotPsRo1995; Liu and Chen2007; Xu et al.2011)]
Rating factor Ranking grade
V IV III II I
Geological factors (X1Þ
Deformation modulusX11(GPa) 0–1.3 1.3–6.0 6.0–20.0 20.0–33.0 33.0–50.0
Integrity indexX12 0–0.15 0.15–0.35 0.35–0.55 0.55–0.75 0.75–1
RQDX13 0–25 25–50 50–75 75–90 90–100
UCSX14(MPa) 0–25 25–50 50–100 100–250 [250
Initial geo-stressX15(MPa) 20–25 14–20 8–14 2–8 0–2
…
Discontinuities (X16)
CohesionX161(Mpa) 0–0.05 0.05–0.08 0.08–0.12 0.12–0.22 0.22–0.32
Friction angleX162() 0–13 13–21 21–29 29–37 37–45
Volumetric countX163 [35 20–35 10–20 3–10 0–3
Integrity descriptionX164 Very bad Bad Moderate Good Very good
Distance between dip direction of discontinuity and cutting faceX165
Very close Close Fair Far Very far
…
Engineering factors (X2)
Slope heightX21(m) 80–100 60–80 45–60 30–45 0–30
Slope angleX22() 60–80 45–60 35–45 20–35 0–20
ReinforcementX23 Barely Insufficient Fair Sufficient Surplus
Drainage conditionX24 Very unfavorable Unfavorable Fair Favorable Very favorable
Excavation methodX25 Large explosion Explosion Mixed Manual No excavation
Excavation intensity and volumeX26 Very unfavorable Unfavorable Fair Favorable Very favorable
…
Environmental factors (X3)
Mean annual rainfallX31(mm) 1,500–2,000 1,100–1,500 800–1,100 600–800 0–600
Daily maximum rainfallX32(mm) 100–150 70–100 50–70 25–50 0–25
Saturate water contentX33(%) 75–100 55–75 40–55 20–40 0–20
Seismic accelerationX34(m/s2) 0.20–0.40 0.15–0.20 0.1–0.15 0.05–0.1 0–0.05
Rainfall duration and intensityX35 Very unfavorable Unfavorable Fair Favorable Very favorable
Water tableX36 Very high High Fair Low Very low
Catchment areaX37 Very unfavorable Unfavorable Fair Favorable Very favorable
Vegetation typeX38 Very unfavorable Unfavorable Fair Favorable Very favorable
…
Monitoring factors (X4)
Surface deformation rateX41(mm/month) 8–10 5–8 3–5 2–3 0–2
Internal deformation rateX42(mm/month) 2–3 1.5–2 0.8–1.5 0.3–0.8 0–0.3
Pre-stressed anchorage forceX43(%) 25–30 20–25 15–20 8–15 0–8
Route inspection of slope conditionX44 Very bad Bad Moderate Good Very good
Discontinuity is another critical factor affecting stability of rock slopes and it is included in many rock mass rating systems (Bieniawski 1979; Hoek and Bray 1981, 1991; China tMoWRotPsRo 1995). Such parameters like the cohesion and the friction angle of filling material, the volumetric discontinuity count, the difference between dip directions of discontinuities and dip directions of cutting faces, etc., are often used to specify the effects of discon-tinuities on slope stability. In this study, due to limited data availability, we only listed some representative parameters in Table2.
Water infiltration is another important factor affecting the stability of slopes. Especially for the natural slope or open pit mine slope, their failure is frequently induced by rainfalls. The effects of precipitation on the stability of rock slopes are directly undertaken by the water infiltration. The water table is often very low during the construction stage before water-impoundment and run-ning of the reservoir for the high steep rock slope (e.g., the case slope is more than 500 m) of hydropower sta-tions in steep mountainous areas. Thus, the water table is not included in Table2. Due to difficulty in obtaining reliable pore water pressure during the construction of rock slopes, we adopt the precipitation factor in Table2 to specify the effects of rainfalls. Also, the parameters related to rainfall duration, rainfall intensity, catchment area and vegetation type, could also have an influence on rock slope stability.
Another important factor contributing to the stability of slope is the reinforcement and treatment measures as well as other engineering activities such as drainage passage, excavation method, excavation intensity and volume. These parameters are also widely included in the stability evaluation of engineering rock slopes.
Besides, the monitored physical variables (like the displacement) are also considered in this study since nowadays most complicated slopes are installed with in situ monitoring instruments to guarantee the safety. Hence we consider four categories of factors: (a) the geological category; (b) the engineering category; (c) the environmental category and (d) the monitoring category. The factors counted in each category in this study are as follows.
(a) The geological category: (1) deformation modulus
X11; (2) intactness index of rock massX12; (3) rock quality designation (RQD)X13; (4) uniaxial compres-sive strength (UCS)X14; (5) initial in situ stressesX15; (vi) condition of discontinuities X16.
(b) The engineering category: (1) slope height X21; (2) slope angleX22; (3) reinforcementsX23; (4) drainage condition X24; (5) excavation method X25; (vi) excavation intensity and volumeX26.
(c) The environmental category: (1) mean annual precip-itation X31; (2) daily maximum rainfall X32; (3) saturated water content of slope X33; (4) seismic acceleration X34; (5) rainfall duration and intensity
X35; (6) water table X36; (7) catchment area X37; (8) vegetation typeX38.
(d) The monitoring category: (1) surface deformation rate
X41; (2) internal deformation rateX42; (3) Pre-stressed anchorage force X43; (4) route inspection of slope conditionX44.
The factor ‘‘intactness index’’ in the geological category (also known as velocity index of rock mass) is the degree of intactness of the rock mass. It is calculated as
X12 ¼Kv ¼ ðVpm=VptÞ2 ð1Þ
where Vpm is the velocity of elastic P-wave in the rock mass;Vptis the velocity of elastic P-wave in rock sampling of the corresponding rock mass. If discontinuities develop in the rock mass, then Vpm is smaller than Vpt. The more and wider the discontinuities are, the smaller Vpm is than
Vpt. Thus, this factor can be recognized as an evaluation related to discontinuities in the rock mass.
The parameter ‘‘volumetric count’’ is used to evaluate rock mass integrity and calculated as
Jv¼S1þS2þ þSnþSk ð2Þ
whereJvis number of joints per cubic meter;Snis number
of the nth group of joints counted in the length of one meter; Sk is number of ungrouped joints per cubic meter.
This parameter is also a quantitative way to evaluate the discontinuities in the rock mass.
3 Comprehensive Evaluation Strategy
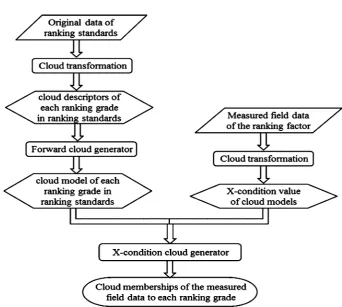
The comprehensive evaluation of slope stability is per-formed on the basis of cloud membership results which are produced by the cloud models and cloud generators. The process of production of cloud memberships are shown in Fig.1.
3.1 Cloud Models and Cloud Generators
Cloud model is defined as the uncertain transformation model between the qualitative concept expressed by lin-guistic terms and the corresponding quantitative represen-tation expressed by three numerical descriptors (Li and Du 2007). The normal cloud model is fundamental in cloud theory. The normal cloud model is quite different from a normal distribution and the universality of normal cloud has been proved theoretically. The normal cloud model conveys the numerical features of the qualitative concept with a group of independent parameters to represent the uncertainties.
LetU be the universe of discourse expressed by quan-titative digits, andC be a qualitative concept inU. If the definite parameterx2Uis a random occurrence inC, and the certaintylðxÞ[[0, 1] ofxtoCis the random number
with steady tendency, i.e.
lð Þ !x ½0;1 8x2Ux!lðxÞ ð3Þ
Then, the distribution ofxinUis defined as a cloud, and eachðx;lð Þx Þis named as a cloud drop.
Particularly, if xN Ex;E 02 n
, E0nN En;He2
and the certaintylð Þx [[0, 1] satisfies
lð Þ ¼x e ðxExÞ2
2ð ÞE0n 2
ð4Þ
Then, the distribution of xinU is defined as a normal cloud.
The models used in this study are normal cloud models. The parameters (the numerical descriptors) of cloud model are the expectation Ex, the entropy En and the
hyper-entropyHe(Liu et al.2013). There are bell-shaped cloud as well as the half bell-sharp cloud and trapezium-sharp cloud which are called the half cloud and trapezoidal clouds, respectively.
Cloud models are implemented by cloud generators. As shown in Fig.2, there are two basic cloud generators: the forward and the backward cloud generators. The forward cloud generator CG is used to generate the cloud drops
Pðxi;liÞði¼1;2; nÞ given the cloud descriptors NðEx;En;HeÞ, which is the transformation from the
quali-tative knowledge to its quantiquali-tative representation. And the backward generator CG1 is the transformation to derive the qualitative concept represented by three descriptors of cloud drops P xð i;liÞði¼1;2; nÞ. Combinations of the
two cloud generators can be used alternately to produce various kinds of cloud models which can bridge the gap
between the qualitative concept and the quantitative knowledge (Li et al. 2009). Obviously, approximations should be made if only a few cloud drops are available for backward cloud generators. The more plentiful the cloud drops are, the more accurate the numerical descriptors ðEx;En;HeÞwill be.
As it is shown in Fig.2, the cloud drops dropðx0;liÞcan
be generated by theXcondition cloud generator given three numerical descriptors ðEx;En;HeÞ and a specific x¼x0. Also, the cloud drops ðxi;liÞ can be generated by the Y
condition cloud generator given three numerical descrip-torsðEx;En;HeÞand a specificy¼li. Cloud generators are
fundamental for uncertainty reasoning with cloud models. Combinations ofX condition and Y condition cloud gen-erators can be structured to obtain the reasoning generator for the rules like ‘‘If A Then B’’. In this study, we utilize the forward cloud generators and X condition cloud gen-erators to produce cloud memberships as shown in Fig.2a, b.
3.2 Cloud Transformation
As it is stated in Fig.2, we need to implement cloud transformations before implementing cloud generators. Cloud transformation is the process which transforms data from the original data space to cloud model space, i.e., transferring the natural data into a form that can be accepted by the cloud generators. This process can be called ‘‘cloudification’’ in the similar way as fuzzification in fuzzy theory. There are different methods to implement cloud transformation. One possible way is as follows.
Assuming that non-negative data in the universe of discourse U after normalization can be denoted as
C1;C2;. . .;Cn
f g ¼ ½0;a1;ða1;a2;. . .;ðan1;1, the cloud
transformations can be implemented by the following equations.
Data normalization, which is applied to remove the influence of units in different types of data, should be implemented before cloud transformation using Eq. (3) or (4). If the larger of a factor value the more favorable of the factor, data normalization can be implemented as
x0ij¼ xijximin
ximaxximin
: ð6Þ
Otherwise, if the less of a factor value the more favorable of the factor effect, data normalization is implemented as
x0ij¼ ximaxxij
ximaxximin
: ð7Þ
In the above expression, x0ij is the normalized data of a factor;xij is the original data of this factor;ximax andximin are the maximum value and the minimum value of the factor, respectively.
After data normalization, the factor values are trans-ferred in the interval [0, 1] for the quantitative data. For the qualitative data, i.e., the descriptive factors, we assume that each rank of description has the same weight. Hence the values of each rank can be normalized in the form of sub-intervals in [0, 1]. The five ranking grades (V, IV, III, II, I) of the qualitative factors are thus quantitatively expressed by five data intervals [0.0, 0.2), [0.2, 0.4), [0.4, 0.6), [0.6, 0.8), [0.8, 1.0], respectively. And the ranking grades of quantitative factors are normalized as varying subintervals in [0, 1] according to their ranking values in Table 2.
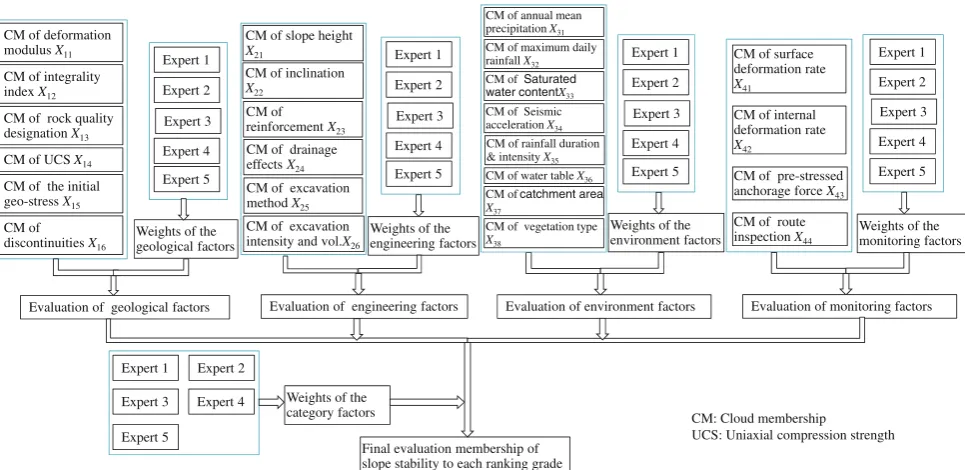
3.3 Comprehensive Evaluation
Rock slope stability is affected by many factors. The cloud memberships of a factor can only represent the effect of one unique factor. However, slope stability evaluation needs to take into account the effects of all the related factors. Hence comprehensive evaluation should be pro-posed. Moreover, different factors have varying contribu-tions to accounting for slope performance; this should also be considered in slope stability evaluation. The varying contributions of factors can be quantified by factor weights. As shown in Fig.3, the weights of the factors are synthe-sized in the evaluation, which are obtained by inquiring experts who have been engaged in the evaluated slope. The implementation of the strategy of comprehensive evalua-tion is given in Fig.3.
4 Stability Evaluation of Left Abutment Slope of Jinping 1 Hydropower Station
4.1 Slope Data Collection
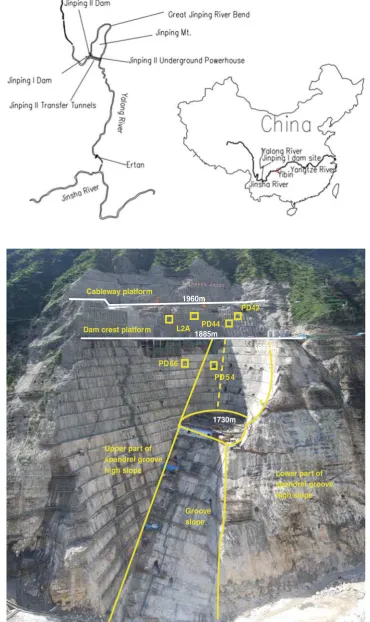
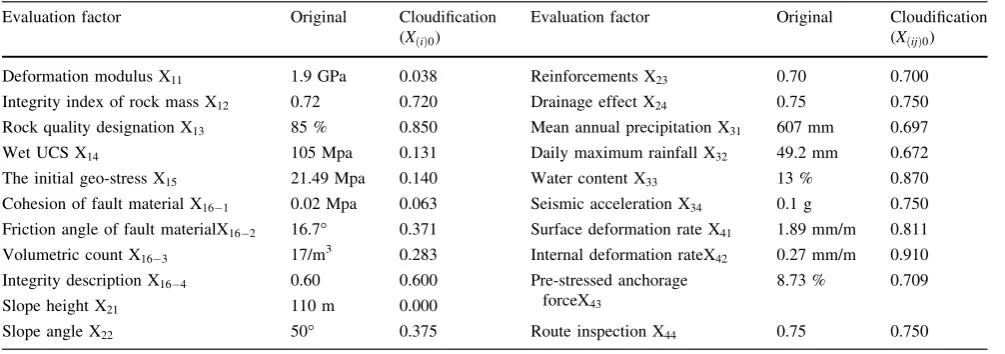
The Jinping 1 Hydropower Station is the critical hydro-electric project in the midstream and downstream of Yalong River. It is located at the east part of Qinghai-Tibet plateau in Yanyuan and Muli District of Liangshan State, Sichuan Province, China, as shown in Fig.4. This region is of complex topographical and geological con-ditions formed by the coupled effects of continuous uplifting of Qinghai-Tibet plateau and rapidly sapping of the steep valleys. The 305 m water retaining structure of the project is currently the top highest arch dam of double curvatures worldwide. The left abutment slope in the dam area is a reverse slope over 800 m high and presents the interphase micro-geomorphology of the ridge and the super fissure. The lower part under height 1,820–1,900 m of the slope is formed by marble with the slope ratio between 55 and 70; the upper part is of sandy slate with slope ratio between 40 and 50. There are faults, joints and disturbed belts extruded between rock layers growing intensively in the rock mass of left bank slope (Song et al.2009). An overview of the slope is given in Fig.5.
Most faults are in the direction NE–NNE and of large scale in the left abutment slope. The azimuth situates mostly in N30–50E, SE\60–80 for the faults with a crush width between 1 and 3 m, such as the faultsf5,f8,f2 and the spot dike (X). Faults in the direction NEE–EW
develop secondly, represented by f429 with attitude EW, S\40–60. Joints are principally developing into three categories: (1) N15–35E, NW\30–45, mainly fractures in the bedding plane; (2) SN–N30E, SE\60–80; (3) N50–70E, SE\50–80, mostly rigid structure planes. The assembly of those joints would lead to potential unstable blocks.
Substantial investigations have been undertaken on this rock slope to identify its geotechnical and mechanical behaviors (Qi et al. 2004; Zhang et al. 2009; Liu et al. 2010; Jin 2011); a number of evaluation factors are sum-marized in Table 3. As indicated in Fig.5, most part of the slope surface is strengthen by shotcrete and rock bolt or pre-stressed cables and designed with drainage passages. Thus, the rainfall infiltration is thought to have limited influence on the global stability of this slope due to these measures. Another point, the pore water pressure data are not reliable for this slope due to damage of slope con-struction activities and thus it is not taken into account in this study. Also, many other factors in Table 2 are not available for this slope and thus not included in Table3. This does not affect the implementation of the cloud model-based evaluation strategy.
4.2 Cloud Memberships
Both the ranking and the collected factor data need to be transformed before implementation of evaluation. The ranking data are transformed by Eq. (3) while the collected factor data are transformed by Eq. (4) or (5). The results are shown in Tables3and4.
CM of integrality index X12
CM of deformation modulus X11
CM of rock quality designation X13
CM of UCS X14
CM of the initial geo-stress X15
CM of discontinuities X16
Expert 1
Expert 2
Expert 3
Expert 5 Expert 4
Weights of the geological factors
Evaluation of geological factors Evaluation of engineering factors Expert 1
Expert 2
Expert 3
Expert 5 Expert 4
Weights of the engineering factors
Evaluation of environment factors Expert 1
Expert 2
Expert 3
Expert 5 Expert 4
Weights of the environment factors
CM of internal deformation rate
X42
CM of surface deformation rate
X41
CM of pre-stressed anchorage forceX43
CM of route inspection X44
Evaluation of monitoring factors Expert 1
Expert 2
Expert 3
Expert 5 Expert 4
Weights of the monitoring factors
Expert 1 Expert 2
Expert 3
Expert 5
Expert 4 Weights of the category factors
Final evaluation membership of slope stability to each ranking grade
CM: Cloud membership
UCS: Uniaxial compression strength CM of inclination
X22
CM of slope height
X21
CM of reinforcement X23
CM of drainage effects X24
CM of excavation method X25
CM of excavation intensity and vol.X26
CM of maximum daily rainfall X32 CM of annual mean precipitation X31
CM of Saturated water contentX33 CM of Seismic acceleration X34
CM of water tableX36 CM of rainfall duration & intensity X35
CM of catchment area X37
CM of vegetation type
X38
Fig. 4 Location of Jinping 1 Hydropower station
PD42
PD44
PD54 L2A
PD 66
1730m
1885m 1960m
Dam crest platform Cableway platform
Upper part of spandrel groove
high slope Lower part of
spandrel groove high slope
Groove slope
1885m Fig. 5 Overview of the left
To this end, the cloud memberships can be calculated as stated in Fig.1. The cloud memberships of the mean annual precipitation X31 are calculated in detail hereby as an example. The cloud memberships of the other factors can be computed in the similar way and the results are given in Table4.
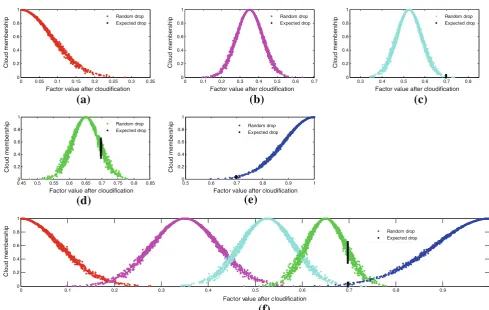
According to the numerical descriptors ofX31 given in Table4, the cloud model graphs of factor X31 can be generated as shown in Fig.6by forward cloud generators. The subfigures (a), (b), (c), (d) and (e) represent the con-cept of ranking grades V, VI, III, II and I, respectively. The mean annual precipitationX31 is 607 mm and 0.697 after cloud transformation as given in Table3. Hence the X
condition cloud generator is applied here to produce cloud memberships in each ranking withx0¼0:697. The results are also shown in Fig.6.
As it is shown in Fig.6, no expected drops can be shown for ranking grade V and IV whenx0¼0:697 since such as value is out of their counting ranges which depend on the numerical descriptors given in Table4. However, due to randomness of cloud models, there may be several cloud drops generated, but they have few effects on the final evaluation. For each of the ranking grades III, II and I, there are some expected drops (in black) shown in Fig.6. The expected drops in Fig.6d are much more than those in Fig.6c, e. But only one membership value should be used. Hence two ways are proposed to determine the final cloud membership in each ranking grade: l¼AverageðliÞ or
l¼MaximumðliÞ. The former way is adopted in this
study. Thus, the cloud membership vector of X31 is cal-culated originally as U¼ ð0:0000;0:0000;0:0138; 0:5277;0:167Þ. After normalization, the memberships can be obtained asUVðX31Þ ¼0; UIIðX31Þ ¼0:745;UIðX31Þ ¼ 0:236.
The cloud graphs of all the other factors can be gener-ated in the same way as that of the factorX31 according to the cloudification values in Table3 and the CD values in Table4 using the cloud generators in Fig.2. We list the cloud membership values of all these factors in Table4, but not in the form of cloud graphs for the reason of simplicity.
4.3 Evaluation Results
Due to complex geological conditions and insufficient discovery in pre-construction stage, the case slope is designed with a moderate complete system to detect and monitor the deformation and other specifications to guide the construction of this slope as well as to safeguard the safety of this slope. The weight matrix was obtained based on the evaluations of experts from various institutions and universities in China such as HydroChina, Chengdu Engineering Corporation (CHIDI), Yalong River Hydro-power Development Company LTD, Institute of Geology and Geophysics of Chinese Academy of Sciences, which were involved in the consultation, design, construction and (or) research programs related to this slope. Some of the evaluations are obtained by formal inquiries; some are by face-to-face talk. We make a simple average of five evaluations as the final weight matrix (Table 5). Gener-ally, the experts involved in geological investigations of this slope recommended higher weights for geological conditions, while those involved in its construction sug-gested higher weights for engineering and monitoring factors.
Due to multi-hierarchies of the rating factors in Fig.3, evaluations should be performed first for four categories of factors and then for the final comprehensive ranking grade.
Table 3 Original data and cloud transformed values of evaluation factors
Evaluation factor Original Cloudification
(XðiÞ0)
Evaluation factor Original Cloudification
(XðijÞ0)
Deformation modulus X11 1.9 GPa 0.038 Reinforcements X23 0.70 0.700
Integrity index of rock mass X12 0.72 0.720 Drainage effect X24 0.75 0.750
Rock quality designation X13 85 % 0.850 Mean annual precipitation X31 607 mm 0.697
Wet UCS X14 105 Mpa 0.131 Daily maximum rainfall X32 49.2 mm 0.672
The initial geo-stress X15 21.49 Mpa 0.140 Water content X33 13 % 0.870
Cohesion of fault material X161 0.02 Mpa 0.063 Seismic acceleration X34 0.1 g 0.750
Friction angle of fault materialX162 16.7 0.371 Surface deformation rate X41 1.89 mm/m 0.811
Volumetric count X163 17/m3 0.283 Internal deformation rateX42 0.27 mm/m 0.910
Integrity description X164 0.60 0.600 Pre-stressed anchorage
forceX43
8.73 % 0.709
Slope height X21 110 m 0.000
Table 4 Cloud descriptors of ranking data and calculated cloud memberships
Factor V IV III II I
CD CM CD CM CD CM CD CM CD CM
X11 (0,0.009,0.003) 0.027 (0.073,0.02, 0.003) 0.973 (0.260,0.082,0.003) 0.000 (0.530, 0.136, 0.003) 0.000 (1,0.266,0.003) 0.000
X12 (0,0.050,0.003) 0.018 (0.250,0.058,0.003) 0.954 (0.450,0.121,0.003) 0.028 (0.650,0.156,0.003) 0.000 (1,0.255,0.003) 0.000
X13 (0,0.083,0.003) 0.000 (0.375,0.083,0.003) 0.000 (0.625,0.167,0.003) 0.000 (0.825,0.192,0.003) 0.107 (1,0.238,0.003) 0.893
X14 (0,0.010,0.003) 0.000 (0.047,0.010,0.003) 0.000 (0.094,0.026,0.003) 0.003 (0.219,0.060,0.003) 0.475 (1,0.303,0.003) 0.522
X15 (0,0.067,0.003) 0.000 (0.320,0.073,0.003) 0.000 (0.560,0.150,0.003) 0.000 (0.800,0.192,0.003) 0.027 (1,0.238,0.003) 0.973
X16 (0,0.080,0.003) 0.782 (0.320,0.073,0.003) 0.218 (0.560,0.080,0.003) 0.000 (0.800,0.080,0.003) 0.000 (1,0.067,0.003) 0.000
X21 (0,0.067,0.003) 1.000 (0.300,0.067,0.003) 0.000 (0.475,0.125,0.003) 0.000 (0.625,0.146,0.003) 0.000 (1,0.260,0.003) 0.000
X22 (0,0.083,0.003) 0.915 (0.344,0.073,0.003) 0.085 (0.500,0.130,0.003) 0.000 (0.656,0.154,0.003) 0.000 (1,0.257,0.003) 0.000
X23 (0,0.067,0.003) 0.000 (0.300,0.067,0.003) 0.000 (0.500,0.133,0.003) 0.035 (0.700,0.167,0.003) 0.930 (1,0.250,0.003) 0.035
X24 (0,0.067,0.003) 0.000 (0.300,0.067,0.003) 0.000 (0.500,0.133,0.003) 0.003 (0.700,0.167,0.003) 0.932 (1,0.250,0.003) 0.065
X31 (0,0.083,0.003) 0.000 (0.350,0.075,0.003) 0.000 (0.525,0.138,0.003) 0.019 (0.650,0.148,0.003) 0.745 (1,0.259,0.003) 0.236
X32 (0,0.111,0.003) 0.000 (0.433,0.089,0.003) 0.026 (0.600,0.156,0.003) 0.396 (0.750,0.172,0.003) 0.550 (1,0.247,0.003) 0.028
X33 (0,0.083,0.003) 0.000 (0.350,0.075,0.003) 0.000 (0.525,0.138,0.003) 0.001 (0.700,0.165,0.003) 0.025 (1,0.251,0.003) 0.974
X34 (0,0.167,0.003) 0.000 (0.563,0.104,0.003) 0.077 (0.688,0.177,0.003) 0.431 (0.813,0.182,0.003) 0.458 (1,0.242,0.003) 0.034
X41 (0,0.067,0.003) 0.000 (0.350,0.083,0.003) 0.000 (0.600,0.158,0.003) 0.035 (0.750,0.171,0.003) 0.391 (1,0.248,0.003) 0.574
X42 (0,0.111,0.003) 0.000 (0.417,0.083,0.003) 0.000 (0.617,0.164,0.003) 0.029 (0.817,190,0.003) 0.426 (1,0.238,0.003) 0.545
X43 (0,0.056,0.003) 0.000 (0.250,0.056,0.003) 0.000 (0.417,0.111,0.003) 0.002 (0.617,0.150,0.003) 0.823 (1,0.258,0.003) 0.175
X44 (0,0.067,0.003) 0.000 (0.300,0.067,0.003) 0.000 (0.500,0.133,0.003) 0.016 (0.700,0.167,0.003) 0.616 (1,0.250,0.003) 0.368
CDcould descriptor,CMcould membership
Z.
Liu
Taking account the weight matrix, we obtain the evalua-tions of the four categories:
RX ¼
0:281 0:191 0:005 0:105 0:418 0:407 0:029 0:011 0:525 0:028 0:000 0:024 0:200 0:443 0:333 0:000 0:000 0:021 0:561 0:418
2
Hence the comprehensive evaluation result can be calculated as:
BX ¼AXRX ¼ ½0:185 0:073 0:053 0:380 0:309
ð9Þ
The elements in vector BX represent the degree of the
ranked slope in each ranking grade. The bigger the element value is, the more likely the slope is in the corresponding ranking grade.
The maximum element of BX in Eq. (7) is 0.380 of
ranking grade II with a small difference of 0.072 to grade I. The membership values of the other three grades are much smaller than those of grades II and I. If a maximum membership method is applied, the final evaluation is addressed to be grade II (stable) for this rock slope. In this case, however, some information would be omitted. In the final evaluation result BX, the
element of ranking grade II and I is 0.380 and 0.309, respectively; and that of the ranking grades V, IV and III add up to 0.311. The membership values indicate the possibilities of the slope stability in the corresponding ranking grade. Hence, we conclude that the stability status of the slope is between grade II and grade I, prone to II. This result is more practical than that of the maximum membership method for the purpose of slope reinforcement and treatments.
Factor value after cloudification
Cloud membership
Factor value after cloudification
Cloud membership
Factor value after cloudification
Cloud membership
Factor value after cloudification
Cloud membership
Factor value after cloudification
Cloud membership
Factor value after cloudification
Cloud membership
Expected drop Random dropExpected drop
Random drop
Notes: Figure(a) represents the quality level V of with CG (0, 0.08333,0.003); Figure(b) represents the quality level IV of with CG (0.35, 0.075, 0.003; Figure (c) represents the quality level III of with CG (0.525, 0.138, 0.003); Figure(d) represents the quality level II of with CG (0.650, 0.148, 0.003); Figure (e) represents the level I of with CG(1, 0.259, 0.003). Figure (f) is the comprehension of all the levels of . All these figures are generated under the same condition and the cloud descriptor (CD) values in Table 4.
Fig. 6 Cloud models of each ranking grade of the factorX31and cloud memberships withXð31Þ0¼0:697
Table 5 Weight matrix for evaluation
Ranking object Assembly weight
Factor category AX=(0.321,0.232,0.221,0.226)
Geological factors AX1 =(0.155,0.158,0.171,0.173,0.180,0.163)
Engineering factors AX2 =(0.207,0.229,0.288,0.276)
Environment factors AX3 =(0.266,0.240,0.263,0.231)
4.4 Validation and Discussion
One study of this slope carried out by the finite difference method (Hydro-China 2008) showed that the stability of the slope would be significantly improved by appropriate slope reinforcement and treatment measures. And due to grout replacement, the weak planes would not be the controlling factors to trigger potential slope failures. They concluded that the stability of this slope would be lying in class I in normal situations and class II in seismic condition with earthquake intensity\M8.0. Their conclusions are in
good agreement with the results presented in this study. Moreover, field monitoring and manual inspection have all proved that this slope is under good stability situation.
Stability features of this slope have also been studied from the view of monitoring behaviors (Zhang et al.2009). They investigated the deformation trend and its spatial distribution as well as the relationship between the defor-mation and the stability. They concluded that the exca-vating activities influenced the deformation of the slope with a very high depth (more than 80 m deep in the slope). The stress releasing process of the slope would continue and not come to be completely stable in a short time. In all, their study showed that this slope would be in a good global stability status with some local stability problems. These local stability problems would be probably caused by the influence of stress releasing of the rock mass as a result of the excavation activities. This is consistent with the result of this study.
Further, the extension method has also been applied for comprehensive stability evaluation of this rock slope (Tan et al.2009). The extension method is developed from the extenics which is aimed at approaching contradictory problems in the science and engineering (Cai et al.2003, 2013). In the application of extension method, slope sta-bility evaluation is considered as a decision-making prob-lem with many factors which are related to stability of slopes to be counted in a reasonable manner. The extension method provides the manner by which to incorporate the factors. The results showed that the safety status of the left abutment slope of Jinping 1 Hydropower Station was ranked in grade II prone to grade I. This result also accords with that of this study.
We can also observe some interesting findings from the cloud membership values of the four rows inRX:The first
row denotes the effects of geological factors, and the other three rows denote the effects of engineering factors, envi-ronmental factors and monitoring factors, respectively. The values of memberships in the first row indicate that the ranking of geological factors is most likely in grade I with moderate possibility in grade V and IV. This result is caused by the divergence of evaluating results of single factors.
The second row indicates that the ranked engineering factors have large divergent evaluating results. This result is caused by super slope height and sufficient slope treat-ments. The membership values show that the slope rein-forcements and treatments have greatly improved the situation of the slope. The membership values in the third row show this slope is under favorable environmental sit-uations. And the memberships of the monitoring factors show that this slope is under good situation of stability.
Therefore, according to the evaluation results in Eq. (8), the most unfavorable factors of the rock slope are the geo-logical factors and engineering factors. Among the geolog-ical factors, the behaviors of the discontinuity material are most unfavorable and thus most important for the stability of the slope. Among the engineering factors, the slope height and slope angle appear as the most unfavorable factors to the stability of slope. Fortunately, thanks to the reinforcement measures, the stability of the slope is greatly improved and consequently situated in a favorable grade.
5 Concluding Remarks
This study investigates the potential capability of the cloud model-based approach for comprehensive stability evalu-ation of rock slopes. The evaluated results using this approach provide both fuzzy and probabilistic significance. The comprehensive evaluating results depend on the ranking standards and slope conditions. Also, experts’ opinions can be quantitatively included in this strategy, which is particularly important in geotechnical engineer-ing. The results show that the proposed strategy is feasible and practical for comprehensive evaluation of rock slope stability.
The most unfavorable factors to the stability of the rock slope are the behaviors of the discontinuity material, the slope height and slope angle. Fortunately, thanks to the reinforcement measures, the stability of the slope is greatly improved and consequently situated in a favorable condition.
Nevertheless, it must be convinced that the factors adopted for rock slope stability evaluation would be probably different due to data availability and slope con-ditions. The ranking grade standards would consequently change accordingly for different slopes in other areas with varying conditions. And the weight matrix of the factors would be varying if different experts could have been consulted.
Acknowledgments Authors thank the anonymous reviewers for
Shaohui Duan in Yalong River Hydropower Development Company, Ltd., for providing us substantial data of the case slope in this study.
References
Abbas D, Ataeib M, Sereshki F (2011) Assessment of rock slope stability using the fuzzy slope mass rating (FSMR) system. Appl Soft Comput 11(8):4465–4473
Aksoy H, Ercanoglu M (2007) Fuzzified kinematic analysis of discontinuity-controlled rock slope instabilities. Eng Geol 89(3–4):206–219
Cai W et al (2013) Extenics.http://web.gdut.edu.cn/*extenics/i.htm
Alejano LR, Ferrero AM, Ramı´rez-Oyanguren P, A´ lvarez Ferna´ndez
MI (2011) Comparison of limit-equilibrium, numerical and physical models of wall slope stability. Int J Rock Mech Min 48(1):16–26
Aydan O¨ , Shimizu Y, Ichikawa Y (1989) The effective failure modes
and stability of slopes in rock mass with two discontinuity sets. Rock Mech Rock Eng 22(3):163–188
Bieniawski ZT (1976) Rock mass classification in rock engineering. In: The symposium on explorer for rock engineering, Johannes-burg, pp 97–106
Bieniawski ZT (1979) The geomechanics classification in rock engineering applications. In: Proceedings of the 4th international congress on rock mechanics, pp 41–48
Bye A, Bell F (2001) Stability assessment and slope design at Sandsloot open pit, South Africa. Int J Rock Mech Min 38(3):449–466
Cai W, Yang C, Lin W (2003) Extension engineering methods. China Science Press, China
China tMoWRotPsRo (1995) Standard for engineering classification of rock masses (GB50218-94). In: Standard Institute of the Ministry of Construction of the Peoples’s Republic of China, Beijing Duzgun HS, Bhasin R (2009) Probabilistic stability evaluation of
Oppstadhornet rock slope, Norway. Rock Mech Rock Eng 42(5):729–749
Goodman RE (1989) Introduction to rock mechanics. Wiley, New York
Goodman RE, Shi G-H (1985) Block theory and its application to rock engineering. Prentice-Hall, NJ
Hatzor YH, Arzi AA, Zaslavsky Y, Shapira A (2004) Dynamic stability analysis of jointed rock slopes using the DDA method: King Herod’s Palace, Masada, Israel. Int J Rock Mech Min
41(5):813–832. doi:10.1016/j.ijrmms.2004.02.002
Hoek E, Bray JW (1981) Rock slope engineering. Institute of Mining and Metallurgy, London
Hoek E, Bray JW (1991) Rock slope engineering. Elsevier Science Publishing, New York
Hydro-China CEC (2008) Special research report on left bank slope stability analysis of Jinping 1 hydropower station in Yalong river. Hydro-China Chengdu Engineering Corporation, Chengdu (in Chinese)
Jeongi-gi U, Kulatilake PHSW (2001) Kinematic and block theory analyses for shiplock slope of the three gorges dam site in china. Geotech Geol Eng 19:21–42
Jhanwar J (2012) A classification system for the slope stability assessment of opencast coal mines in Central India. Rock Mech Rock Eng 45(4):631–637
Jimenez-Rodriguez R, Sitar N, Chaco´n J (2006) System reliability approach to rock slope stability. Int J Rock Mech Min 43(6):847–859
Jin H (2011) Research on comprehensive evaluation methods of monitoring and early-warning for rock slope. J Yangtze River Sci Res Inst 28(1):29–33 p 38
Kveldsvik V, Einstein HH, Nilsen B, Blikra LH (2009) Numerical analysis of the 650,000 m2A˚ knes rock slope based on measured displacements and geotechnical data. Rock Mech Rock Eng 42(5):689–728
Lam L, Fredlund DG (1993) A general limit equilibrium model of three-dimensional slope stability analysis. Can Geotech J 30(6):905–919
Latha GM, Garaga A (2010) Seismic stability analysis of a Himalayan rock slope. Rock Mech Rock Eng 43(6):831–843
Li X (2004) Research on time prediction for landslide hazard. Chengdu University of Technology, Chengdu (in Chinese) Li D, Du Y (2007) Artificial intelligence with uncertainty. Chapman
& Hall/CRC, Boca Raton
Li D, Cheung D, Shi X, Ng V (1998a) Uncertainty reasoning based on cloud models in controllers. Comput Math Appl 35(3):99–123 Li D, Han J, Shi X, Chung Chan M (1998b) Knowledge
represen-tation and discovery based on linguistic atoms. Knowl Based Syst 10(7):431–440
Li D, Liu C, Gan W (2009) A new cognitive model: cloud model. Int J Intell Syst 24(3):357–375
Liu Y, Chen C (2007) A new approach for application of rock mass classification on rock slope stability assessment. Eng Geol 89(1–2):129–143
Liu CH, Jaksa MB, Meyers AG (2008) Improved analytical solution for toppling stability analysis of rock slopes. Int J Rock Mech Min 45(8):1361–1372
Liu Z, Xu W, Jin H, Liu D (2010) Study on warning criterion for rock slope on left bank of Jinping No. 1 hydropower station. J Hydraul Eng 41(1):101–107 [p 112 (in Chinese)]
Liu Z, Xu W, Shao J (2012) Gaussian process based approach for application on landslide displacement analysis and prediction.
Comput Model Eng Sci 84(2):99–122. doi:10.3970/cmes.2012.
084.099
Liu Z, Shao J, Xu W, Meng Y (2013) Prediction of rock burst classification using the technique of cloud models with
attribu-tion weight. Nat Hazards 68(2):549–568. doi:
10.1007/s11069-013-0635-9
Nawari O, Hartmann R, Lackner R (1997) Stability analysis of rock slopes with the direct sliding blocks method. Int J Rock Mech Min 34(3–4):220.e221–220.e228
Pantelidis L (2009) Rock slope stability assessment through rock
mass classification systems. Int J Rock Mech Min
46(2):315–325. doi:10.1016/j.ijrmms.2008.06.003
Park H, West TR (2001) Development of a probabilistic approach for rock wedge failure. Eng Geol 59(3–4):233–251
Park H-J, West TR, Woo I (2005) Probabilistic analysis of rock slope stability and random properties of discontinuity parameters, Interstate Highway 40, Western North Carolina, USA. Eng Geol 79:230–250
Park HJ, Um J-G, Woo I, Kim JW (2012) Application of fuzzy set theory to evaluate the probability of failure in rock slopes. Eng Geol 125(1):92–101
Qi S, Wu F, Yan F, Lan H (2004) Mechanism of deep cracks in the left bank slope of Jinping first stage hydropower station. Eng Geol 73(1):129–144
Rodrigo DP, Hu¨rlimann M (2008) Geotechnical classification and characterisation of materials for stability analyses of large volcanic slopes. Eng Geol 98(1–2):1–17
Romana M (1985) New adjustment ratings for application of Bieniawski classification to slopes. In: Proceedings of the international symposium on role of rock mechanics, Zacatecas Mexico, pp 49–53
Saada Z, Maghous S, Garnier D (2012) Stability analysis of rock slopes subjected to seepage forces using the modified Hoek– Brown criterion. Int J Rock Mech Min 55:45–54
Saaty TL (1980) The analytic hierarchy process. McGraw-Hill International Book Company, New York
Song S, Xiang B, Yang J et al (2009) Stability analysis and reinforcement design of high and steep slopes with complex geology in abutment of Jinping 1 hydropower station. Chin J Rock Mech Eng 29(3):442–458 (in Chinese)
Stead D, Eberhardt E, Coggan JS (2006) Developments in the characterization of complex rock slope deformation and failure
using numerical modelling techniques. Eng Geol
83(1–3):217–235
Taheri A, Tani K (2010) Assessment of the stability of rock slopes by the slope stability rating classification system. Rock Mech Rock Eng 43(3):321–333
Tan X, Xu W, Liang G (2009) Application of extenics method to comprehensive safety evaluation of rock slope. Chin J Rock Mech Eng 28(12):2503–2509 (in Chinese)
Toma´s R, Delgado J, Sero´n JB (2007) Modification of slope mass rating (SMR) by continuous functions. Int J Rock Mech Min
44(7):1062–1069. doi:10.1016/j.ijrmms.2007.02.004
Wang C, Pan F (2004) Fuzzy matter-element model for evaluating geotechnical slope stability. Wat Res Hydro Eng 35(9):591–595 Wang C, Tannant DD, Lilly PA (2003) Numerical analysis of the stability of heavily jointed rock slopes using PFC2D. Int J Rock Mech Min 40(3):415–424
Xu F, Xu W, Liu Z, Liu K (2011) Slope stability evaluation based on PSO-PP. Chin J Geotech Eng 33(11):1708–1715 (in Chinese) Zhang J, Xu W, Jin H (2009) Safety monitoring and stability analysis