54 CHAPTER IV
RESEARCH FINDINGS AND DISCUSSIONS
In this chapter, the writer presented the data which had been collected from the research
in the field of study. The data were the result of pretest and posttest of experimental and control group, result of data analysis, and discussion.
A. The Result of Pre test Group Control and Experimental Group
1. Distribution of Pre test Scores on Control and Experimental Group
The writer describe the data of students pre test on control and experimental group.
The writer did pre test of Control Group on Monday, August 22th,2016 at 11.55-13.15 a.m with 30 students in class VIII B and did pre test of Experiment Group on Saturday August
20th,2016 at 09.55-11.55 a.m with 30 students in class VIII A. The study was assigned to write a Descriptive text about 50-100 words. To knew the description of students pre test
score, it can be seen on the table 4.1
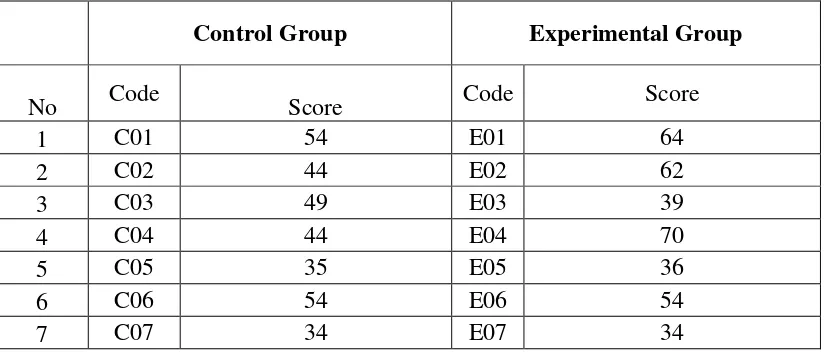
Table 4.1 The Description of Pre Test Scores of the Data Achieved by the Students in Control and Experimental Group.
Control Group Experimental Group
No Code Score Code Score
1 C01 54 E01 64
2 C02 44 E02 62
3 C03 49 E03 39
4 C04 44 E04 70
5 C05 35 E05 36
6 C06 54 E06 54
8 C08 58 E08 53
9 C09 33 E09 33
10 C10 42 E10 42
11 C11 33 E11 33
12 C12 36 E12 36
13 C13 37 E13 67
14 C14 59 E14 58
15 C15 64 E15 62
16 C16 57 E16 52
17 C17 77 E17 77
18 C18 47 E18 53
19 C19 52 E19 41
20 C20 52 E20 41
21 C21 38 E21 47
22 C22 33 E22 33
23 C23 32 E23 42
24 C24 68 E24 68
25 C25 60 E25 55
26 C26 52 E26 62
27 C27 49 E27 49
28 C28 58 E28 58
29 C29 53 E29 53
30 C30 63 E30 63
Mean 48,90 51,23
Highest 77.00 77.00
Lowest 32.00 33.00
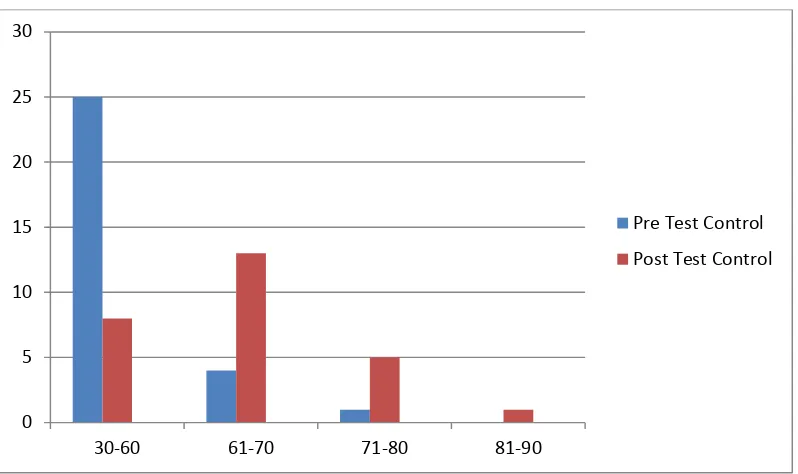
Table 4.2 Histogram of the Frequency Distribution of Pre test Score of the Control and Post test Control Group
The distribution of students’ score in pre-test and post-test of control group and can
also be seen in the following figure.
From the figure above it shows that there are twenty five students who got score 30 -60, they got less predicate. There were 4 students who got score 61-70, they got Enough
predicate. There one student who got score 71-80, they got good.
From the figure above it shows that there are eight students who got score 40 -60,
they got less predicate. There were thirteen students who got score 61-70, they got Enough predicate. There were five students who got score 71-80, they got good predicate. And there was one students who got 81-90,they got very good predicate.
0 5 10 15 20 25 30
30-60 61-70 71-80 81-90
Pre Test Control
B. The Result of Post test Group Control and Experimental Group
1. Distribution of post test Scores on Control and Experimental Group
The writer describe the data of students post test score of the experimental group. To knew the description of students pre test score, it can be seen on the table 4.3
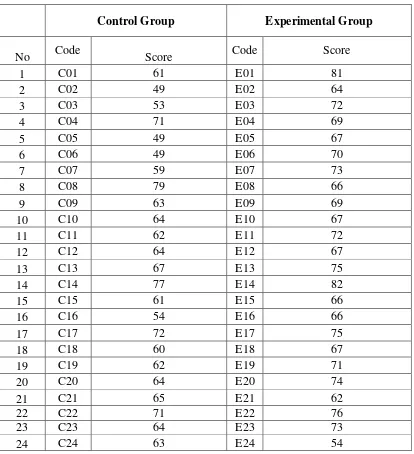
Table 4.3 The Description of Post Test Scores of the Data Achieved by the Students in Control and Experimental Group
Control Group Experimental Group
No Code Score Code Score
1 C01 61 E01 81
2 C02 49 E02 64
3 C03 53 E03 72
4 C04 71 E04 69
5 C05 49 E05 67
6 C06 49 E06 70
7 C07 59 E07 73
8 C08 79 E08 66
9 C09 63 E09 69
10 C10 64 E10 67
11 C11 62 E11 72
12 C12 64 E12 67
13 C13 67 E13 75
14 C14 77 E14 82
15 C15 61 E15 66
16 C16 54 E16 66
17 C17 72 E17 75
18 C18 60 E18 67
19 C19 62 E19 71
20 C20 64 E20 74
21 C21 65 E21 62
22 C22 71 E22 76
23 C23 64 E23 73
25 C25 63 E25 61
26 C26 71 E26 47
27 C27 62 E27 75
28 C28 81 E28 67
- E29 75
- E30 62
Mean 63.56 68.83
Highest 81 82
Lowest 49 47
Std. Deviation 8.478 7.259
Based on the data above, it can be seen that the students’ highest score was 82 and the
students’ lowest score was 47. The distribution of students’ pretest score of experiment
group can be seen in the following figure 4.4
Figure 4.4 Histogram of the Frequency Distribution of Pre test Score of the experimental Group and Post test score of Experiment
0 5 10 15 20 25
30-60 61-70 71-80 81-90
Pre Test Experiment
From the figure above it shows that there are twenty one students who got score 30 -60, they got less predicate. There were eight students who got score 61-70, they got Enough
predicate. There one student who got score 71-80, they got good.. Base on the distribution above, can be seen that there are students of experiment group who got Fail predicate before given treatment.
From the figure above it shows that there are two students who got score 40 -60, they got less predicate. There were fourteen students who got score 61-70, they got Enough
predicate. There were 12 students who got score 71-80, they got good predicate. And there were two students who got 81-90,they got very good predicate.
C. The Comparison Result Between Control and Experimental Group on The Post-Test
Based on the data analysis, it can see by comparison post-test of Control group and
Experimental group in the following table:
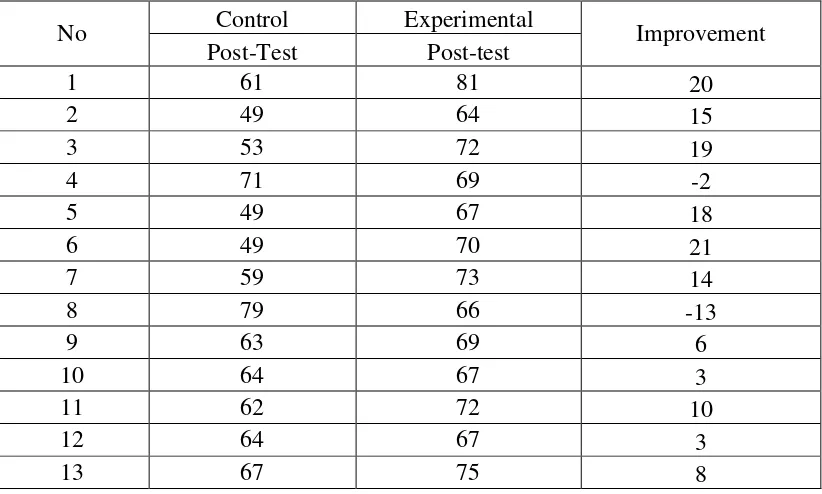
Table 4.5 The Comparison Result Between Post-test of Control and Experimental Group
No Control Experimental Improvement
Post-Test Post-test
1 61 81 20
2 49 64 15
3 53 72 19
4 71 69 -2
5 49 67 18
6 49 70 21
7 59 73 14
8 79 66 -13
9 63 69 6
10 64 67 3
11 62 72 10
12 64 67 3
14 77 82 5
15 61 66 5
16 54 66 12
17 72 75 3
18 60 67 7
19 62 71 9
20 64 74 10
21 65 62 -3
22 71 76 5
23 64 73 9
24 63 54 -9
25 63 61 -2
26 71 47 -24
27 62 75 13
28 81 67 -14
29 - 75 -
30 - 62 -
Mean 63.56 68.83
Highest 81 82
Lowest 49 47
Std
Deviation 8.478 7.259
The table above showed us the comparison of post test score achieved by control group and experimental group. Both control group and experiment group have not same score. It can be seen from the post-test control group Mean is 63.56.Then, the Mean of
post-test experimental group is 68.83. Then, for post-test of control group the highest score 81.00 and the lowest score 49.00. And then, for post-test experimental group the highest score
D. Testing of Normality and Homogeneity 1. Normality Test
The testing of normality test used SPSS 20.0 program. It is divided into two parts, testing of normality of post-test both experimental and control group.
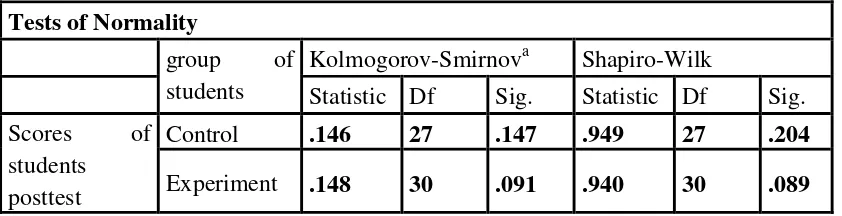
Table 4.6 Testing normality of post-test experimental and control group
Tests of Normality
group of students
Kolmogorov-Smirnova Shapiro-Wilk
Statistic Df Sig. Statistic Df Sig. Scores of
students posttest
Control .146 27 .147 .949 27 .204
Experiment .148 30 .091 .940 30 .089
The table shows the result of test normality calculation using SPSS 20.0 program. To
know the normality of data, the formula can be seen as follows: If the number of sample. > 50 = Kolmogorov-Smirnov If the number of sample. < 50 = Shapiro-Wilk
Based on the number of data the writer was 28 < 50, so to analyzed normality data the writer used Shapiro-Wilk. The next step, the writer analyzed normality of data by using
formula as follows:
If Significance > 0.05 = data is normal distribution If Significance < 0.05 = data is not normal distribution
Based on data above, significant data of experiment and control group used Shapiro-Wilk is 0.204 > 0.05 and 0. 089 > 0.05. It can be concluded that the data is normal
2. Testing Homogeneity
Testing homogeneity used SPSS 20.0 program. The result of testing homogeneity of
post-test of experimental and control group can be seen on the table 4.9.
Table 4.7 Testing Homogeneity and independent samples test of post-test of experimental and control group
Test of Homogeneity of Variances
Levene
Statistic df1 df2 Sig.
4.335 5 12 .017
The table shows the result of Homogeneity test calculation using SPSS 20.0 program. To know the Homogeneity of data, the formula can be seen as follows:
If Sig. > 0.05 = Equal variances assumed or Homogeny distribution
If Sig. < 0.05 = Equal variances not assumed or not Homogeny distribution. Based on data above, significant data is 0.668. The result is 0.668 > 0.05, it mean the t-test
calculation used at the equal variances assumed or data is Homogeny distribution E. Testing Hypothesis Using Calculation of T-Test
The last step on data analysis was testing hypothesis using calculation of T- test
used SPSS 20.0 program. 1. Manual Calculation
Standard error of mean of score between Variable I and Variable II
SEM1– SEM2 = √( ) ( )
SEM1– SEM2 = √
SEM1– SEM2 = √
SEM1– SEM2 = 2.05762
SEM1– SEM2 = 2.06
The calculation above showed the standard error of the difference mean between X1 and X2 was 2.06. Then, it inserted to the formula to get the value of tobserved as follows:
To =
To =
To =
To = 2.55339
To = 2.55
Which the criteria:
If (t-observed) ≥ t-table, Ha was accepted and H0 was rejected
If (t-observed) ≤ t-table, Ha was rejected and H0 was accepted
Then, the degree of freedom (df) accounted with the formula:
Table 4.8 The Result of T-Test Using Manual Calculation
Variable T test T table Df/db
5 % 1 %
X1-X2 2.55 2.01 2.57 56
Ha was rejected if ttable 1 % Ha was accepted if ttable 5 %
Ho was accepted ttable 1 % Hawas rejected if t table 5 %
Table 4.9 Mean, Standard Deviation and Standard Error of Experiment Group and Control Group using SPSS 20.0 Program
Group N Mean Std. Deviation Std. Error Mean
Score Experiment
Control 30 28 68.83 63.56 7.2 6 8.32 1.33 1.57
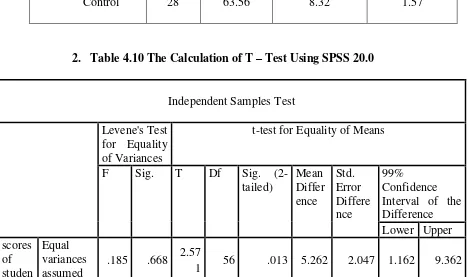
2. Table 4.10 The Calculation of T – Test Using SPSS 20.0
Independent Samples Test
Levene's Test for Equality of Variances
t-test for Equality of Means
F Sig. T Df Sig.
(2-tailed) Mean Differ ence Std. Error Differe nce 99% Confidence Interval of the Difference Lower Upper scores of studen Equal variances assumed
.185 .668 2.57
ts postte st
Equal variances not assumed
2.55 9
53.7
40 .013 5.262 2.056 1.139 9.385
To know the testing hypothesis of data used SPSS 20.0 program, the formula can be seen as follows:
H0 : If score sig. (2-tailed) > 0.05 it means H0 was accepted and H1
was rejected.
Ha : If score sig. (2-tailed) < 0.05 it means H1 was accepted and H0
was rejected.
Based on data above, significant probability (sig.2-tailed) is 0.013. The result is 0.013 < 0,05, it mean Ha was accepted and H0 is rejected. From the result of testing hypothesis
using calculation of t-test, it is shows that The students taught using Idea Listing technique gain better writing achievement than those taught using non Idea Listing technique
F. Interpretation
To examine the truth or the false of null hypothesis stating that the there is effect of idea listing technique in writing descriptive text at eighth graders of MTs An-Nur Palangka
Raya. The result of t – test was interpreted on the result of degree of freedom to get the ttable. The result of degree of freedom (df) was 56. The following table was the result of
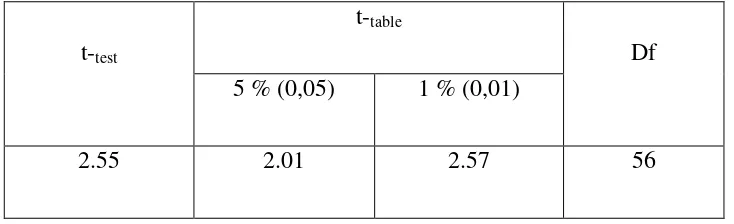
Table 4.11 The Result of T-Test Using SPSS 20.0 Program
t-test
t-table
Df 5 % (0,05) 1 % (0,01)
2.55 2.01 2.57 56
The interpretation of the result of t-test using SPSS 20.0 program, it was found the t observe was greater than the t table at 5% smallest mean ttable at 1 % significance level or
2.01<2.55<2.57 It means that Ha was accepted at 5 % and rejected at 1 % significance level
and Howas rejected at 5 % and accepted at 1 % significant level, It could be interpreted
based on the result of calculation that Ha stating that idea listing technique was
significantly effect for Teaching Writing Descriptive Text at 5 % significant level of the eight grade students at MTs AN-NUR Palangka Raya was accepted and Ho stating
idea listing technique was not effect for Teaching Writing Descriptive Text at 5 % significant level of the eight grade students at MTs AN-NUR Palangka Raya was rejected. It meant that teaching writing with idea listing gave significant effect at
5%significance level, at not significant 1 %.
G. Discussion
The students taught using Idea Listing technique gain better writing achievement than those taught using non Idea Listing technique. The students who were taught using Idea
using Idea Listing technique was 68.83 and the students who were taught without using Idea Listing technique was 63.56. Based on the result of hypothesis test calculation, it was
found that the value of significant probability (sig.2-tailed) is 0.013. The result is 0.013< 0,05, it mean H1 was accepted and H0 is rejected. From the result of testing hypothesis
using calculation of t-test, it is shows that The students taught using Idea Listing technique
gain better writing achievement than those taught using non Idea Listing technique.
The finding of the study interpreted that the alternative hypothesis stating that using Idea Listing improving student’s writing skill at the first grade of MTS AN- NUR was
accepted.
Based on the results finding of the study, it was shown that using Idea Listing improving student’gives beneficial contribution in increasing the students’ writing skill
during the instructional process. The process steps are as follows.
It suitable with the advantages of IDEA LISTING TECHNIQUE that Listing technique is good for writing as the part of prewriting process. Listing technique is good in developing students’ ideas in writing. It means that students can develop their ideas
focused on one topic. listing technique can be useful to develop ideas or create main points of writing. Student may use listing technique to facilitate discussions for generating
innovative ideas for writing. This technique helps them search for a better understanding of a topic. By eliciting diverse smaller topics and ideas on the given topic. In addition,
By listing technique, student can see the breadth of their thinking. They are likely encouraged to create or discover as many as they can. That is why it is very helpful when
we want to generate the ideas for the target topic. Then teaching learning by ILT also help students to improving writing skills at the first grade of MTS AN- NUR. Several steps of teaching using ILT can bee seen as follows.
The results supported theory by Mifftah Chaper II page 31. First, teacher leads students to a topic by showing pictures through LCD followed by some questions as
brainstorming. Then he introduces the issue or topic and tells the instructional objectives. Students are given an allotted time to respond to the question; however, when necessary, it is important that they remain flexible in taking additional time. They should be able to
complete steps one through seven within 15 to 30 minutes.
Second, teacher asks students to participate in generating ideas through ILT. To do
so, he distributes a model of an expository paragraph, asks them to sit in groups of three, and asks a group member to be facilitator to lead the process. Then he assigned them to
analyze the paragraph for focusing on the writing task of writing an expository paragraph. The use of ILT in prewriting stage enables students to get ideas because it is similar to the techniques – ways to get started – used in prewriting stage such as brainstorming,
clustering, strategic questioning, sketching, free writing, exploring the senses, interviewing, and information gathering.
students to be involved in their group activities and to follow the rules include – all ideas count even the “crazy” ones and no side conversations during the activities.
Fourth, teacher asks students to explore and share ideas of a general topic to be smaller ones or sub topics (in words and phrases), and list them on the paper as the first list.
If students begin to discuss ideas while they are still being listed, the facilitator should remain them of the ground rule that side conversations are not allowed. In addition, teacher
reminds students that the time will be up, so they might produce additional ideas. It is suggested that near completion of generating ideas, the teacher announces to students that “Approximately twominutes remain for generating ideas.” Sometimes this announcement
may produce additional ideas. After that, he asks them to read the ideas listed and discuss them for clarity and grouping in categories, and then rearrange the ideas based on the
categories. Next he asks them to choose one of the items listed in the categories to be a smaller topic to write an expository paragraph.
Fifth, students are asked to generate ideas of the sub topic that have been decided in words or phrases, and list them on the paper as the second list. It is to lead students to easily write suitable topic sentence for an expository paragraph. Any of these ideas can be
the controlling idea in their topic sentence, while some others can be supporting sentences. Teacher also reminds students that the time will be up, so they might produce additional
Sixth, teacher assigns students to write first draft in drafting stage. Drafting stage
centers on providing students chances to start writing based on a paragraph outline idea
they have made in the previous stage. Drafting is a stage designed to allow the writers to
put their ideas on paper without worrying about mechanics or neatness. This statement is in
line with asserting that drafting is the process of getting ideas on paper. In addition, points
out that drafting is viewed as an important and complex set of strategies, the mastery of
which takes time, patience and trained instruction. In this stage, students are assigned to
write rough draft as their first draft. For so doing, students are assigned to write a title and
start writing their first draft individually based on the outline they have made.
Seventh, teacher asks students to revise their first draft in revising stage. The revising
stage focuses on providing students chances to revise their first draft they have made in the
drafting stage with emphasis on the content and organization rather than on the mechanics.
Revising is to make the writing clearer and more interesting to the readers. Both drafting
and revising stages are the core of the writing process. In revising stage students rethink
and rewrite the first draft to form the second draft. To do so, teacher guides students to
revise their writing in terms of content and organization through peer revising and self
revising. To do peer revising, students are asked to make a group of three. They are
suggested to use Peer Review Checklist for Expository Paragraph taken from book, Refining Composition Skills: Rhetoric and Grammar. They respond to each other’s drafts
by answering the questions of the checklist in their task book. Meanwhile, for self revising,
students are assigned to revise their own draft by using Revision Checklist for Expository
answer the questions of the checklist in their task book, and then write second draft based
on the suggestion from peer and self revising.
Finally, teacher assigns students to edit their second draft in editing stage. The editing
stage centers on providing students chances to edit the drafts, and proofread the drafts for
accuracy and correctness in spelling, punctuation, capitalization and grammar. Editing is
putting the piece of writing into its final form. It is the process in which students begin to
look at correctness. Assert that editing stage primarily focuses on the content of students'
writing. Students need to edit their draft to make sure their sentences are clear. To do so,
teacher guides students to edit their second draft through self editing. They are suggested to
use Self Editing Worksheet taken from book, Introduction to Academic Writing. They
respond their own draft by answering the questions of the worksheet. After that, they are