www.foura.org
__________
*Corresponding author. E-mail: [email protected]
Impact of Political Events (Inauguration of Cabinet and
Cabinet Reshuffles) on Industrial Sectors in Indonesia
Stock Exchange
Albert Andika Prasetia
a, Susi Sarumpaet
b, Dewi Sukmasari
baFinancial and Development Supervisory Board (Badan Pengawasan Keuangan dan Pembangunan/BPKP) bFaculty of Economics and Business, University of Lampung, Indonesia
Abstract
The purpose of this research is to analyse Indonesian capital market’s reaction to cabinet formation and cabinet reshuffles, which is indicated by a change in abnormal return and trading volume activity. Event Study method was used to analyse the market reaction and paired sample t-test to analyse abnormal returns and Trading Volume Activity differences before and after the events for 90 companies listed in Indonesia Stock Exchange selected using purposive sampling method. Abnormal return and Trading Volume Activity were used to measure market reaction. Paired-Sample T-Test and Wilcoxon-Signed Rank Test were used to test market reaction before and after the event. The results showed in three political events observed, reaction only occurred on Trade, Service and Investment during before and after cabinet reshuffle volume I (abnormal return) and cabinet reshuffle volume II (Trading Volume Activity). Overall, political events observed does not contain enough information to trigger reactions in all market sectors.
Keywords: Abnormal return, cabinet, Indonesia stock exchange, trading volume activity
1. INTRODUCTION
Capital market as a place of stock trading is a facility that brings investors, as the parties who own the funds, and companies, as parties who need funds. Investors entrust their funds to the company with the expectation of getting rewarded. Many factors determine the success of the capital market in Indonesia. Husnan (2008) in Pratama et al. (2014) states that the determinants of capital market success in Indonesia are determined by the availability of securities, demand for securities, legal and regulatory issues, the existence of institutions that regulate and supervise capital market activities, the existence of institutions that enable efficient transactions, and the economic and political conditions of a country. Jogiyanto (2010) states that political policy can be one of the external factors affecting the capital market in Indonesia. Jogiyanto (2010) also stated that capital market actors will evaluate every announcement issued by the company or government policy, so that it will cause some changes in stock trading transactions, for example with changes in trading volume of stocks, changes in stock price, bid/ask spread, proportion of ownership, etc.
of the presidential cabinet, and the cabinet reshuffle. The selection of the right people in the cabinet as the extension of the president is expected to have an impact towards the capital market as they will pose as the policy makers. This research focuses on cabinet changes, wheter the formation or reshuffles, which occurred during the reign of President Jokowi. The formation itself occured in October 27, 2014 as the President of Republic of Indonesia, Jokowi, inaugurated the cabinet. The first reshuffle occurred on August 12, 2015. In the first volume of cabinet reshuffle, Jokowi replaced five ministers and one cabinet secretary. Jokowi made another cabinet change on July 27, 2016. This time, he inaugurated nine new figures replacing the previous ministers. One of the highlights of the cabinet reshuffle was Sri Mulyani Indrawati's inauguration as Finance Minister who had previously served as the same position during the reign of President Susilo Bambang Yudhoyono (SBY) before resigning to become the Managing Director of the World Bank.
The research on the impact of an event on trading activity in capital market is done using event study by observing the movement of stock prices in the capital market when an event occurs and examining whether there are any unusual returns received by investors as a result of the event. This unusual return is called abnormal return. If an event does not contain information then there will be no abnormal return as a result of reaction to an event (Jogianto, 2010). Research on a capital market reaction to a political event cannot solely be observed from the abnormal return. When the event occurs, the investor will react in the form of stock trading. Stock trading that occurs, in addition to providing fluctuations in stock prices that exist at the time, can also affect the volume of trading stocks, therefore the trading volume activity (TVA) can be used as a measuring tool for the occurrence of an event.
The reactions that arise in the market are influenced by the level of market sensitivity itself in responding to information. Each industry sector has a different character from one to the other. This difference is the result of variations in the type of business, the size of the company, the amount of competition in the industry, as well as the benefits an industry has for the implementation of a government policy. This difference causes a variation in the reaction generated by a capital market sector to an event. Manurung and Kusumawati (2007) stated that each industry sector with its own characteristics has its own sensitivity to macro change. Several researches on capital market reaction have been done using abnormal return and trading volume activity parameters with various result. Femianita et al.(2014), Nazir (2014), and Nurhaeni (2009) concluded that there are a significant difference in abnormal return that occurred before and after the political events. These results are denied by researches conducted by Sihotang et al. (2015) and Mahaputra et al. (2015), which summed up different result. The significant difference in TVA that occured on before and after the political events is shown by Femianita et al.(2014), Sihotang et al.(2015), and Nurhaeni (2009). Saputra (2016) concluded that there are no significant difference in TVA that occurred on before and after the political event. This indicates the need of further research to clear out any inconsistency of result.
Based on the above background, the problems identified in this research are: (1) Is there any abnormal return differences that occurred before and after the political events within the industrial sector of Indonesia Stock Exchange, and (2) Is there any trading volume activity (TVA) differences that occurred before and after the political events within the industrial sector of Indonesia Stock Exchange. Based on the theory, backgrounds and the earlier researches explained, the authors are interested in making research which can explain the impact of political events (inauguration of cabinet and cabinet reshuffles) on industrial sectors in indonesia stock exchange, so that it can contribute to investors to give an overview of the reaction that occurs in the capital market when political events take place as a consideration in decision-making.
2. THEORITICAL BASE AND HYPOTHESIS
2.1 Signalling Theory
Information is a key factor that investors use in making investment decisions. Information, published as an announcement, will give a signal to investors and will be used as an analytical tool in investment decision making (Jogiyanto, 2010).
2.2 Efficient Market Hypothesis
When a new information emerges, the market will seek a new equilibrium point. Jogianto (2010) states a new market equilibrium occurs in efficient markets where it has fully reflected all available information, including recently announced information. EMH assumes the market initially overreacts and will subsequently correct itself (Obi and Sil, 1996). This correction is made in order to find a new equilibrium after the announcement of new information. Based on this, investors will not be able to obtain abnormal return consistently because the market price will always adjust to reflect all available information.
2.3 Capital Market
Kasmir (2015) defines the capital market as the meeting place of sellers and buyers to conduct transactions to obtain capital. The capital market plays an important role in the economy, particularly in relation to the allocation of public funds. Na'im (1997) in Nurhaeni (2009) states that capital markets provide to those who have surplus funds in society (savers or investors) a higher levels of liquidity, and also allocate those who need funds (companies) to obtain the necessary funds in investment. In Indonesia, the definition of capital markets is also described in the Capital Market Law (number 8 of 1995) article 1 point 13. According to the law, capital market is an activity concerned with the public offering and securities trading, the public company relating to its issued securities, as well as securities-related institutions and professions. Here, the sale of stocks are done in Indonesia Stock Exchange (IDX).
2.4 Jakarta Stock Industrial Classification (JASICA)
Jakarta Stock Industrial Classification (JASICA) is a classification system used to categorize shares of companies listed on the Indonesia Stock Exchange. The division of the industrial sector at JASICA is based on the Indonesian Business Classification published by the Central Bureau of Statistics (BPS) with reference to the International Standard Industrial Classification (ISIC).
2.5 Jakarta Composite Index (JCI/IHSG)
Jakarta Composite Index (JCI/IHSG) is an index consisting of all shares listed in IDX. According to the IDX website, JCI was first introduced in 1983. JCI uses date base of August 10, 1982, with a base index value of 100, of which there are only 13 listed companies. JCI is often used in research because it includes all companies listed on IDX. This research also uses JCI as market index to determine market returns.
2.6 Return
Stock return is the level of profit enjoyed by investors on an investment that has been done (Ang, 1997). Stock Return can be an Actual Return or Expected Return.
2.7 Actual Return
Actual Return is a realized return. Actual return at a time (t) is calculated by subtracting the current stock price (t) by the previous period stock price (t-1) divided by the previous period's stock price (t-1). The calculation of actual return in this research using historical data of daily stock price.
2.8 Expected Return
In accordance with the definition described by Jogianto (2010), expected return is a return that has been estimated to be realized by investors in the future. Expected return is important for investors in making investment decisions. Brown and Warner (1985) in Jogiyanto (2005) explain that the expected return can be calculated using three models: (1) Mean-adjusted Model, (2) Market Model, and (3) Market-adjusted Model. This research, in the calculation of expected return, uses the Market-adjusted Model, so the author does not need to determine the estimation period because this model assumed that expected return is equal to market return at the same period.
2.9 Abnormal Return
of an event. Jogianto (2000) in Nurhaeni (2009) formulates abnormal return as the difference between Actual Return and Expected Return.
2.10 Trading Volume Activity
Trading Volume Activity is one of many instrument that can be used to analyze capital market reaction to information by taking a close look at the movement of stock trading volume activity in market (Nurhaeni, 2009). Using the formulation of Hanafi et al. (1997) in Istanti (2009) TVA can be defined as the comparison between the volumes of shares traded with the number of outstanding shares at a certain period.
2.11 Event Study immediately in security price. Thus a measure of the event's economic impacts can be observed over a relatively short time period. Event study can be used to test the information content of an announcement and be used to test the market efficiency of the semi-strong form. According to Binder (1998) the event study is used for two reasons: 1) to test the initial hypothesis that the market efficiently combines all available information and 2) to examine the impact of an event related to shareholder welfare.
2.12 Earlier Researches
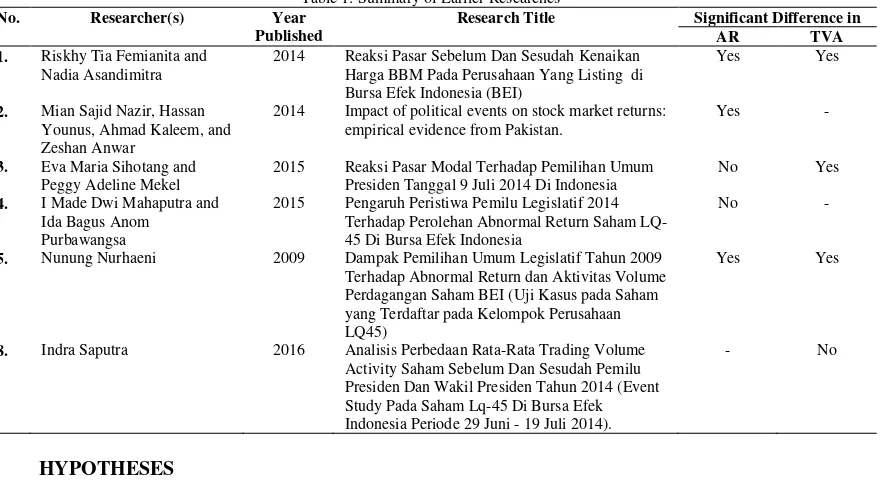
There are several earlier researches which examined the capital market reaction to the non-economic events underlying this research. These researches also used abnormal return and/or trading volume activity to measure the reaction occurred. The earlier researches can be summed up in Table 1 below.
Table 1: Summary of Earlier Researches
2014 Reaksi Pasar Sebelum Dan Sesudah Kenaikan Harga BBM Pada Perusahaan Yang Listing di Bursa Efek Indonesia (BEI)
Yes Yes
2. Mian Sajid Nazir, Hassan Younus, Ahmad Kaleem, and Zeshan Anwar
2014 Impact of political events on stock market returns: empirical evidence from Pakistan.
Yes -
3. Eva Maria Sihotang and Peggy Adeline Mekel
2015 Reaksi Pasar Modal Terhadap Pemilihan Umum Presiden Tanggal 9 Juli 2014 Di Indonesia
No Yes
4. I Made Dwi Mahaputra and Ida Bagus Anom
Purbawangsa
2015 Pengaruh Peristiwa Pemilu Legislatif 2014 Terhadap Perolehan Abnormal Return Saham LQ-45 Di Bursa Efek Indonesia
No -
5. Nunung Nurhaeni 2009 Dampak Pemilihan Umum Legislatif Tahun 2009 Terhadap Abnormal Return dan Aktivitas Volume Perdagangan Saham BEI (Uji Kasus pada Saham yang Terdaftar pada Kelompok Perusahaan LQ45)
Yes Yes
8. Indra Saputra 2016 Analisis Perbedaan Rata-Rata Trading Volume Activity Saham Sebelum Dan Sesudah Pemilu Presiden Dan Wakil Presiden Tahun 2014 (Event Study Pada Saham Lq-45 Di Bursa Efek Indonesia Periode 29 Juni - 19 Juli 2014).
- No
3. HYPOTHESES
3.1 The formation of new President’s Cabinet
The change of cabinet arrangement, as an extension of a President's hand, will determine the success of a country's development. Ministers and institutional leaders are the roles that will be directly involved in the implementation of regulations and policies in accordance with the president's vision. The selection of the right figure and is believed to provide many benefits investors will make investors react by buying stocks and vice versa. The reactions that occur can be reflected on TVA and stock prices, and ultimately result in abnormal returns. Based on these explanations the research hypotheses can be developed as follows:
3.2 Cabinet Reshuffle volume I
The volume I cabinet reshuffle occurred on 12 August 2015 marked by a change of cabinet secretary and five ministers. One that will affect the economy, and capital market in Indonesia, is the appointment of the minister of economic coordinator. Darmin Nasution is appointed by President Jokowi to occupy that position, replacing Sofyan Djalil. Darmin Nasution, who once served as Governor of Bank Indonesia, is considered a better fit in order to achieve economic stability during the reign of President Jokowi. This will lead to reactions of investors who have expectations of the changes. TVA and abnormal return can be used as an indicator in measuring investor reactions that occur. Based on these explanations the research hypotheses can be developed as follows: Ha3: There are differences in abnormal returns generated before and after the Cabinet Reshuffle volume I. Ha4: There are differences in Trading Volume Activity before and after the Cabinet Reshuffle volume I.
3.3 Cabinet Reshuffle volume II
President Jokowi replaced twelve ministers in his cabinet. The highlight of this reshuffle is the emergence of the name of Sri Mulyani Indrawati who is appointed to be Minister of Finance. She had held the same position during the reign of President Susilo Bambang Yudhoyono before finally resigned to become Managing Director of World Bank. The reaction that occured in the capital market can be reflected from TVA and the resulting abnormal return. Based on these explanations, the hypotheses can be developed as follows:
Ha5: There are differences in abnormal returns generated before and after the Cabinet Reshuffle volume II. Ha6: There are differences in Trading Volume Activity before and after the Cabinet Reshuffle volume II.
Political events that took place in Indonesia had an impact on the capital market in Indonesia. The influence can be reflected from the price of shares in the Indonesia Stock Exchange. Each sector has its own sensitivity in reacting to events that occur, so it needs to be analyzed whichever sector directly reacts to the occurrence of an event1.
4. RESEARCH METHODOLOGY
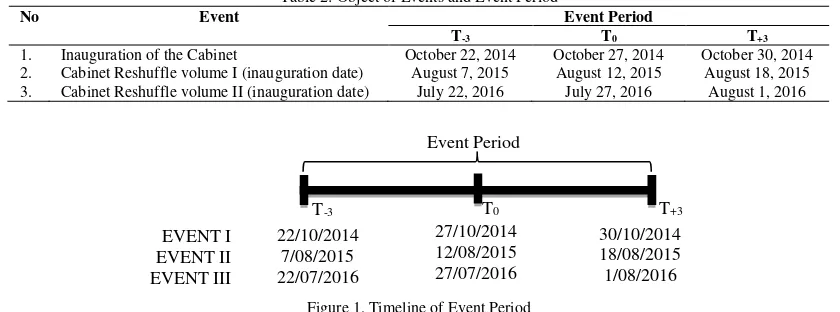
This study uses event study to explain the impact of political events occured in Indonesia Stock Ecxhange. Author do not include other factors that can affect stock prices such as bank interest rates, government regulations and policies and other macro factors. Quantitative approach is used in this study and then use statistical analysis to process the data.Author, in determining Expected Return, uses Market-Adjusted Model so that the observation period is the same as the event window. The object and period of Events took by the researchers are presented in Table 2 and Figure 1 as follows:
Table 2: Object of Events and Event Period
No Event Event Period
T-3 T0 T+3
1. Inauguration of the Cabinet October 22, 2014 October 27, 2014 October 30, 2014 2. Cabinet Reshuffle volume I (inauguration date) August 7, 2015 August 12, 2015 August 18, 2015 3. Cabinet Reshuffle volume II (inauguration date) July 22, 2016 July 27, 2016 August 1, 2016
Figure 1. Timeline of Event Period
The population in this study are all listed companies in Indonesia Stock Exchange (IDX). Purposive sampling is used by taking 10 stock samples from each sector, with some some criteria as follows:
All samples taken are stocks listed on the Indonesia Stock Exchange in the period of the event
The samples taken have trading volume in the event period
No Corporate Action takes place on samples taken during the event period
1 Manurung, Adler Haymans and Cahyanti Ira Kusumawati. 2007. The Influence of Political Events (Announcement of Legislative Election
Results, Announcement of the Result of Presidential Election, Announcement of Cabinet Arrangement, Cabinet Reshuffle) Against Industrial Sectors in Jakarta Stock Exchange. Business and Management Journal. Vol 7, No.2
EVENT I EVENT II EVENT III
22/10/2014 7/08/2015 22/07/2016
27/10/2014 12/08/2015 27/07/2016
30/10/2014 18/08/2015 1/08/2016
T-3 T0 T+3
Event Period
The samples taken are not announcing Warrant / Rights in the event period
No GMS takes place on samples taken during the event period, and
No Public Exposure takes place on samples taken during the event period
The purposive sample selection is intended to obtain samples that are not being affected by other events that may affect stock prices and stock trading volumes. The researcher does this with the assumption that if a stock is detached from such events, then the price and volume of trade are only influenced by the political events examined (Umar, 2002). Data collecting uses documentation method that is collecting secondary data in daily stock price, daily trading volume and JCI through official website of Indonesia Stock Exchange (www.idx.co.id) and Yahoo Finance (finance.yahoo.co.id). The collected data must meet the sample criteria. Filtering is done by referring to the stock calendar which can be found on the website www.ipotnews.com.
In filtering stocks for samples, researchers refer to capital market calendars that can be found on the site www.ipotnews.com. The researcher must ensure that all the events (Corporate Action, Warrant / Rights, Initial Public Offering, GMS and Public Expose) are strictly checked during the filtering process. The researcher then navigates to the event periods, taking note all stocks which conducting these activities during the event period and removing them from potential samples. In analyzing the research data and testing the hypothesis using descriptive statistics, normality test, and T-Test is done with the help of Statistical Product and Service Solution (SPSS) program. Each of the analytical techniques related to the intended use, steps, and interpretation of the results will be described as follows.
4.1 Data Analysis Method
In analyzing the research data and testing the hypothesis using descriptive statistics, normality test, and T-Test is done with the help of Statistical Product and Service Solution (SPSS) program. Each of the analytical techniques related to the intended use, steps, and interpretation of the results will be described in the next section below.
4.2 Normality Test and One Sample-T-Test
Normality tests are needed to determine whether the population data is normally distributed or not. If the sample being tested has a normal distribution, further analysis using parametric methods. If it does not have a normal distribution, the next analysis uses a non-parametric method. Normality test in this research using Kolmogorov-Smirnov test. One Sample T-Test is performed to determine whether there are market reactions occurred during the event period. This test is also conducted to check on which day during the observation period did the market react to the events occurred. Both tests was performed using SPSS program with the significance level of 0.05.
4.3 Hypothesis Test
Hypothesis test in this study is determined by normality test results, based on it can be determined the appropriate test equipment for hypothesis testing. If the data is normally distributed, hypothesis test is done by parametric method that is using Paired Sample T-Test. Meanwhile, if the data is not proven to be normal, then the hypothesis test is done by non-parametric method, that is using Wilcoxon Signed Rank Test test.
5. RESULT AND DISCUSSION
5.1 Descriptive Statistics
Table 3 describes the descriptive statistical analysis of abnormal return for all the events that become the object of this study. The increase or decrease of mean on before and after the events indicates that there are changes or difference in the average abnormal return mean. The increase and decrease in standard deviation means to indicate the homogeneity of reactions in the industrial sector in the capital market.
Table 3: Descriptive Statistical Test Result on Abnormal Return
No Sectors
Inauguration of The Cabinet
Cabinet Reshuffle volume I
Cabinet Reshuffle volume II
Mean Std. Dev. Mean Std. Dev. Mean Std. Dev.
After 0,00210 0,00203 0,00090 0,02651 -0,00400 0,01961 5 Consumer Goods Industry Before 0,00060 0,00075 0,00210 0,01437 0,00380 0,01981 After 0,00060 0,00066 0,00220 0,01195 -0,00150 0,01079 6 Property, Real Estate, and
Building Construction
Before 0,00550 0,00830 -0,00050 0,00809 -0,00020 0,00819 After 0,00400 0,00567 0,00710 0,01431 -0,00510 0,01126 7 Infrastructure, Utility, and
Transportation
Before 0,00190 0,00196 0,00130 0,01651 -0,00090 0,01217 After 0,00170 0,00211 -0,00350 0,01441 -0,00540 0,01263 8 Finance Before 0,00100 0,00152 0,00330 0,01574 -0,00010 0,01261 After 0,00100 0,00142 0,00110 0,02066 0,00170 0,00706 9 Trade, Service, and Investment Before 0,00050 0,00057 0,00870 0,00695 0,00010 0,00844 After 0,00060 0,00056 -0,00310 0,00536 -0,00230 0,02180
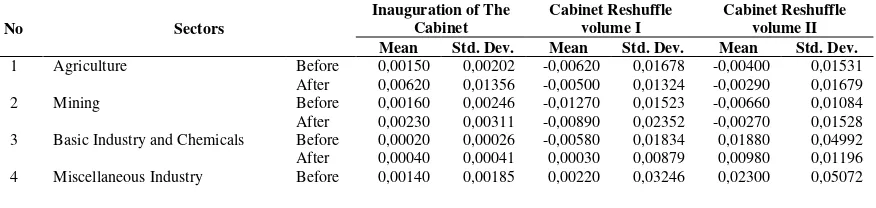
Table 4 describes TVA descriptive statistical analysis for all the events that became the object of this study. The increase or decrease of average TVA mean on before and after the events indicates that there are changes or difference in the average TVA mean. The increase and decrease in standard deviation means to indicate the homogeneity of reactions in the industrial sector in the capital market.
Table 4: Descriptive Statistical Test Result on Trading Volume Activity
No Sectors
1 Agriculture Before 0,00150 0,00202 0,00727 0,01258 0,00724 0,01388 After 0,00620 0,01356 0,00611 0,01018 0,00535 0,00620 2 Mining Before 0,00160 0,00246 0,00121 0,00111 0,00144 0,00133 After 0,00230 0,00311 0,00161 0,00222 0,00238 0,00330 3 Basic Industry and Chemicals Before 0,00020 0,00026 0,00046 0,00090 0,00134 0,00186 After 0,00040 0,00041 0,00014 0,00014 0,00139 0,00141 4 Miscellaneous Industry Before 0,00140 0,00185 0,00520 0,00784 0,00450 0,00417 After 0,00210 0,00203 0,00438 0,00775 0,00280 0,00279 5 Consumer Goods Industry Before 0,00060 0,00075 0,00075 0,00127 0,00144 0,00157 After 0,00060 0,00066 0,00084 0,00129 0,00130 0,00138 6 Property, Real Estate, and Building
Construction
Before 0,00550 0,00830 0,00319 0,00597 0,00377 0,00538 After 0,00400 0,00567 0,00346 0,00376 0,00464 0,00498 7 Infrastructure, Utility, and
Transportation
Before 0,00190 0,00196 0,00118 0,00233 0,00146 0,00212 After 0,00170 0,00211 0,00113 0,00193 0,00288 0,00442 8 Finance Before 0,00100 0,00152 0,00220 0,00386 0,00081 0,00091 After 0,00100 0,00142 0,00173 0,00261 0,00085 0,00081 9 Trade, Service, and Investment Before 0,00050 0,00057 0,00102 0,00161 0,00157 0,00370 After 0,00060 0,00056 0,00187 0,00385 0,00311 0,00704
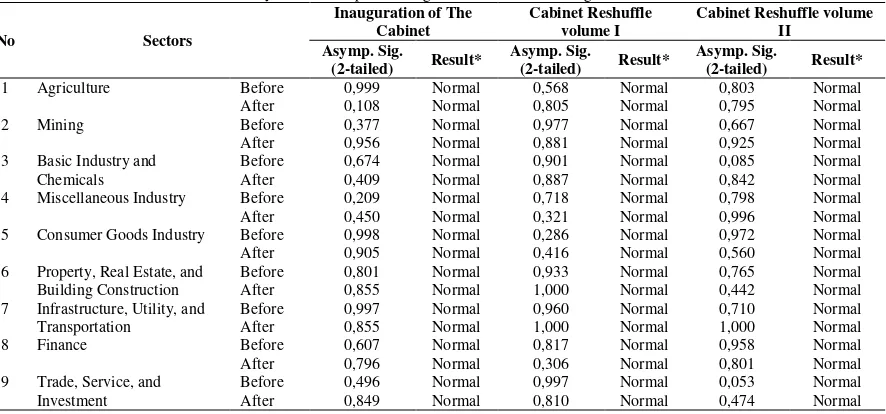
5.2 Normality Test
Based on the results of One Sample Kolmogorov-Smirnov test in Table 5 (as summarized from Appendix II) above shows that the value of significance (shown as Asymp.Sig.) Value for the average abnormal return variable in all events is above the alpha value of 5% (0.05). This means that all data for the average abnormal return variable is normally distributed.
Table 5: Summary of One-Sample Kolmogorov-Smirnov on Average Abnormal Return
No Sectors
4 Miscellaneous Industry Before 0,209 Normal 0,718 Normal 0,798 Normal
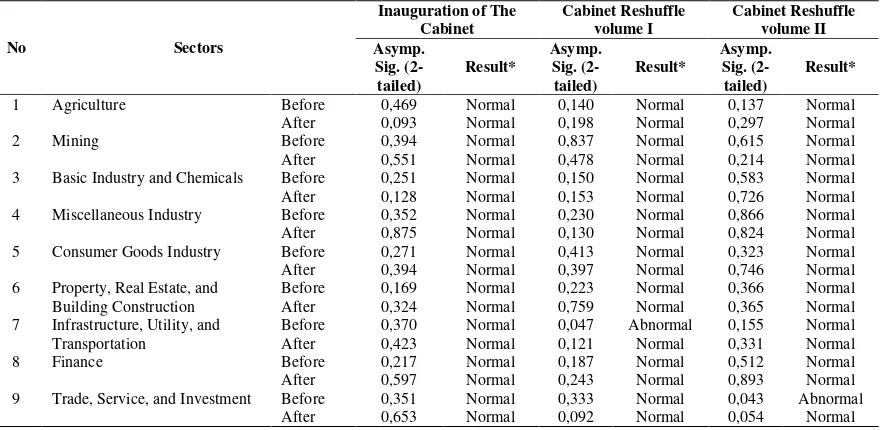
Based on the result of One Sample Kolmogorov-Smirnov test in Table 6 (as summarized from Appendix III) above shows that the value of probability (shown as Asymp.Sig.) Value for TVA average variable in almost all events is above the alpha value of 5% (0.05) in the other word, these sectors are normaly distributed. Therefore, the hypothesis test will be conducted using Paired-Sample T-Test. The only two sectors which have the probability value under the alpha value are Infrastructure, Utility and Transportation in Cabinet Reshuffle volume I and Trade, Service, and Investment in Cabinet Reshuffle volume II. These two sectors are not normaly distributed. Therefore, the hypothesis test for both sectors are conducted using Wilcoxon-Signed Rank Test.
Table 6: Summary of One Sample Kolmogorov-Smirnov on Average Trading Volume Activity
No Sectors 4 Miscellaneous Industry Before 0,352 Normal 0,230 Normal 0,866 Normal After 0,875 Normal 0,130 Normal 0,824 Normal 9 Trade, Service, and Investment Before 0,351 Normal 0,333 Normal 0,043 Abnormal
After 0,653 Normal 0,092 Normal 0,054 Normal
5.3 One-Sample T-Test
In variable abnormal return, significance occurs in Agriculture sector; Infrastructure, Utility and; And Finance during the inauguration of cabinet. Significance is shown by the Consumer Goods Industry Sector; Property, Real Estate, and Building Construction; Finance; And Trade, Service, and Investment during Cabinet Reshuffle volume I. In Cabinet Reshuffle volume II, significance is indicated by Agriculture; Mining; Basic Industry and Chemicals; Miscellaneous Industry; Property, Real Estate, and Building Construction; Finance; And Trade, Service and Investment. Finance is the only sector that always shows the significance of abnormal return on the three political events that occur. The significance of abnormal return that occurs is described further in Table 7 below (as summarized from Appendix IV).
Table 7: Summary of One Sample T-Test on Average Abnormal Return
No. Industry Sector Inauguration of
Cabinet Cabinet Reshuffle volume I
Cabinet Reshuffle volume II
1. Agriculture Significant in T-3.
T-2, and T0 Insignificant
Significant in T-1 and T+3
2. Mining Insignificant Insignificant Significant in T+2
and T+3 3. Basic Industry and Chemicals Insignificant Insignificant Significant in T-3 4. Miscellaneous Industry Insignificant Insignificant Significant in T+3 5. Consumer Goods Industry Insignificant Significant in T+2 Insignificant
6. Property, Real Estate, and Building
Construction Insignificant Significant in T-2 Significant in T+3 7. Infrastructure, Utility, and Transportation Significant in T-2 Insignificant Insignificant 8. Finance Significant in T-1 Significant in T-3 and T+2 Significant in T+2 9. Trade, Service, and Investment Insignificant Significant in T-1 and in T+1 Significant in T+3
Table 8: Summary of One Sample T-Test on Trading Volume Activity
No. Industry Sector Inauguration of
Cabinet Cabinet Reshuffle volume I
Cabinet Reshuffle volume II 1. Agriculture Insignificant Significant in T-3, T-2, and T0 Insignificant
2. Mining Significant in T0 Insignificant Insignificant
3. Basic Industry and Chemicals Insignificant Insignificant Insignificant 4. Miscellaneous Industry Insignificant Insignificant Insignificant 5. Consumer Goods Industry Insignificant Insignificant Insignificant 6. Property, Real Estate, and Building
Construction
Insignificant Insignificant Insignificant
7. Infrastructure, Utility, and Transportation Insignificant Insignificant Significant in T-1
8. Finance Insignificant Insignificant Insignificant
9. Trade, Service, and Investment Insignificant Significant in T-2 Insignificant
5.4 Paired Sample T-Test
The result of paired sample t test using SPSS is presented in Appendix VI and Appendix VII. The results of paired sample t-test for each variable are summarized in Table 9 and Table 10 below.
Table 9: Summary of Paired- Sample T-Test on Abnormal Return
No. Industry Sector 6. Property, Real Estate, and Building Construction -1,466 0,177 -1,501 0,168 1,257 0,240 7. Infrastructure, Utility, and Transportation 0,639 0,538 0,723 0,488 1,135 0,286
8. Finance 0,097 0,925 0,435 0,674 -0,537 0,604
9. Trade, Service, and Investment 1,625 0,139 5,714 0,000 0,470 0,650
Table 10: Summary of Paired- Sample T-Test on Trading Volume Activity
No. Industry Sector 6. Property, Real Estate, and Building Construction 1,505 0,167 -0,286 0,781 -1,789 0,107
7. Infrastructure, Utility, and Transportation
The result Wilcoxon-Signed Rank Test using SPSS are presented in Appendix VIII and summarized in Table 11 below.
Table 11: Summary of Wilcoxon-Signed Rank Test on Trading Volume Activity
Test Result Cabinet Reshuffle volume I Cabinet Reshuffle volume II
Infrastructure, Utility, and
value of the industrial sector when other events are below the critical limit (0.05). Of the six alternative hypotheses formulated, only the third (Ha3) and sixth (Ha6) alternative hypotheses are supported. Meanwhile, another alternative hypotheses are rejected.
5.7 Interpretations
Overall, the three political events that occurred did not affect the Indonesian capital market in terms of trading activity. This is reflected in the absence of significant differences, either from abnormal returns or TVA, to almost all sectors in the stock during before and after the political events. The results of this study support the research of Sihotang and Mekel (2015), and Mahaputra and Purbawangsa (2015) which concluded that there is no significant abnormal return difference before and after the political events being obstructed. This research also supports the research of Saputra (2016) which stated no significant TVA differences in before and after the observed political events.
The reaction that can be concluded from this research occured in Trade, Service and Investment during the cabinet reshuffle volume I and cabinet reshuffle volume II. This was due to the change in Minister of Trade in both events. Thomas Lembong was appointed to become Minister of Trade to replace Rachmat Gobel in the first cabinet reshuffle. In the second cabinet reshuflle, Enggartiasto Lukita is appointed as the Minister of Trade. Lembong himself is appointed as the Head of Investment Coordinating Board (Badan Koordinasi Penanaman Modal/BKPM). Lembong, who experienced in investment and considered capable enough to lead the company Quvat became one of the major investment companies in Indonesia is considered a good news for Trade, Service, and Investment. This is proved by the reactions reflected by significant abnormal return differences between before and after Reshuffle volume I. However, similar reactions do not propagate to other industrial sectors, so this sector becomes the only sector that reacts to the event.
Based on previous researches, there are some things that cause no significant difference, either abnormal return or TVA, on before and after the event:
Information Leakage
Zaqi (2006) concluded that one of the reasons for the absence of significant differences between before and after the events observed was due to information leakage. This causes the market to take an action action and react more quickly before the event occurs (the event is announced. As for the political events, investor usually have information related candidates. Information can be either from media predictions or inside information. This information is usually not much different from what was announced later, so when announced this information already does not have a shock effect that will make the market react.
The lack of information contained in the event
Pratama (2015) and Sihotang (2015) states that one of the causes of the absence of market reaction to an event is due to the lack of information contained in the event. This minimal information content causes investors to ignore the ongoing events because they are considered not to have a negative or positive impact on them. The changes of cabinet is deemed to have no information content because it is not considered an event that will have a direct impact on investors.
Investors Conservatism
Investor conservatism in allocating funds becomes one of the causes of no significant difference between before and after the event. The tendency of investors to delay the movement in the stock is caused by two things: the fear of losing if maneuvering during the event (Pratama, 2015) and expectation to gain greater profit after the event (Saputra, 2016).
6. CONCLUSION AND LIMITATIONS OF RESEARCH
6.1 Conclusions
Overall, the Indonesian Capital Market did not react to political events that occurred as there are no signifcant changes in almost every sectors in the Indonesia Capital Market related to these events. This indicates that the change of cabinet is not seen as an event that can affect the company owned by investors. The only significant difference is only shown by Trade, Service, and Investment. This is related to the selection of figures who are considered to be able to give positive changes to the sector. The selection of the right figure, who has had a good reputation in investment, gives investors expectation for developments in the sector so that it is believed will have a positive impact on the company that they has in the future. This expectation is believed to bring a reaction to the sector.
The Indonesian capital market does not react to the inauguration of the cabinet in terms of abnormal return. Based on the statistical test of the average abnormal return it is found that there is no significant difference of average abnormal return on all sectors of Indonesian Capital Market industry during the period before and after the inauguration of the cabinet.
The Indonesian capital market does not react to the inauguration of the cabinet in terms of TVA.
Based on statistical tests of the average TVA it was found that there was no significant difference in TVA in all sectors of the Indonesian Capital Market industry during the period before and after the cabinet's inauguration.
Trade, Service, and Investment reacts to the cabinet reshuffle volume I in terms of abnormal return.
Based on the statistical test on the average abnormal return it is found that the significant difference of abnormal return on before and after cabinet reshuffle volume I is only found in Trade, Service, and Investment. Thus, it can be concluded that the sector reacts to the cabinet reshuffle volume I. As for other sectors, there is no similar reaction shown.
The Indonesian capital market does not react to the cabinet reshuffle volume I in terms of TVA.
Based on the statistical test of the average TVA it is found that there is no significant difference in TVA in all sectors of Indonesian Capital Market industry during the period before and after cabinet reshuffle volume I.
The Indonesian capital market does not react to the cabinet reshuffle volume II in terms of abnormal return. Based on the statistical test of the average abnormal return it is found that there is no significant difference of average abnormal return on all sectors of Indonesia Capital Market industry during the period before and after cabinet reshuffle volume II.
Trade, Service, and Investment reacts to the cabinet reshuffle volume I in terms of TVA.
Based on the statistical test on the average abnormal return it is found that the significant difference of TVA on before and after cabinet reshuffle volume II is only found in Trade, Service, and Investment. Thus, it can be concluded that the sector reacts to the cabinet reshuffle volume II. As for other sectors, there is no similar reaction shown.
Overall, the Indonesian Capital Market did not react to political events that occurred.
The results of this study indicate that the political events that occurred (the inauguration of President Jokowi, the inauguration of the cabinet, and cabinet reshuffle volume I and II) did not affect changes in the Indonesia Capital Market. This is reflected from the difference in average abnormal returns generated between before and after the events only in, at most, one of nine sectors. In terms of TVA the similar result is shown.
Some things can lead to the absence of market reactions that occur: information leakage, lack of information contained in the event, and investor conservatism.
6.2 Limitations of Research
The sample of this research is still relatively small. This study takes only 90 stocks from a total of 539 stocks listed on the Indonesia Stock Exchange. The abnormal return calculation uses a market adjusted model, where the expected return on the observation period in each industry sector is assumed to be the same as the market return (Jakarta Composite Index, JCI) during the period of observation. The variables used to measure capital market reaction are only two, Abnormal Return and Trading Volume Activity.
6.3 Suggestions
In taking investment actions when a political event takes place, investors should more carefully consider which sectors will experience changes in reaction to the event because not all sectors in the Indonesian capital market react to it. Subsequent research can add more research samples so that the results will be better and accurate in explaining the reaction that occurs in each industry sector in Indonesia Stock Exchange. Subsequent research is expected to use the mean-adjusted model or market model so that the consistency of the results of this study can be seen. Subsequent research is expected to add other variables such as Security Return Variability in order to produce a better and accurate research in explaining the reaction that occurred in the Indonesian Capital Market.
REFERENCES
Ang, Robert. 1997. Buku Pintar Pasar Modal Indonesia. Jakarta: Media Staff Indonesia.
Binder, John J. 1998. The Event Study Methodology Since 1969. Review of Quantitative Finance and Accounting. Vol. 11 No. 1 Bodie, Zvi; Alex Kane and Alan J Marcus. 2005. Investment. 6th Edition. New York: McGraw-Hill
Bursa Efek Indonesia. 2016. IDX FactBook.
Dobbins, Richard dan Stephen F. Witt, 1979. Some Implications of the Efficient Market Hypothesis. Managerial Finance. Vol. 5, No. 1 Fama, Eugene. 1970. Efficient Capital Markets – A Review of Theory and Empirical Work. Journal of Finance. Vol. 25, No. 2
Femianita, Riskhy Tia dan Nadia Asandimitra. 2014. Reaksi Pasar Sebelum Dan Sesudah Kenaikan Harga BBM Pada Perusahaan Yang Listing di Bursa Efek Indonesia (BEI). Jurnal Ilmu Manajemen. Vol. 2, No. 3
Godfrey, Jayne; Allan Hodgson; Ann Tarca; Jane Hamilton and Scott Holmes. 2010. Accounting Theory. 7th Edition. New York: John Wiley & Sons, Inc.
Harahap, Sofyan Syafri. 2013. Analisis Kritis atas Laporan Keuangan. 11th Edition. Jakarta: Rajawali Pers
Hanafi, Mamduh M dan Abdul Halim. 2014. Analisis Laporan Keuangan. 4th Edition. Yogyakarta: UPP STIM YKPN. Hanafi, Mamduh., 1997. Informasi Laporan Keuangan: Studi Kasus Pada Emiten BEJ. Kelola. Vol. VI, No.16 Husnan, Suad. 2008. Manajemen Keuangan: Teori dan Penerapan. Book 1. 4th Edition. Yogyakarta: BPFE
Istanti, Lulu Nurul. 2009. Pengaruh Harga Saham, Trading Volume Activity dan Risiko Saham Terhadap Bid-Ask Spread (Studi pada Perusahaan LQ-45 di Bursa Efek Jakarta). Modernisasi. Vol.5, No. 3
Jogianto, Hartono. 2010. Teori Portofolio dan Analisis Investasi. 7th Edition. Yogyakarta: BPFE-UGM Jogianto, Hartono. 2000. Teori Portofolio dan Analisis Investasi. 2nd Edition. Yogyakarta: BPFE-UGM Kasmir. 2015. Bank dan Lembaga Keuangan Lainnya. 16th Edition. Jakarta: Rajawali Pers
MacKinlay, A. Craig. 1997. Event Studies in Economic and Finance. Journal of Economic Literature. Vol 35, No. 1
Mahaputra, I Made Dwi dan Ida Bagus Anom Purbawangsa. 2015. Pengaruh Peristiwa Pemilu Legislatif 2014 Terhadap Perolehan Abnormal Return Saham LQ-45 Di Bursa Efek Indonesia. Jurnal Manajemen Universitas Udayana. Vol. 4, No. 5
Manurung, Adler Haymans dan Cahyanti Ira Kusumawati. 2007. Pengaruh Peristiwa Politik (Pengumuman Hasil Pemilu Legislatif, Pengumuman Hasil Pemilihan Presiden, Pengumuman Susunan Kabinet, Reshuffle Kabinet) Terhadap Sektor-Sektor Industri Di Bursa Efek Jakarta. Jurnal Bisnis dan Manajemen. Vol 7, No.2
Na’im, Ainun. 1997. Peran Pasar Modal Dalam Pembangunan Ekonomi Indonesia. Kelola. Vol. 4, No.14
Nazir, Mian Sajid dkk. 2014. Impact of political events on stock market returns: empirical evidence from Pakistan. Journal of Economic and Administrative Sciences. Vol. 30. No. 1
Nurhaeni, Nunung. 2009. Thesis. Dampak Pemilihan Umum Legislatif Tahun 2009 Terhadap Abnormal Return dan Aktivitas Volume Perdagangan Saham BEI (Uji Kasus pada Saham yang Terdaftar pada Kelompok Perusahaan LQ45)
Obi, C. Pat dan Shomir Sil. 1996. Efficient Market Hypothesis and the Contrarian Trading Paradox. Management Research News. Vol. 19, No. 11
Pratama, I Gede Bhakti dkk. 2014. Reaksi Pasar Modal Indonesia Terhadap Peristiwa Politik (Event Study pada Peristiwa Pelantikan Joko Widodo Sebagai Presiden Republik Indonesia Ke-7). Jurnal Universitas Pendidikan Ganesha. Vol.3, No.1
Republik Indonesia. 1995. Undang-Undang No. 8 Tahun 1995 Tentang Pasar Modal. Lembaran Negara Nomor 64. Tambahan Lembaran Negara RI Nomor 3608
Saputra, Indra. 2016. Analisis Perbedaan Rata-Rata Trading Volume Activity Saham Sebelum Dan Sesudah Pemilu Presiden Dan Wakil Presiden Tahun 2014 (Event Study Pada Saham Lq-45 Di Bursa Efek Indonesia Periode 29 Juni - 19 Juli 2014). Jurnal Ekonomi dan Bisnis. Vol. 9, No. 1
Sihotang, Eva Maria dan Peggy Adeline Mekel. 2015. Reaksi Pasar Modal Terhadap Pemilihan Umum Presiden Tanggal 9 Juli 2014 Di Indonesia. Jurnal Ekonomi, Manajemen, Bisnis, dan Akuntansi. Vol 3, No. 1
Umar, Husein. 2002. Metode Penelitian dan Aplikasi dalam Pemasaran. Jakarta: PT Gramedia Pustaka Utama
Zaqi, Mochamad. 2006. Thesis. Reaksi Pasar Modal Indonesia Terhadap Peristiwa-Peristiwa Ekonomi dan Peristiwa-Peristiwa Sosial-Politik Dalam Negeri (Studi pada Saham LQ45 di BEJ Periode 1999-2003)
http://www.idx.co.id/id-id/beranda/tentangbei/sejarah.aspx. Diakses tanggal 14 Mei 2017
http://www.idx.co.id/Portals/0/StaticData/Publication/FactBook/FileDownload/20161025_FB-2016.pdf. Diakses tanggal 14 Mei 2017 finance.yahoo.co.id