Volume 9 | Issue 3 Article 3
January 2017
Free fall in a vacuum and in the air – calculating
limits using a real example and demonstrating the
limiting process to high school students using Excel
Jan Benacka
Department of Informatics, Faculty of Natural Sciences, Constantine the Philosopher University, Nitra, Slovakia, [email protected]
Sona Ceretkova
Department of Mathematics, Faculty of Natural Sciences, Constantine the Philosopher University, Nitra, Slovakia, [email protected]
Follow this and additional works at:http://epublications.bond.edu.au/ejsie
This Regular Article is brought to you by the Bond Business School atePublications@bond. It has been accepted for inclusion in Spreadsheets in Education (eJSiE) by an authorized administrator of ePublications@bond. For more information, please contactBond University's Repository
Recommended Citation
Free fall in a vacuum and in the air – calculating limits using a real example
and demonstrating the limiting process to high school students using Excel
Abstract
The paper gives the result of an experiment in which 24 high school students in the final year (age 18-19) calculated limits originated in reality and modelled the limiting process with an Excel application. The students answered a questionnaire to find out if they found the lesson interesting, understood the mathematics involved and if the models benefited the learning. The result is discussed.
Keywords
spreadsheet model, drag, l’Hospital’s rule
1 Introduction
In the authors’ country, calculus is taught as early as high school in optional mathematical
lessons, typically in the final year (age 18-19). Limits are essential to calculus, as e.g. the continuity, derivatives and integrals of functions are defined as limits. Students learn and exercise calculating limits, including l’Hospital’s rule; however, commonly almost nothing is said about what problem the limit originates from and what the result is good for. Galileo’s assertion that “The book of nature is written in the language of mathematics” can be doubted
then by the question “Where is the nature in the task: calculate
x x
x x
x x e e
e e 1 lim
0 ”. Such “art
for art's sake” tasks have a devastating impact on the motivation of high school students to continue studying STEM (Science, Technology, Engineering and Mathematics) disciplines at university. For example, a study carried out in the UK with more than 1,500 students of age 14 to 18 revealed that 44% believed that STEM subjects were "uninteresting" [1].
A way to make STEM disciplines more interesting to high school students is to teach them in an enriching manner solving a real problem to keep curiosity alive [2]. More emphasis has to be put on authenticity as real-world learning is critical in STEM subjects. For example Lawson [3, 4] analysed bungee jumping and free fall of a parachutist; Burt, Magnes, Schwarz and Hartke [5] discovered integration through recording the power of light that passes through the cut-out in a razor blade; Robinson and Jovanoski [6] analysed the problem of the ejection of a fighter pilot from an aircraft to determine the conditions under which the pilot may collide with the rear vertical stabilizer; Robinson [7] presented group projects in which the velocity of a skier, the effects of lift and drag on the length of drive of a golf ball and the size of parachute required to ensure a smooth landing were modelled with Matlab.
Visualization is central to learning STEM. Uttal and O’Doherty [8] defined visualization as any type of physical representation designed to make an abstract concept visible. Visualization allows one to perceive, and to think about, relations among items that would be difficult to comprehend otherwise. Martinovic and Karadag [9] explored the potential of the interactive mathematics learning environments to support learners in the development of the concept of the limit through visualisation with positive impact.
There is a wide range of phenomena that students are accustomed to, but gaining an insight requires inquiry and study. Free fall is a well-known everyday phenomenon scientifically studied since Galileo [10]. The solution in a vacuum is well-known [11]. The solution in the air if the air density is taken constant (holds up to about 500m) is also known [12, 13]. It is obvious that the solution in the air must reduce to the solution in a vacuum if the air density approaches zero. That is an example of a limiting process rooted in practice.
2 Free fall in a vacuum and in the air
Let semi axis y+ be oriented downwards. Let a body start falling free at t0s from y0m.
In a vacuum, the only force that acts is weight Ggm, where g is acceleration due to gravity and m is the body mass. The speed and displacement of the body are ("v" is for vacuum) [11]
gt
vv , (1)
2 v
2 1
gt
y . (2)
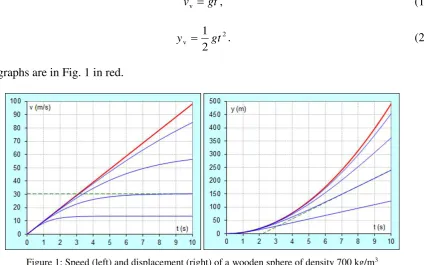
The graphs are in Fig. 1 in red.
Figure 1: Speed (left) and displacement (right) of a wooden sphere of density 700 kg/m3
falling for 10 s in a vacuum (red) and in the air (blue) if the diameter is d = (m; bottom to top) 0.01, 0.05, 0.2, 1. The green dashed line is the asymptote for d = 0.05 m
In the air, the air resistance force (drag) acts. The amplitude is given by the formula [11]
2 a D
2 1
v CA
F , (3)
where C is the drag coefficient dependent on the shape and speed of the body, A is the maximum cross-section area of the body perpendicular to the velocity, and a 1.225 kg/m3 is the air density at sea level [14]. If the speed is smaller than 270 m/s, which is 80% of the speed of sound, then C is constant [15], and C0.4 for a sphere [16]. The air density decreases with increasing altitude but it may be taken constant up to 500 m as the decrease is less than 5 %. The equation of motion is
2 d
d
Kv g t
v
, v
0 0,y
0 0, (4)where
m CA K
2
a
. The solution is [13]
t gK
K g v t
v g K
gK t
Kv g
v
tanh atanh
1 d
d
2
, (5)2 Spreadsheets in Education (eJSiE), Vol. 9, Iss. 3 [2016], Art. 3
High school students in the authors’ country learn neither hyperbolic functions nor to solve differential equations. Therefore the following forms were used in the lessons ("a" is for air):
following limits must hold
gt
The weight of the body is constant but the drag increases with the speed. After some time, the two forces become equal. From that point, the body moves on uniformly, that is, at a constant speed, which is the terminal speed vt of the fall. The equation GFD yields vt g K .
However, the body reaches this velocity in infinite time, because as the speed increases, the drag increases too, so the acceleration drops. Consequently, the speed increases slower, then the drag increases slower, and the acceleration drops less, and so on, until there is no speed increase after infinite time. Hence, the following limit must hold
K
It holds for the parameters k and q of the asymptote yktq to the graph of function f
tHence, the following limits must hold
K
4 Proofs (as with high school students) Eq. (9):
l´Hospital’s rule was applied in the second step.
Eq. (10):
Let us show that the limit equals 1:
1which results from Eq. (17). l´Hospital’s rule was applied in the second step.
4 Spreadsheets in Education (eJSiE), Vol. 9, Iss. 3 [2016], Art. 3
Eq. (11):
Let us show that the limit equals 1:
Let us show that the limit equals 1:
1which results from Eq. (21). l´Hospital’s rule was applied.
Eq. (15):
Let us show that the limit equals 0:
density. Density 700b
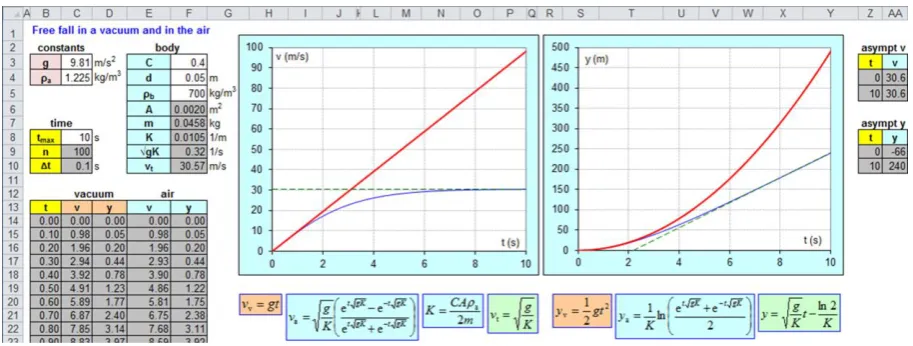
Figure 2: Speed (left) and displacement (right) of a sphere falling in a vacuum (red) and in the air (blue). The green dashed lines are the asymptotes.
The graphs are of type XY line made over 101 points (100 steps, cell C9). The time is calculated in range B14:B114 from 0 to tmax (cell C8) by step Δt tmax 100 (cell C10). The speed and displacement in a vacuum are calculated in ranges C14:C114 and D14:D114 by Eq. (1) and (2). The speed and displacement in the air are calculated in ranges E14:E114 and F14:F114 by Eq. (7) and (8). The asymptotes are two-point graphs of type XY line. The points are calculated in ranges Z4:AA5 and Z9:AA10.
6 Lesson and survey
The experiment was carried out with 24 high school students in the final year (age 18 – 19) in a 90 minute optional Mathematics Seminar lesson. The aim of the lesson was to present limits with a real background, visualize the limiting process, and practise calculating limits, including l’Hospital’s rule. The lesson was taught by the first author (“teacher”). The room was equipped with a teacher’s computer and projector but not with student computers; however, some students had their own laptops. The students were familiar with the trigonometric, exponential and logarithmic function and their derivatives, with the limit laws
and l’Hospital’s rule but not with calculating asymptotes.
The teacher started the lesson with a discussion on free fall in a vacuum and in the air, largely applying the method of questioning [18]. The students recalled equations (1), (2) and (3), which they learned in first year physics. The teacher invited the students to think about the effect of the density of the air on the motion. The students found that if the air density dropped steadily to zero, then the difference to the motion in a vacuum would be smaller and smaller, that is, the graphs in the air would approach the graphs in a vacuum and merge with them finally. The teacher wrote Eq. (1), (2), (7) – (10) on the whiteboard. He projected the model in Fig. 2 and explained how to use it and how it was created. Then he emailed the Excel model to each student. He called up students to experiment with parameters C, a, b
and d on the teacher’s computer and invited the class to observe the limiting process. The students found that if parameter K dropped, then the graphs in the air approached and finally merged with the graphs in a vacuum. The drop was possible to achieve by (1) decreasing parameter C, that is, by making the sphere smoother, (2) decreasing a, that is, making the air
thinner, (3) increasing b, that is, making the sphere heavier at the same size, and (4)
increasing diameter d, that is making the sphere bigger. The last finding was a surprise as the students supposed that if the sphere was bigger, then the air resistance would be bigger and
6 Spreadsheets in Education (eJSiE), Vol. 9, Iss. 3 [2016], Art. 3
the graphs in the air would get further from the graphs in a vacuum. The teacher challenged them to take the mass of the sphere into account, which resulted in the finding that if diameter
d was doubled, area A and consequently the drag would increase four times but the volume and consequently the mass would increase eight times, therefore K would drop to half. Then, two students proved Eq. (9) and (10) with the help of the class and teacher’s questioning.
The teacher invited the students to think about the speed of a body falling in the air. The students recalled that some bodies fall uniformly after some time, e.g. a parachutist with open canopy, from which they deduced that the speed and the displacement have to be a constant and a linear function then. The teacher added Eq. (11) on the whiteboard and called-up a student to model the limiting process. Then he called up another student to prove the equation. The student applied l´Hospital’s rule twice, which surprisingly gave Eq. (11) again. The case illustrated that routine approaches may not lead to the goal. Then, the class found the solution with the help of teacher’s questioning. Equations (14) and (15) were not proved as there was not enough time to familiarise the students with the formulae for calculating asymptotes. Finally, the teacher asked the students if they knew what inscriptions sinh, cosh and tanh stand for, e.g. on the Windows calculator. Nobody knew. The teacher introduced the formulas for hyperbolic sine, cosine and tangent, and rewrote Eq. (7) and (8) as Eq. (5) and (6).
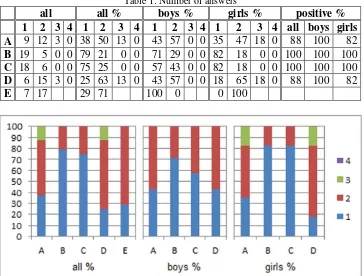
At the end of the lesson, the students answered the following questionnaire. The result is in Table 1 and Fig. 3. Answers 1 and 2 in questions A – D are positive ones.
A) The lesson was (1 = very; 2 = quite; 3 = little; 4 = not) interesting. B) The model helps to understand the notion of limit
(1 = a lot; 2 = quite a lot; 3 = little; 4 = not at all).
C) I understood (1 = all; 2 = majority; 3 = little; 4 = nothing) of the proofs. D) I learned (1 = a lot; 2 = quite a lot; 3 = little; 4 = nothing) in mathematics. E) I am a boy (1 = yes; 2 = no).
Table 1: Number of answers
all all % boys % girls % positive %
1 2 3 4 1 2 3 4 1 2 3 4 1 2 3 4 all boys girls
A 9 12 3 0 38 50 13 0 43 57 0 0 35 47 18 0 88 100 82
B 19 5 0 0 79 21 0 0 71 29 0 0 82 18 0 0 100 100 100
C 18 6 0 0 75 25 0 0 57 43 0 0 82 18 0 0 100 100 100
D 6 15 3 0 25 63 13 0 43 57 0 0 18 65 18 0 88 100 82
E 7 17 29 71 100 0 0 100
7 Summary and conclusions
The paper gave the result of an experiment in which 24 high school students calculated limits with real background and modelled the limiting process with an Excel application. The first three of the following five equalities that spring from free fall in the air were proved:
1 e
e e e 1 lim
0
B B
B B
B B ,
1 2
e e ln 2 lim
2
0
B B
B B ,
1 e
e e e
lim
B B
B B
B ,
1 2
e e ln 1
lim
B B
B B , and
ln e e
0lim
B
B B
B . The students answered a questionnaire. The result is that 88% found
the lesson very or quite interesting, 100% found the model a lot or quite a lot helpful to understand the notion of limit, 100% understood all or majority of the proofs, and 88% had the feeling that they learned a lot or quite a lot in mathematics. The result shows that even calculating limits can be interesting to high school students if the limits are not fabricated but have a real background and the limiting process is visualised with a non black-box application.
References
[1] Garner, R. (2014) Stem subjects are "dull and "boring" for teenagers, but they are vital for the economy. The Independent, 06 May 2014. Available at
http://www.independent.co.uk/student/news/stem-subjects-are-dull-and-boring-for-teenagers-but-they-are-vital-for-the-economy-9324372.html
[2] Yarker, M. B. and Park, S. (2012) Analysis of teaching resources for implementing an interdisciplinary approach in the K-12 Classroom. Eurasia Journal of Mathematics, Science & Technology Education,8(4), 223-232.
[3] Lawson, D. A. (1995) Bungee Jumping. Teaching Mathematics Applications, 14(1), 19-22.
[4] Lawson, D. A. (1999) Freefall parachute jumping. Teaching Mathematics Applications, 18(1), 15-19.
[5] Burt, D., Magnes, J., Schwarz, G. and Hartke, J. (2008) Discovering integration through a physical phenomenon. PRIMUS, 18(3), 283-290.
[6] Robinson, G. and Jovanoski, Z. (2010) Fighter pilot ejection study as an educational tool. Teaching Mathematics Applications, 29(4), 176-192.
[7] Robinson, C. L. (2012) Using sport to engage and motivate students to learn mathematics. Teaching Mathematics Applications, 31(1), 49-56.
[8] Uttal, D. H. and O’Doherty, K. (2008) Comprehending and learning from
‘visualizations’: a developmental perspective. Visualization: Theory and Practice in Science Education (J. K. Gilbert, M. Reiner and M. Nakhleh eds.). Dordrecht: Springer, pp. 53-72.
[9] Martinovic, D and Karadag, K. (2012) Dynamic and interactive mathematics learning environments: the case of teaching the limit concept. Teaching Mathematics Applications, 31(1), 41-48.
[10] Swerdlow, N. M. (2013) Galileo's mechanics of natural motion and projectiles. The Oxford Handbook of the History of Physics (J. Z. Buchwald and R. Fox eds.). Oxford: Oxford University Press, pp. 25-55.
[11] Halliday, D., Resnick, R. and Walker, R. (2011) Fundamentals of Physics, 9th ed. Hoboken: John Wiley & Sons, pp. 29, 121-123.
[12] Barger, V. and Olsson, M. (1973) Classical Mechanics: a Modern Perspective. New York: McGaw-Hill, pp. 8-11.
8 Spreadsheets in Education (eJSiE), Vol. 9, Iss. 3 [2016], Art. 3
[13] Greiner, W. (2004) Classical Mechanics. Point Particles and Relativity. New York: Springer, pp. 181-184.
[14] US Standard Atmosphere 1976. Washington D.C., October 1976, pp. 20.
[15] Thornton, S. T. and Marion, J. B. (2003) Classical Dynamics of Particles and Systems, 5th ed. Belmont (CA): Brooks/Cole, pp. 59.
[16] Timmerman, P. and van der Weele, J. P. (1999) On the rise and fall of a ball with linear or quadratic drag. Am. J. Phys., 67(6), 538 – 546.
[17] Polyanin, A. D. and Chernoutsan, A. I. (2011) A Concise Handbook of Mathematics, Physics, and Engineering Sciences. Boka Raton (FL): CRC Press, pp. 145.