Volume 11 Number 1 2012
Destination Branding and Its Influence on
Tourist’s Satisfaction and Loyalty
Abstract
Brand is known as a valuable asset as it enables to differentiate from competitors offerings as well as to generate positive perceptions in the consumers' mind. In the tourism sector, as part of winning competition, it is suggested that destination should also be branded. Destination brand is believed to enable a location to attract investment, business, and tourist which is then improving the local economy. The objective of this study is to empirically examine the structural model to understand the relationship between destination branding and behaviours in the tourism sector. Destination branding is built based on three elements namely destination image, perceived quality, and destination awareness while tourist loyalty is represented by tourist satisfaction and loyalty. By applying purposive sampling, 150 valid questionnaires were analysed using Partial Least Squares. Results indicate that there were positive influences between perceived quality and brand awareness to satisfaction whereas brand image had no significant influence on satisfaction. Further, satisfaction significantly influenced loyalty.
Keywords: destination branding, destination image, perceived quality, destination awareness, and tourists' behavior.
Abstrak
Brand dikenal sebagai asset perusahaan yang memungkinkan untuk memberikan pembedaan terhadap pesaing sekaligus sebagai pembangun citra positif terhadap pelanggan. Dalam sektor pariwisata, untuk menghadapi persaingan, suatu tempat sebaiknya juga memiliki merek (brand). Merek ini diharapkan mampu memberi daya tarik investasi, bisnis, dan wisatawan yang akan memperbaiki kondisi ekonomi daerah tujuan wisata. Tujuan dari studi ini untuk secara empiris menganalisis model structural dari brand tujuan wisata dan perilaku wisatawan. Brand tujuan wisata dibangun dari tiga komponen: citra tujuan wisata, persepsi kualitas, dan kesadaran merek. Perilaku wisatawan diwakili
Ratna Roostika Fakultas Ekonomi
Jurusan Manajemen, UPN “Veteran” Yogyakarta
J u r n a l M a n a j e m e n T e k n o l o g i
oleh komponen kepuasan dan loyalitas. Dengan menerapkan sampel purposive, diperoleh sampel yang valid sebanyak 150 responden. Hasil analisis menggunakan Partial Least Squares menunjukkan bahwa hanya persepsi kualitas dan kesadaran merek menunjukkan pengaruh signifikan terhadap kepuasan, sedang citra tujuan wisata tidak berpengaruh. Selain itu, kepuasan terhadap daerah tujuan wisata juga secara signifikan mempengaruhi loyalitas.
Kata kunci: merek tujuan wisata, citra tujuan wisata, persepsi kualitas, kesadaran merek dan perilaku wisatawan.
1. Introduction
The importance of the tourism industry has been increasingly critical to the economy of many countries. The success of many countries' economic development has caused the tourism business grows as a major international business. All destinations offer varieties of best attractions they could do, in which currently many destinations seemed to offer similar attractions. In other words, the broadening tourist opportunities and travel locations have resulted in lack of differentiation among many destinations. This makes decision to choose destination is difficult among tourists. It is important that tourism marketers as well as government be able to develop marketing strategy to enhance destination image and identity.
Just like other consumer products, it is undeniable that a destination has the need to be branded. A destination needs to create a unique identity to differentiate themselves from competitors (Morgan, et al., 2002). Branding is thought to be one of the most effective tools available for marketers to differentiate products or services. In facing the intense competition, brand is considered to be the most powerful marketing weapon and informational signal for destination marketers (Morgan & Pritchard, 2005). Considering its potential value, destination branding has been the subject of many academic studies, even though most of the literature concerns more on consumer goods (Cai, 2002). At the empirical level, there are many studies on destination image, however, studies on destination branding is a relatively new (Huh, 2006). In the tourism sectors, studies on branding in the destination marketing were less concerned than in general marketing areas (Cai, 2002).
Considering the limited numbers of studies in destination branding, analysing the relationships between destination branding and tourist behaviours is important. Based on the studies by Aaker (1991) and Keller (1993), which provide the components of brand equity, the components of destination brand are represented by destination image, perceived quality, and destination awareness. In the structural relationship model employed in this study, all these three components together are identified as brand destination construct. The influence of destination brand on tourist behavior (represented by tourist satisfaction and loyalty) is further analysed.
2. Tourism Sector in Yogyakarta
Tourism began to demonstrate its significance for Indonesia's economy in 1990 contributing to the third largest foreign exchange earner in the non-oil sector (Krisnandhi, 2010). Prior 1997, tourism in Indonesia had experienced a strong growth for a decade (before the economic and monetary crisis hit some Asian countries). After some years of a stagnant growth, from 2008, Indonesia's tourism is starting
3.2. Brand and Brand Equity
Aaker (1991) stated that tourism destinations, just like other consumer products, should brand themselves to identify and distinguish from others, and convey a positive message. According to American Marketing Association (2008), a brand can be defined as “a name, term, sign, symbol, or design, or combination of them which is intended to identify the goods and services of one seller or group of sellers and to differentiate them from those of competitors”. Brand signals to the consumer the source of the products and protects both the consumer and producer from competitors who have identical offerings (Huh, 2006).
Aaker (1991) introduced the concept of brand equity and his brand equity framework model has made him a pioneer in branding. His framework until recently provides the underlying theory of branding. Brand equity is “a set of brand assets or liabilities linked to a brand, its name and symbol, that add to or subtract from the value provided by a product or service to a firm and/or to that firm's customers” (Aaker, 1991). Aaker further identified five categories of assets and liabilities on which brand equity is based. These include brand loyalty, brand awareness, perceived quality, brand association, and other propriety brand assets.
By seeing from the perspective of the individual consumer, Keller (1993) introduced a different conceptual model of brand equity, namely customer-based brand equity. Customer-based brand equity is “the differential effect of brand knowledge on consumer response to the marketing of the brand”. Customer-based brand equity occurred when the consumer is familiar with the brand and held some favorable, strong, and unique brand associations in memory (Keller, 1993). Keller further characterised brand knowledge in terms of two constructs, namely brand awareness and brand image.
3.3. Destination Brand
Destination branding is a relatively new phenomenon. It did not begin to receive significant attention in the tourism sector until the late 1990's (Tasci & Kozak, 2006). Based on Aaker's (1991) definition of a brand, Ritchie and Ritchie (1998, p.103) defined a destination brand as “a name, symbol, logo, word mark or other graphic that both identified and differentiated the destination; furthermore, it conveyed the promise of a memorable travel experience that was uniquely associated with the destination; it also served to consolidate and reinforce the recollection of pleasurable memories of the destination experience”. A destination brand offers tourists and providers many benefits, differentiate from competitors, and build expectations from experience offered by a destination (Murphy, et al., 2007). Destination brand can also influence post-trip perceptions of experience (Ritchie & Ritchie, 1998).
Brands are often chosen with respect to consumer's lifestyle or status. Similar to expensive cars, perfumes, or luxury goods, these products are used to “communicate, reflect, and reinforce associations, statements, and group memberships” (Morgan & Pritchard, 2005, p.19). Tourists in this regards use their trips as expression devices for their self actualization. Anholt (2002) argues that nation brands can also provide trust, quality, and lifestyle connotations that consumers could associate with themselves. Anholt (2002) suggested that every country should be able to effectively utilize its brand and capitalize on consumers' perception of destination. Morgan, et al. (2003) explored New Zealand brand and its political processes for successful brand management and found that success on destination brand depends on public and private sector stakeholders.
to have a recovery recording an increase of 14 percent from 2007 (BPS, 2008). Although increasing, the number of international arrivals to Indonesia is still surpassed by its close competitors in the Southeast Asian region, such as Malaysia, Thailand, and Singapore. In 2008, Malaysia recorded 22.05 million arrivals followed by Thailand with 14.54 million, and Singapore with 10.1 million arrivals (Muqbil, 2008 in Krisnandhi, 2010).
Yogyakarta is one of Indonesia's main tourist destinations. In 2011, Yogyakarta received Indonesian Tourism Award as the best Province in the Tourism Development. The numbers of tourists visiting Yogyakarta are increasing slightly from 2006-2010 (see Table 1). For Yogyakarta, the tourism industry is one of the most important sectors. Yogyakarta is ranked fourth as a tourist destination area in Indonesia, following Bali, Jakarta, and Batam (Krisnandhi, 2010). As major tourist's destination, Yogyakarta offers tangible and intangible tourist products.
The tangible offerings include various temples (Prambanan, Boko, etc), various traditional buildings and handcrafts such as batik and ceramics. The intangible cultures include traditional ceremonies, festivals, theatres, and dances. These historical and cultural heritages have become the major tourist attractions for both international and local tourists. Most of the tourists go to the temples followed by the Sultan's Palace in the heart of the city and Malioboro (a famous shopping destination). Local visitors prefer Malioboro and other shopping or culinary areas. There also a recent trend among local tourism with spending leisure on Desa Wisata (Tourism Village), enjoying rural way of life.
Table 1. The Growth of Tourism in Yogyakarta 2006-2010
Int’l visitors Growth Local visitors Growth Total visitors Growth
2006 78,145 -24.49 836,682 -13.52 914,827 -14.58
3. Theoretical Background and Hypotheses
3.1. Signaling Theory
The marketing literature has recorded a large variety of market signals. Rao et al. (1999) regarded a signal as an action that firms could take to convey credible information about unobservable product quality to the consumers. Elements of marketing mix have been mostly examined when dealing with firms' signaling to consumers such as advertising, warranties, retailer choice, etc (Huh, 2006). Under information asymmetry and imperfect information, brands also can serve as a signal of unobservable quality (Rao, et al., 1999).
J u r n a l M a n a j e m e n T e k n o l o g i
J u r n a l M a n a j e m e n T e k n o l o g i
3.4. Destination Image
Destination image is important because of the role it plays in the potential tourists' decision-making processes. Cai (2002) defines “image of a destination brand is perceptions about the place as reflected by the associations held in tourist's memory”. Destination image generally refers to “the sum of beliefs, ideas, and impressions that a person has of a destination” (Crompton, 1979, p.18 in Huh, 2006). Baloglu (2001) considers image as being the consequence of two components: the perceptive/cognitive evaluation (represents the tourist's own knowledge and beliefs about the object) and affective appraisals (represents the tourist's feelings toward the object). Milman & Pizam (1995) suggested that destination image consisted of three components namely the product, the behavior, and the environment. Moutinho (1987) distinguished three components of image formation, namely level of knowledge about the destination, beliefs and attitudes associated with the product, and the expectations created by the product.
Destination image is crucial for decision making process because image is often seen as a mental picture formed by a set of attributes that defined the destination and provide a strong influence on tourist behavior (Beerli & Martin, 2004). Further, Beerli & Martin (2004) argued that the influence of destination image on tourist satisfaction and intention to revisit is depending on the destination's capacity to provide experiences. Focusing on the relationship between the destination image, quality, satisfaction, and tourists' behavioral intention, Bigne et al. (2001) confirmed that a destination image had a positive influence on tourists' satisfaction as well as tourist loyalty. Lin, et al. (2007) stated that destination image plays a vital role in shaping tourists' preferences and decisions to visit particular destinations. The destination image components (cognitive, affective and overall destination images) are found to be the antecedents of tourists' destination preferences (Lin, et al., 2007). Based on the reviews, this study proposes this following hypothesis:
H1: Destination image as part of destination branding has a direct positive influence on tourist satisfaction.
3.5. Perceived Quality
Perceived quality can be defined as “the customer's perception of the overall quality or superiority of a product or service with respect to its intended purpose, relative to alternatives” (Aaker, 1991, P.85). Perceived quality in the tourism sector can be adopted from the conceptualization of service quality, as tourism is fundamentally a service business. The literature on tourism perceived quality in this section is therefore reviews concepts and dimensions of service quality. The early conceptualizations of service quality were commonly based on the disconfirmation paradigm employed in the physical goods (Gronroos, 1982; Parasuraman, et al., 1988).
Quality is a result from a comparison of perceived with expected performance. The confirmation paradigm is also used as the basis of Parasuraman, et al.'s (1988) SERVQUAL model, which views service quality as the gap between the expected level of service and perceptions of the service received. Cronin and Taylor (1992) on the other hand suggested their performance-based measure, deleting the expectation measurement. Many researchers in both marketing and hospitality have studied the relationship between perceived quality and customer satisfaction (Ekinci, 2003). Most of these studies proposed that perceived quality and satisfaction were distinct constructs, and there was a causal
relationship between two constructs, which, in turn, influenced customer's future purchase behavior. Especially, in tourism, many studies (Petrick, 2002) explained that perceived quality has a positive influence on tourists' satisfaction, as well as that perceived quality is an antecedent of both satisfaction and loyalty. Based on these studies, the following hypothesis is proposed:
H2: Perceived quality as part of destination branding has a direct positive influence on tourist satisfaction.
3.6. Brand Awareness
Keller (1993) explained that there are three reasons why brand awareness plays an important role in consumer decision making. 1). it is important that consumers think of the brand when they think about the product category. Raising brand awareness increases the likelihood that the brand will be a member of the consideration set; 2). brand awareness can affect decisions about the brands in the consideration set, even though there are essentially no other brand associations. 3). brand awareness affects consumer decision-making by influencing the formation and strength of brand association in the brand image.
In the context of product, Aaker (1991) defined brand awareness as the ability of a potential buyer to recognize or recall, that a brand is a member of a certain product category. Keller (1993) explained that brand awareness derives from brand recognition and brand recall. Brand recognition is the consumers' ability to confirm prior exposures to the brand when given the brand as a cue. Brand recall is defined as consumers' ability to retrieve the brand when given the product category. In other words, brand recall requires that consumers correctly generate the brand from memory. Brand recognition provides the brand with a sense of familiarity which can sometimes lead to buying decision (Aaker, 1991).
Familiarity has been regarded by experts in marketing as one component of the consumer knowledge construct (Cordell, 1997). Park & Lessing (1981) explained that familiarity of consumers has been considered as an important factor in consumer decision-making. In tourism context, familiarity of tourists with a destination was likely to influence tourists' behavior and decision-making (Gursoy, 2001 in Huh, 2006). In order to measure familiarity, Baloglu (2001) developed a destination familiarity index as a composite of experiential (previous experience) and informational familiarity. Baloglu (2001) studies revealed and found positive relationships among the familiarity with destination (destination awareness), destination image, tourist satisfaction, and further ourist loyalty. Therefore, this study proposes:
H3: Destination awareness as part of destination branding has a direct positive influence on tourist satisfaction.
3.7. Customer Satisfaction
In tourism context, satisfaction is primarily referred to as a function of pre-travel expectations and post-travel experiences. Many studies in the marketing and tourism literature concluded that customer satisfaction had a positive influence on customer loyalty, and that loyalty was a consequence of customer satisfaction (Baker & Crompton, 2000; Yoon & Uysal, 2005). Baker & Crompton (2000) found that highly satisfied tourists were more loyal, increasing the probability that they would return and that they would spread positive word-of-mouth.
H4: Tourist satisfaction has a significant positive influence on tourist loyalty.
3.8. Loyalty
The ultimate goal for service providers and retailers is to ensure that customers will revisit and repurchase, and even to recommend, which are the characteristics of loyal customers. It is believed that ability to retain existing customers has a much lower cost than winning new ones. Loyal customers tend to recommend friends, relatives or other potential customers. In this case, they act as free agents for word-of-mouth (WOM) advertising. In the tourism context, there is a high dependency on WOM information as the base for decision making. This WOM information is logical because of the experiential nature of services, where WOM communications are viewed as a more reliable and trustworthy sources of information. Consequently, WOM is commonly used as the primary sources by which consumers gather information about services (Bolton & Drew 1991).
Loyalty can be defined and assessed by both attitudinal and behavioural measures. Oliver (1999) stated that the attitudinal perspective refers to a specific desire to continue a relationship with a service provider, while the behavioral perspective refers to the concept of repeat patronage. Oliver (1999) used the cognitive-affective-conation pattern in order to explain loyalty. Yoon & Uysal (2005) measured the destination loyalty by using a composite approach which was an integration of the behavioral and attitudinal approaches. Jacoby and Chestnut (1978) in Huh (2006) distinguished three approaches of brand loyalty, including a behavioral approach, an attitudinal approach, and a composite approach. Gallarza and Saura (2006) found moderate to strong links between value, satisfaction and loyalty in the tourism sector. They suggested that their study should be replicated in different tourism contexts. This study adopts Jacoby and Chestnut (1978) attitude and behavioural approach. Based on the above literatures, this study proposes:
4. Research Methodology
4.1. Measures
This study develops and empirically tests a destination branding and customer behavior relationships as well as their relevant components from the perspectives of tourists. Based on the abovementioned literature review, this study adopts three dimensions of destination branding namely perceived quality, destination image, and destination awareness. Following the study of destination image from Beerli & Martin (2004) and Huh (2006), this study adopts some items of cognitive image and affective image. Ten items consisted of six cognitive aspects and four affective aspects were adopted from Huh (2006). Perceived quality (6 items) was adopted based on perceived quality as developed in Petrick's SERPERVAL scale. Destination awareness (7 items) was measured by destination recognition (familiarity) and destination recall following Huh (2006) study.
Satisfaction (7 items) was adopted from Huh (2006) and Cronin, et al. (2000). Loyalty (5 items) was from Huh (2006) study. Likert scales (ranging from 1 to 5), with anchors ranging from ''strongly disagree'' to ''strongly agree'' were used for all questions. After pre-testing the measures, these items were slightly reviewed and modified to accommodate suggestions received during the pre-testing stage.
4.2. Sample and Data
Data were collected from three different locations: Adisutjipto Airport, Tugu Train Station and Prambanan Temple. The reason for choosing these places is mainly to ensure that respondents are visitors (not local citizens), so that the research objectives on understanding the perceptions of visitors/tourists on particular destinations can be obtained. The population is all visitors who came to Yogyakarta. Sample in this study is some of the passengers as visitors/tourists who had been travelling around Yogyakarta. More specifically, respondents should be visitors that already have experiences with travelling in Yogyakarta. Therefore, the sampling method applied is non probability purposive sampling.
4.3. Data Analysis
Given the existence of mediating variable which cannot simply be assessed using multiple regression, PLS (Partial Least Squares) was chosen. Also, there is a tendency for the data to be negatively skewed in the customer satisfaction measurement and study involving perceptions (Anderson & Fornell, 2000). PLS can accommodate this nature of data since PLS does not require normally distributed data. PLS method was used because of its robustness against distributional constraints as compared to covariance-based analysis methods (e.g. AMOS or LISREL) (Chin, 1998). In order to assess the statistical significance, Smart PLS (Ringle, et. Al., 2005) was used with bootstrap analysis using 200 sub-samples. The use of PLS has received support from literature in satisfaction studies (Westlund, et al., 2001).
4.4. Descriptive Analysis
Out of the total 150 valid data, 55.3% respondents were male and 44.7% female. Majority of the respondents were more than 20 years old recorded with 20-30 years old 38.7%, 30-40 years old 34%, and over 40 years old 26%. The employment backgrounds of the respondents were 61.3% from public sectors, 36.3% from non public sector and the rests were others. Based on the descriptive data, respondents data collected from the Adisutjipto Airport, Tugu Train Station, and Prambanan Temple were majority young to middle age independent visitors. The reasons for visiting Yogyakarta were mostly for seeking relaxation, peaceful feeling, friendliness of the local and delight. There were varieties of perception when it comes to the questions on images of Yogyakarta ranging from 'destination with high respect and courtesy', 'friendliness', 'monarchy', 'historical', and 'education'.
4.5. Assessments of Validity and Reliability
J u r n a l M a n a j e m e n T e k n o l o g i
J u r n a l M a n a j e m e n T e k n o l o g i
Loading value over 0.6 is still excepted (Fornell & Larcker, 1981). ICR ranged from 0.8895 to 0.9347 which were within the recommended value of 0.80 (Nunnally, 1978) (see Table 2). All the AVE scores were above the 0.5 score, as recommended by Fornell & Larcker (1981). The cross loadings showed that each indicator also loaded higher with its corresponding latent variable. (see Table 3)
The last procedure, the square root of the AVE, was demonstrated by comparing the square root of the AVE for each constructs with the correlations between the construct and other constructs in the model. The evidence of discriminant validity is shown when the square root of the AVE of each construct is larger than the correlations between the construct and any other constructs (Staples, et al., 1999). The square root of AVE in this study have also shown a satisfactory level where all larger than the correlations between the construct and any other constructs (see Table 4).
2
Sattisfaction 0.6314 0.7294 0.7244 0.7397 0.8161 Table 3. Cross loadings
5. Discussions and Implications
5.1. Discussions
Findings from the empirical analysis show that: First, H1 is not supported. This means that the finding does not support the previous research such as: Beerli & Martin (2004) who argued that the destination image influences tourist satisfaction and intention to repeat the visit in the future. Other previous studies with similar findings were Binge, et al. (2001) and Lin, et al. (2007), confirming that a destination image had a positive influence on tourists' satisfaction as well as tourist loyalty.
This study unfortunately did not separate the destination image variables as two affective and cognitive variables. Since the result is not significant, further analysis need to be done concerning which variables that does not influence satisfaction. Considering that the destination image is not significant, this implies BImage Bawarr PQual Sat Loyalty
Very peaceful 0.7769 0.5069 0.457 0.5146 0.4712
Arousing 0.801 0.5246 0.4139 0.4612 0.3959
Very safe 0.7323 0.4654 0.3237 0.3639 0.3448
Beauty of the destination 0.6446 0.2944 0.2317 0.2586 0.2424
Standard cleanliness 0.7483 0.5118 0.5264 0.5826 0.4977
Friendly people 0.763 0.518 0.4429 0.4549 0.3437
Family oriented 0.7528 0.4034 0.3838 0.436 0.3621
Very pleasing 0.8386 0.5127 0.538 0.531 0.3528
Interesting destination 0.7968 0.5309 0.528 0.5529 0.4057
Very relax 0.7176 0.4614 0.3848 0.4919 0.3743
Familiar with the destination 0.4056 0.6876 0.3647 0.473 0.4676
Have a great deal about location 0.5693 0.752 0.4933 0.5217 0.4563
Destination is recognisable 0.5241 0.8038 0.519 0.5474 0.5133
Destination is famous 0.5603 0.8034 0.5343 0.5609 0.4902
This destination comes to my mind first 0.448 0.8406 0.5817 0.6491 0.5885
I can easily recall this destination 0.4836 0.821 0.4911 0.611 0.6003
Destination characteristics come to my mind
quickly 0.5278 0.8182 0.5806 0.6462 0.5822
The quality of this destination is outstanding 0.4209 0.4448 0.7164 0.4931 0.4478
The quality of this destination is reliable 0.383 0.4828 0.7048 0.5598 0.5259
The quality of this destination is dependable 0.4303 0.5288 0.7098 0.5237 0.4518
The quality of this destination is consistent 0.461 0.4684 0.7991 0.5987 0.3835
The quality of this destination is of high
standard 0.4642 0.4196 0.8143 0.5603 0.342
The quality of this destination is favourable 0.456 0.5975 0.7923 0.6129 0.4515
Provides much more benefit than costs 0.5089 0.6237 0.5255 0.7542 0.5928
Better than what I expected. 0.5108 0.6136 0.5981 0.8232 0.6475
One of the best among other 0.4836 0.4872 0.5092 0.7868 0.5296
Satisfied with the destination 0.5498 0.6537 0.6266 0.8638 0.5871
Satisfied with the standard offered 0.5092 0.5307 0.673 0.8327 0.5212
A good choice 0.5324 0.5999 0.6877 0.8151 0.5881
Satisfied with the services 0.5081 0.6381 0.5942 0.8326 0.6566
Revisit in the future 0.4595 0.6784 0.5292 0.6082 0.7984
Recommends to others 0.4221 0.5852 0.4776 0.6015 0.866
Encourages family/friends to visit 0.494 0.5908 0.5119 0.6474 0.9175
Willing to pay higher price 0.3471 0.4754 0.4275 0.5821 0.8293
Table 4. AVE Square Root
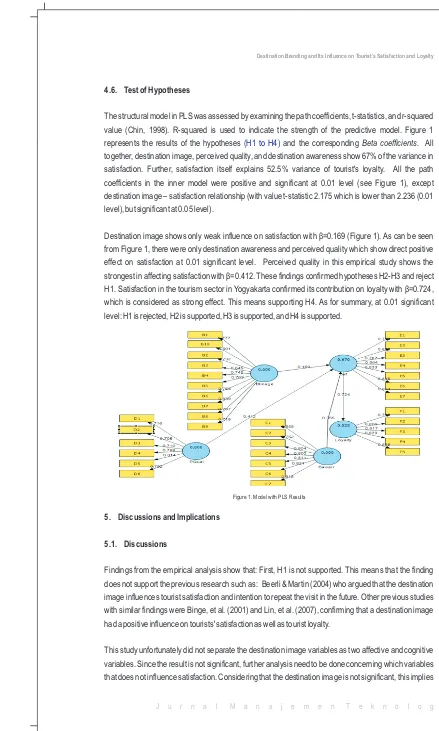
4.6. Test of Hypotheses
The structural model in PLS was assessed by examining the path coefficients, t-statistics, and r-squared value (Chin, 1998). R-squared is used to indicate the strength of the predictive model. Figure 1 represents the results of the hypotheses and the corresponding Beta coefficients. All together, destination image, perceived quality, and destination awareness show 67% of the variance in satisfaction. Further, satisfaction itself explains 52.5% variance of tourist's loyalty. All the path coefficients in the inner model were positive and significant at 0.01 level (see Figure 1), except destination image – satisfaction relationship (with value t-statistic 2.175 which is lower than 2.236 (0.01 level), but significant at 0.05 level).
Destination image shows only weak influence on satisfaction with â=0.169 (Figure 1). As can be seen from Figure 1, there were only destination awareness and perceived quality which show direct positive effect on satisfaction at 0.01 significant level. Perceived quality in this empirical study shows the strongest in affecting satisfaction with â=0.412. These findings confirmed hypotheses H2-H3 and reject
H1. Satisfaction in the tourism sector in Yogyakarta confirmed its contribution on loyalty with â=0.724,
which is considered as strong effect. This means supporting H4. As for summary, at 0.01 significant
(satisfaction and loyalty) in the tourism sector. Huh (2006) contented that study on destination branding is a relatively new concept and there have been no apparent efforts in distinguishing between the formation of destination image and destination branding. By adopting Huh (2006) conceptualization on destination brand (which was built on three key components: destination image, perceived quality, and destination awareness), this study makes a contribution by empirically testing Huh (2006) conceptual model in different location thus different culture and tourists behaviours.
Indonesia, has a variety of cultures, languages, and economic backgrounds. Thus, the findings of this study enrich the previous Huh (2006) study where it provides different perspectives as well as validating whether the model adopted in this study can be generalised in different geographical locations. Finding was in some part different. This is certainly related to the capacity of the destinations to offer the best interest for the visitors. Moreover, since it is not easy to control people's perception as well as limitation of sample selection, results from this study should be carefully comprehended.
6. Conclusion, Limitations and Future Research
6.1. Conclusion
This study analysed a model which previously developed by Huh (2006). It provides an integrated approach to understanding the relationship between destination branding and tourists' behaviors. More specifically, the model was developed in an attempt to extend the theoretical and empirical evidence about the structural relationships among these following constructs: destination image, perceived quality, destination awareness (as elements of destination branding), and tourist satisfaction and tourist loyalty (as elements of tourist behaviors). The model was analysed in the tourism sector in hoping to contribute to support destination marketers to build more competitive tourism destinations. The PLS analysis confirmed the positive influence of perceived quality and destination awareness on satisfaction, but not between destination image and satisfaction.
Satisfaction as generally believed in marketing literature had positive influence on tourists' loyalty. Therefore, satisfaction can be said mediating the relationship between destination brand and loyalty. Seeing from the big picture, this study reminds us the importance of intangible aspects of marketing strategy which is brand value. When competition is intense and product/services are similar among others, brand is the power to win the competition. The results from this study provide evidences that components of brand destination do play significant role in generating tourists' satisfaction therefore loyalty and other positive behaviours. Nevertheless, researcher also acknowledges some weaknesses in this study in particular with regards to the limitation of sample selection in Yogyakarta.
6.2. Limitations and Future Research
As with any study, this study also has its limitations. First the limitation came from the selection of sample and limited geographical coverage. The sample was majority came from the local residents of Yogyakarta, and sample was only taken from the three selected areas. This limits the generalization that could be made from this study. Future research could consider the addition of geographical coverage such as other main tourism areas (Bali, Medan, Jakarta, etc). Gathering data from both local and international visitors would also enrich the findings and information necessary for improving the that visitors view items of destination image as lack of differentiation from image of other destinations
such as providing peace, security, beautiful location, friendly people, excitement, etc. This suggests that government and those who are in tourism business aware of the distinct image that Yogyakarta should have thus differentiating from other tourism destinations. Second, H2 is supported. Perceived quality positively influenced satisfaction.
This finding supports previous finding on common marketing theories and in tourism sector such as Baker and Crompton (2000); Cronin, et al. (2000); Gallarza and Saura (2006); Petrick (2002). Having the strongest path coefficient, this informs us that quality is critically important for tourists' satisfaction. Providing reliability, favourability, consistency, dependability, etc is of highly crucial in service business. Third, H3 is supported. This means that awareness does matter in contributing tourists' satisfaction. A feeling of being familiar with previous experiences, being visible as tourists' destinations, being unique in characteristics so that a destination can be easily recall, etc would affect satisfaction. For tourism business, building awareness consistently is effective in influencing satisfaction.
Fourth, H4 is supported. Having a strong influence, satisfaction in tourism sector in Yogyakarta does confirm the classical findings where satisfaction positively influences loyalty. This result is in align with previous findings from e.g. Oppermann (2000); Baker and Crompton (2000); Beerli & Martin (2004);Cronin, et al. 2000; Ekinci 2003; Gallarza & Saura (2006); Petrick (2002). Overall, in order to reach the objective of every business where customers will comeback, loyal, and even promoting and recommending others, being brand oriented is important to generate satisfaction as it will influence loyalty.
5.2. Implications
This study has practical and theoretical contributions. Changes and competition in the tourism industry means that branding in tourism destinations has to be strategically managed. This is because destination branding enables tourists to identify the destination image, perceived quality, and destination awareness, and further generates satisfaction and loyalty. The findings help destination marketers in building better competitive marketing strategy on destinations. Governments and destination marketers should be proactive in taking a serious approach to built destination image, awareness, and quality. Marketing efforts should be directed to build destination brand.
This can be done by being customer oriented which means that proactively finding information on what customers needs and wants. From this information, quality can be improved, and thus image will be positive. In order to generate awareness, government and destination marketers need to be consistently built network and relationships to potential parties (e.g. information offices, electronic media, public relations, travel agents and tour operators, promotional instruments, and Internet-based promotional agent). Business-to-business and government-to-government relationships should be proactively endorsed to promote destination. Considering that word-of-mouth is vital in service sector, the efforts of destination marketers should aim at providing experiences that will result in improved image and awareness.
J u r n a l M a n a j e m e n T e k n o l o g i J u r n a l M a n a j e m e n T e k n o l o g i
implications of this study. Furthermore, not limiting visitors who came only for leisure, thus expanding to business visitors, conference, contest, or sports competition, could provide different perspectives on destination branding. Second, this study employed limited section of indicators, variables, and constructs. Other variables and constructs could be useful to explain satisfaction and loyalty such as customer value, trust, destination personality, destination attachment, etc. The limitations mentioned should be considered as essential suggestions for future research.
References
Aaker, D. (1991). Managing Brand Equity. New York: Free Press.
Anderson, E.W., and Fornell, C. (2000). Foundations of The American Customer Satisfaction Index. Total Quality Management 11(7): 869-882.
American Marketing Association. (2008). Marketing Terms Dictionary, Retrieved May 1, 2011 from http://www.marketingpower.com/_layouts/Dictionary.aspx.
Anholt, S. (2002). Nation-brand and The Value Of Provenance, Destination Branding: Creating the
st
Unique Destination Proposition. 1 Ed, Elsevier Ltd. Oxford.
Baker, D.A., and Crompton, J.L. (2000). Quality, Satisfaction and Behavioral Intentions. Annals of Tourism Research 27(3): 785-804.
Baloglu, S. (2001). Image Variation of Turkey By Familiarity Index: Informational and Experimental Dimensions. Tourism Management 22: 127-133.
Beerli, A., and Martin, J.D. (2004). Tourists' Characteristics and The Perceived Image of Tourist Destinations: A Quantitative Analysis-A Case Study of Lanzarote, Spain. Tourism Management 25(5): 623-636
Bolton, R.N., and Drew, J.H. (1991). A Multistage Model of Customers' Assessment of Service Quality and Value. Journal of Consumer Research 17(4): 375-384.
Bigne, J.E., Sanchez, M.I., and Sanchez, J. (2001). Tourism Image, Evaluation Variables and After Purchase Behavior: Inter-Relationship. Tourism Management 22: 607-616.
BPS. (2008). BPS – Central Bureau of Statistics 2008. Tourism Statistics
Cai, L.A. (2002). Cooperative Branding for Rural Destination. Annals of Tourism Research 29(3): 720-742.
Chin, W.W. (1998). The Partial Least Square Approach to Structural Equation Modeling. In Marcoulides GA (Ed), Modern methods for business research: 295-336. New Jersey, Mahwah, London, Lawrence Erlbaum Associates.
Cordell, V.V. (1997). Consumer Knowledge Measures as Predictors in Product Evaluation. Psychology and Marketing 14(3): 241-260.
Cronin, J.J. and Taylor, S.A. (1992). Measuring Service Quality: Reexamination and Extension. Journal of Marketing 56(3): 55-68.
Cronin, J.J., Brady, M.K., and Hult, G.T.M. (2000). Assessing the Effects of Quality, Value, and Customer Satisfaction on Consumer Behavioural Intentions in Service Environments. Journal of Retailing 76(2): 193-218.
Ekinci, Y. (2003). Which Comparison Standard Should Be Used for Service Quality and Customer Satisfaction? Journal of Quality Assurance in Hospitality & Tourism 4(¾): 61-75.
Fornell, C., and Larcker, D. (1981). Evaluating Structural Equation Models with Unobservable Variables and Measurement Error. Journal of Marketing Research 19: 440-452.
Gallarza, M.G., and Saura, I.G. (2006). Value Dimensions, Perceived Value, Satisfaction and Loyalty: an Investigation of University Students' Travel Behaviour. Tourism Management 27: 437–452. Gronroos, C. (1982). An Applied Service Marketing Theory. European Journal of Marketing 16: 30-41. Huh, J. (2006). Destination branding as an informational signal and its influence on satisfaction and
loyalty in the leisure tourism market, Published PhD Dissertation, Faculty of the Virginia Polytechnic Institute and State University.
Keller, L.L. (1993). Conceptualizing, Measuring, and Managing Customer-Based Brand Equity. Journal of Marketing 57 Jan: 1-22.
Kotler, P., and Gertner, D. (2002). The Country as Brand, Product and Beyond: a Place Marketing and Brand Management Perspective. Brand Management 9(4/5): 249-261.
Krisnandhi, K.D.R. (2010). Socio-economic Impacts of Tourism on a World Heritage Site: Case Study of Rural Borobudur, Indonesia, Published Phd Thesis, Graduate School of International, Development, Nagoya University.
Lin, C., Morais, D., Kersetter, D., and Hou, J. (2007). Examining the Role of Cognitive and Affective Image in Predicting Choice Across Natural, Developed, and Theme Park Destinations. Journal of Travel Research 46: 183-194.
Milman, A., and Pizam, A. (1995). The Role of Awareness and Familiarity With a Destination: The Central Florida Case. Journal of Travel Research 33(3): 21-27.
Morgan, N., and Pritchard, A. (2005). Promoting Niche Destination Brands: Case Studies of New Zealand and Wales. Journal of Promotion Management 12(1): 1733.
Morgan, N., Pritchard, A., and Piggot, R. (2003). New Zealand, 100% pure, The Creation of A Powerful Niche Destination Brand. Brand Management 9(4/5): 335-354.
Murphy, L., Moscardo, G., and Benckendorff, P. (2007). Using Brand Personality to Differentiate Regional Tourism Destinations. Journal of Travel Research 46(5): 514.
Moutinho, L. (1987). Consumer Behavior in Tourism. European Journal of Marketing 21(1): 3-44. Oliver, R.L. (1999). Whence Consumer Loyalty? Journal of Marketing 63: 33–44.
Oppermann, M. (2000). Tourism Destination Loyalty. Journal of Travel Research 39(1): 78-84. Nunally, J.C. (1978). Psychometric Theory, 2nd edn, McGraw-Hill, NY.
Parasuraman, A., Zeithaml, V.A., and Berry, L. (1988). SERVQUAL: A Multiple-Item Scale for Measuring Consumer Perceptions of Service Quality. Journal of Retailing 64(1): 12-40.
Park, C.W., and Lessing, V.P. (1981). Familiarity and Its Impact on Consumer Decision Biases and Heuristics. Journal of Consumer Research 8(Sep): 223-230.
Petrick, J.F., (2002). Development of a Multi-Dimensional Scale for Measuring the Perceived Value Of A Service. Journal of Leisure Research 34(2): 119-134.
Rao, A.R., Qu, L., and Ruekert, R.W. (1999). Signaling Unobservable Product Quality through a Brand Ally. Journal of Marketing Research 36(May): 258-268.
rd
Ringle, C.M., Wende, S., and Will, A. (2005). Smart-PLS retrieved March 23 2006, from http:/www.smartpls.de/forum/
Ritchie, J., and Ritchie, R. (1998). Destination Marketing. International Association of Scientific Experts in Tourism Report 40: 89–116.
Staples, D.S., Hulland, J.S., and Higgins, C.A. (1999). A Self-Efficacy Theory Explanation for the Management of Remote Workers in Virtual Organisations. Organisation Science 10(6): 758-776.
Westlund, A.H., Cassel, C.M., Eklof, J., and Hackl, P. (2001). Structural Analysis and Measurement of Customer Perceptions, Assuming Measurement and Specification Errors. Total Quality Management 12(7/8): 873-881.
www.visitingjogja.com. Dinas Pariwisata Provinsi DIY