CHAPTER IV
DATA PRESENTATION AND ITS FINDING
A. Data Presentation and Research Finding Related to the Research Problems In this chapter the writer discuses about data presentation and research finding
related to the research problem (Consist of Validity, Reliability, Index, Difficulty,
Effectiveness Distracter, Quality of Multiple Choice item, fill the blank item, and
translate item), and discussion.
1. Validity of Test Item a. Validity
The test is to have face validity if the instruction of the test is understood by
the students. The writer has found that the instruction used on summative test at the
tenth grade of SMAN TIMPAH in second semester has fulfilled validity.
Table 4.1 Validity
No Instruction of the Item Number of Item Criteria 1. Question 1 – 30.
Fill the blank with using ON, IN, or AT for
each number.
1 – 20. Valid
2. 1 – 10.
Choose the correct answer A, B, C, or D for
each number.
3. 1 – 10.
Translate to English Language with using
ON, IN, and AT.
1 – 10. Valid
Based on the table above, it can be concluded that all the instructions of the
test are valid. It is all the instructions can be understood by the students.
b. Validity Test
The validity test of English fill the blank test item that is made by the English
teacher can be determine by using formula namely Point Biserial.
q p S
M M = γ
t t p pbi
Where:
γp b i = coefficient validity of each item
Mp = mean of the right answer
Mt = mean of the total score
S = standard deviation from the total score
P = proportion of the students correct answer for each item
siswa seluruh jumlah
benar menjawab siswa
banyaknya =
p
The interpretation of correlation of coeffient about Validityis:
Between = 0,800 - 1,00: very high (perfect)
Between= 0,600 - 0,80: high
Between= 0,400 - 0,600 : fair
Between = 0,200 - 0,400 : low
Between = 0,00 - 0,200 : no correlation
The criteria a certain item of validity if = r
pbis
≥ 0,40.
Determining the validity of the best items, first make a score table that has
been achived by the student from item no 1 until 30 from 24 students. To be more
clearly look at the following table :
Example for Validity item: 1 1 37 37
1 36 36
1 36 36
1 36 36
1 36 36
1 33 33
1 33 33
1 31 31
Based on the example the coefficient of validity is 0,04. So, it is not valid.
With the same way or method to be more clearly look at the following table:
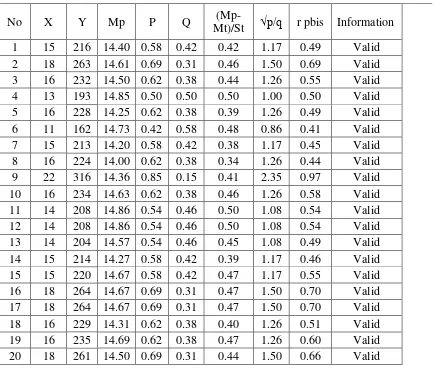
Table 4.2
Table for Questions fill the blank (XA)
No X Y Mp P Q
(Mp-Mt)/St √p/q r pbis Information
1 15 216 14.40 0.58 0.42 0.42 1.17 0.49 Valid 2 18 263 14.61 0.69 0.31 0.46 1.50 0.69 Valid 3 16 232 14.50 0.62 0.38 0.44 1.26 0.55 Valid 4 13 193 14.85 0.50 0.50 0.50 1.00 0.50 Valid 5 16 228 14.25 0.62 0.38 0.39 1.26 0.49 Valid 6 11 162 14.73 0.42 0.58 0.48 0.86 0.41 Valid 7 15 213 14.20 0.58 0.42 0.38 1.17 0.45 Valid 8 16 224 14.00 0.62 0.38 0.34 1.26 0.44 Valid 9 22 316 14.36 0.85 0.15 0.41 2.35 0.97 Valid 10 16 234 14.63 0.62 0.38 0.46 1.26 0.58 Valid 11 14 208 14.86 0.54 0.46 0.50 1.08 0.54 Valid 12 14 208 14.86 0.54 0.46 0.50 1.08 0.54 Valid 13 14 204 14.57 0.54 0.46 0.45 1.08 0.49 Valid 14 15 214 14.27 0.58 0.42 0.39 1.17 0.46 Valid 15 15 220 14.67 0.58 0.42 0.47 1.17 0.55 Valid 16 18 264 14.67 0.69 0.31 0.47 1.50 0.70 Valid 17 18 264 14.67 0.69 0.31 0.47 1.50 0.70 Valid 18 16 229 14.31 0.62 0.38 0.40 1.26 0.51 Valid 19 16 235 14.69 0.62 0.38 0.47 1.26 0.60 Valid 20 18 261 14.50 0.69 0.31 0.44 1.50 0.66 Valid
Based on the table all of item is valid and can be uses for pre – test and post -
Table 4.3
Table for Questions multiple choices (XA)
No X Y Mp p Q (Mp-Mt)/St √p/q r pbis Information
1 13 83 6.38 0.50 0.50 0.62 1.00 0.62 Valid 2 4 34 8.50 0.15 0.85 1.35 0.43 0.57 Valid 3 16 99 6.19 0.62 0.38 0.55 1.26 0.70 Valid 4 15 95 6.33 0.58 0.42 0.60 1.17 0.70 Valid 5 17 93 5.47 0.65 0.35 0.31 1.37 0.42 Valid 6 14 93 6.64 0.54 0.46 0.71 1.08 0.77 Valid 7 11 71 6.45 0.42 0.58 0.64 0.86 0.55 Valid 8 10 66 6.60 0.38 0.62 0.69 0.79 0.55 Valid 9 7 57 8.14 0.27 0.73 1.22 0.61 0.74 Valid 10 12 74 6.17 0.46 0.54 0.55 0.93 0.51 Valid
Based on the table all of item is valid and can be uses for pre – test and post -
test.
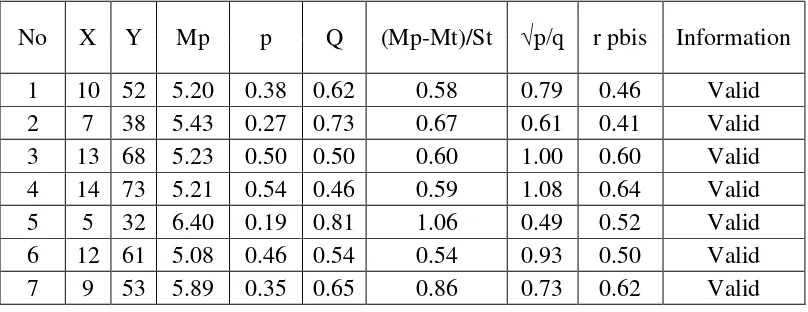
TABLE 4.4
Table for Questions Translate to English using On, In, At (XA)
No X Y Mp p Q (Mp-Mt)/St √p/q r pbis Information
8 9 48 5.33 0.35 0.65 0.64 0.73 0.46 Valid 9 7 46 6.57 0.27 0.73 1.13 0.61 0.68 Valid 10 11 56 5.09 0.42 0.58 0.54 0.86 0.46 Valid
Based on the table all of item is valid and can be uses for pre – test and post -
test.
2. Reliability of the Test
The formula that is used to know the reliability of fill the blank test for
English subject at SMAN 1 TIMPAH is using Kuder-Richardson 21 method, which is
known KR20 and KR21. In this study, the writer is used KR21 formula to know the
ralibility of the test item.
r11 =
2
) (
1
1 nSt
M n M n
n
Keterangan:
r11 = Coefficient reliability test
n = Total variant
M = Level score
St2 = Total variant
X = 613Based on the example of table =0,81is high
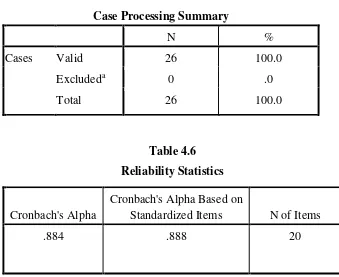
Table 4.5
Reliability question fill in the blank (XA) Case Processing Summary
N %
Cases Valid 26 100.0
Excludeda 0 .0
Total 26 100.0
Table 4.6 Reliability Statistics
Cronbach's Alpha
Cronbach's Alpha Based on
Standardized Items N of Items
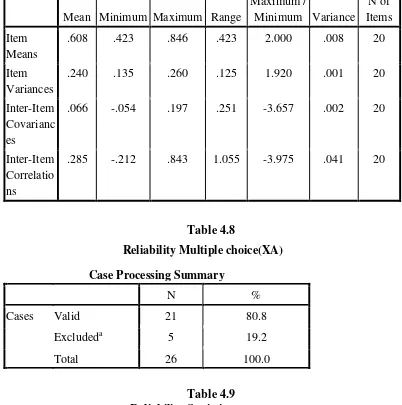
Table 4.7
Summary Item Statistics
Mean Minimum Maximum Range
Maximum /
Minimum Variance
N of Items
Item Means
.608 .423 .846 .423 2.000 .008 20
Item Variances
.240 .135 .260 .125 1.920 .001 20
Inter-Item Covarianc es
.066 -.054 .197 .251 -3.657 .002 20
Inter-Item Correlatio ns
.285 -.212 .843 1.055 -3.975 .041 20
Table 4.8
Reliability Multiple choice(XA) Case Processing Summary
N %
Cases Valid 21 80.8
Excludeda 5 19.2
Total 26 100.0
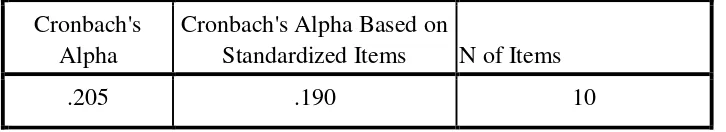
Table 4.9 Reliability Statistics Cronbach's
Alpha
Cronbach's Alpha Based on
Reliability Statistics Cronbach's
Alpha
Cronbach's Alpha Based on
Standardized Items N of Items
.205 .190 10
Table 4.10
Summary Item Statistics
Mean
Minimu
m Maximum Range
Maximum /
Minimum Variance N of Items
Item Means .581 .238 .810 .571 3.400 .032 10
Item Variances
.225 .162 .262 .100 1.618 .001 10
Inter-Item Covariances
.006 -.114 .117 .231 -1.021 .003 10
Inter-Item Correlations
.023 -.440 .553 .994 -1.257 .062 10
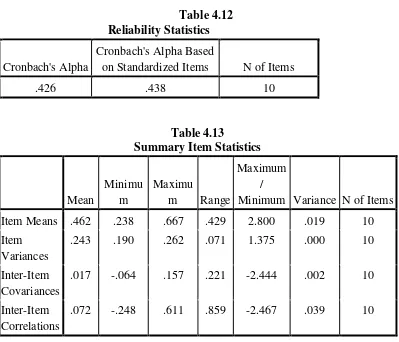
Table 4.11
Reliability question translate (XA) Case Processing Summary
N %
Cases Valid 21 80.8
Excludeda 5 19.2
Table 4.12 Reliability Statistics
Cronbach's Alpha
Cronbach's Alpha Based
on Standardized Items N of Items
.426 .438 10
Table 4.13
Summary Item Statistics
Mean
Minimu m
Maximu
m Range
Maximum /
Minimum Variance N of Items
Item Means .462 .238 .667 .429 2.800 .019 10
Item Variances
.243 .190 .262 .071 1.375 .000 10
Inter-Item Covariances
.017 -.064 .157 .221 -2.444 .002 10
Inter-Item Correlations
.072 -.248 .611 .859 -2.467 .039 10
3. Index Difficulty of Test
The formulation as follows to determine the index difficulty:
P =
Where :
P = Index difficulty
B = Students correct answer
JS = Total studens of test
Then it classifies the result from the aplication of the calculation above as follows:
If P 0,00 - 0,30 it says difficulty test.
If P 0,30 - 0,70 it says the medium test.
If P 0,70 - 1,00 it says easy test.
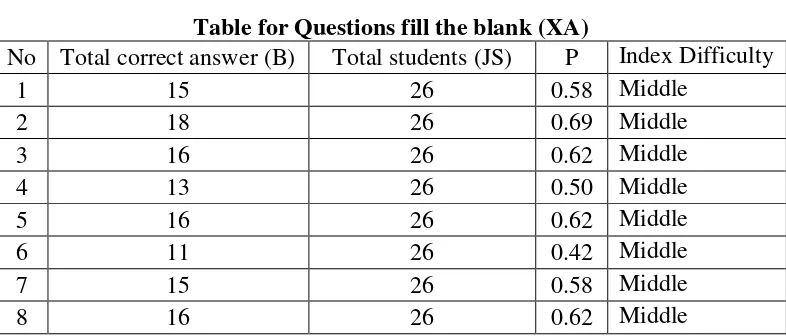
The following example of index difficulty :
P =
JS B
= 26 15
= 0,58(medium)
So, based on the example of index difficulty on number 1, can be seen on the table
bellow.
Table 4.14
Table for Questions fill the blank (XA)
No Total correct answer (B) Total students (JS) P Index Difficulty
1 15 26 0.58 Middle
2 18 26 0.69 Middle
3 16 26 0.62 Middle
4 13 26 0.50 Middle
5 16 26 0.62 Middle
6 11 26 0.42 Middle
7 15 26 0.58 Middle
9 22 26 0.85 Easy
10 16 26 0.62 Middle
11 14 26 0.54 Middle
12 14 26 0.54 Middle
13 14 26 0.54 Middle
14 15 26 0.58 Middle
15 15 26 0.58 Middle
16 18 26 0.69 Middle
17 18 26 0.69 Middle
18 16 26 0.62 Middle
19 16 26 0.62 Middle
20 18 26 0.69 Middle
Table 4.15
Table for Questions multiple choices (XA)
No Total correct answer (B) Total students (JS) P Index Difficulty
1 13 26 0.50 Middle
2 4 26 0.15 Difficult
3 16 26 0.62 Middle
4 15 26 0.58 Middle
5 17 26 0.65 Middle
6 14 26 0.54 Middle
7 11 26 0.42 Middle
8 10 26 0.38 Middle
9 7 26 0.27 Difficult
10 12 26 0.46 Middle
Table 4.16
Table for Questions Translate to English using On, In, At (XA) No Total correct answer (B) Total students (JS) P Index Difficulty
1 10 26 0.38 Middle
2 7 26 0.27 Difficult
3 13 26 0.50 Middle
4 14 26 0.54 Middle
6 12 26 0.46 Middle
7 9 26 0.35 Middle
8 9 26 0.35 Middle
9 7 26 0.27 Difficult
10 11 26 0.42 Middle
Based on the all table above, it can be seen the percentage all of item
questions (fill the blank, multiple choice, and translate) with using preposition (on, in,
and at).
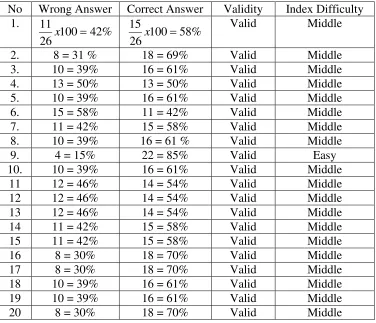
Table 4.17
Table for Questions fill the blank (XA)
No Wrong Answer Correct Answer Validity Index Difficulty 1.
% 42 100 26
11
x 100 58%
26
15
x Valid Middle
2. 8 = 31 % 18 = 69% Valid Middle
3. 10 = 39% 16 = 61% Valid Middle
4. 13 = 50% 13 = 50% Valid Middle
5. 10 = 39% 16 = 61% Valid Middle
6. 15 = 58% 11 = 42% Valid Middle
7. 11 = 42% 15 = 58% Valid Middle
8. 10 = 39% 16 = 61 % Valid Middle
9. 4 = 15% 22 = 85% Valid Easy
10. 10 = 39% 16 = 61% Valid Middle
11 12 = 46% 14 = 54% Valid Middle
12 12 = 46% 14 = 54% Valid Middle
13 12 = 46% 14 = 54% Valid Middle
14 11 = 42% 15 = 58% Valid Middle
15 11 = 42% 15 = 58% Valid Middle
16 8 = 30% 18 = 70% Valid Middle
17 8 = 30% 18 = 70% Valid Middle
18 10 = 39% 16 = 61% Valid Middle
19 10 = 39% 16 = 61% Valid Middle
Based on the table, all of item is valid, and can be uses for pre – test and post
– test.
Table 4.18
The percentage of validity Test Item (Fill the blank XA)
Criteria Item = Percentage (%)
Very High (0,91 – 1,00
( 2 item ) 100 10% 20
2
x
High (0,71 – 0,90) _
Fair (0,41 – 0,70
( 18 item ) 100 90% 20
18
x
Low (0,21 – 0,40) _
No correlation (0,00 – 020)
_
Base on the table of validity test item (fill the blank XA) are very high is 10%,
high is 0%, fair is 90%, low is 0%, and no correlation is 0%
Table 4.19
The percentage of Item Difficulty (Fill the Blank XA) Item Difficulty Item = Percentage (%)
Easy
( 1 Item ), 100 5% 20
1
x
Middle
( 19 Item ), 100 95% 20
19
x
Base on the table of item difficulty, it is known that that percentage of easy
item is 5%, middle is 95%, and difficult is 0%.
Table 4.20
Table for Questions multiple choices (XA)
No Wrong Answer Correct Answer Validity Index Difficulty 1.
% 54 100 26 14
x 100 46%
26 12
x Valid Middle
2. 21 = 81% 5 = 19 % Valid Difficult
3. 10 = 39% 16 = 61% Valid Middle
4. 12 = 46% 14 = 54% Valid Middle
5. 9 = 35% 17 = 65% Valid Middle
6. 12 = 46% 14 = 54% Valid Middle
7. 15 = 28% 11 = 42% Valid Middle
8. 12 = 46% 14 = 54% Valid Middle
9. 19 = 73% 7 = 27% Valid Difficult
10 14 = 54% 12 = 46% Valid Middle
Based on the table, all of item is valid, and can be uses for pre – test and post
– test.
Table 4.21
The percentage of validity Test Item multiple choice (XA) Criteria Item = Percentage (%)
Very High (0,91 – 1,00)
( 1 item ) 100 10% 10
1
x
High (0,71 – 0,90)
( 2 item ) 100 20% 10
2
Fair (0,41 – 0,70
( 7 item ) 100 70% 10
7
x
Low (0,21 – 0,40) _
No correlation (0,00 – 020) _
Base on the table of validity test item (multiple choice XA) are very high is
10%, high is 20%, fair is 70%, low is 0%, and no correlation is 0%.
Table 4.22
The percentage of Item Difficulty multiple choice (XA Item Difficulty Item = Percentage (%)
Easy
__ Middle
( 8 Item ), 100 80% 10
8
x
Difficult
( 2 Item ), 100 20% 10
2
x
Base on the table of item difficulty, it is known that that percentage of easy
item is 0%, middle is 80%, and difficult is 20%.
Table 4.23
Table for Questions Translate to English using On, In, At (XA) No Wrong Answer Correct Answer Validity Index Difficulty 1.
% 62 100 26 16
x 100 38%
26 10
x Valid Middle
2. 19 = 73% 7 = 27 % Valid Difficult
3. 13 = 50% 13 = 50% Valid Middle
4. 12 = 46% 14 = 54% Valid Middle
5. 21 = 81% 5 = 19% Valid Difficult
7. 17 = 65% 9 = 35% Valid Middle
8. 17 = 65% 9 = 35% Valid Middle
9. 19 = 73% 7 = 27% Valid Difficult
10 15 = 58% 11 = 42% Valid Middle
Based on the table, all of item is valid, and can be uses for pre – test and post
– test.
Table 4.24
The percentage of validity Test Item Translate to English using On, In, At (XA) Criteria Item = Percentage (%)
Very High (0,91 – 1,00)
( 1 item ) 100 10% 10
1
x
High (0,71 – 0,90) _
Fair (0,41 – 0,70
( 9 item ) 100 90% 10
9
x
Low (0,21 – 0,40) _
No correlation (0,00 – 020)
_
Base on the table of validity test item translate to English using On, In, At
(XA) are, very high is 10%, high is 0%, fair is 90%, low is 0%, and no correlation is
0%.
Table 4.24
The percentage of Item Translate to English using On, In, At (XA) Item Difficulty Item = Percentage (%)
Easy
-- Middle
( 7 Item ), 100 70% 10
7
Difficult
( 3 Item ), 100 30% 10
3
x
Base on the table of item difficulty, it is known that that percentage of easy
item is 0%, middle is 70%, and difficult is 30%.
I. Pilihlahjawaban yang tepatdibawahini.
1. The workers went ___ strike because they thought their working hours were too
long.
A. At B. On C. In D. A, B, C benar
2. She warned her daughter of the dangers ___ going out alone ___ night.
A. At, of B. On, at C. At, of D. Of, at
3. ___ today’s newspaper it’s stated that a new agreement will be signed ___ Poland
and Ukraine this week.
A. By, in B. By, on C. By, at D. In, by
4. I learned to ride a bike ___ the age ___ four.
A. On, of B. In, of C. At, of D. Of, at
5. Will you please pick up some pierogi ___ supper ___ your way home this
evening?
A. For, in B. For, on C. For, at D. On, for
6. Ela was desperately ___ need ___ more speaking practice.
A. In , of B. At, of C. On, of D. In, at
7. My plane stopped ___Dubai and Hanoi and arrived____Bangkok two hours late.
8. I live ____ the 7th floor ____ 21 Oxford Street ____ London.
A.At, on, in B. In, on, at C. At, in, on D. On, at, in
9. Let’s sit outside and laugh __ you as you work __ the blazing sun.
A.At, on B. At, in C. At, at D. On, at
10. She accidentally dropped her iPhone___ the floor.
A.At B. On C. In D. A, B, C benar.
Table 4.25
The tableanalysis items multiple choices on class XB No Multiple
Answer
Error Frequency
Percentage Correct Answer
Information 1. a. At
The students are still
The students are still
The students are still
6. b. At, Of
The students are still
The students are still
The students are still
The students are still
tongue mean is prefix “DI” in Indonesian language.
Based on question for no 2 the students answer wrong 32% this is because the
influence of mother tongue also, it’s mean there is no preposition pair with certain
Based on question for no 3 the students answer wrong 34% this is because the
influence of mother tongue also, it’s mean there is no preposition pair with certain
word.
Based on question for no 4 the students answer wrong 34% this is because the
influence of mother tongue also, it’s mean there is no preposition pair with certain
word.
Based on question for no 5 the students answer wrong 34% this is because the
influence of mother tongue also, it’s mean there is no preposition pair with certain
word.
Based on question for no 6 the students answer wrong 50% this is because the
influence of mother tongue also, it’s mean there is no preposition pair with certain
word.
Based on question for no 7 the students answer wrong 61% this is because the
influence of mother tongue also, it’s mean there is no preposition pair with certain
word.
Based on question for no 8 the students answer wrong 46% this is because the
influence of mother tongue also, it’s mean there is no preposition pair with certain
word.
Based on question for no 9 the students answer wrong 50% this is because the
influence of mother tongue also, it’s mean there is no preposition pair with certain
Based on question for no 10 the students answer wrong 46% this is because
the influence of mother tongue also, it’s mean there is no preposition pair with certain
word.
All in all is the language of mother tongue is still very dominant in proses
answering question of English language. It’s meant the students still think in mother
language when accessing to answer the Question in using English language.
II. Isilahtitikdibawahinidenganmenggunakan Preposition “On, In, and At” 1. Are you doing anything ___ the weekend?
2. Jhon doesn’t have a job ___ the moment.
3. Both cars stopped ___ the same time.
4. Are you doing anything ___ the weekend?
5. Roman’s always tired. He’s ___ bed now!
6. Bye! I’ll see you ___ the morning.
7. Were you ___ Hania’s party last night?
8. Simon was born ___ 1966.
9. The dentist will see you ___ 11:15.
10. My boyfriend gave me a fantastic present ___ my birthday.
11. The sugar is ___ the shelf.
12. Your car keys are ___ your pocket.
13. Ela’s gone to work. She’s probably ___ work now.
14. My uncle lives ___ Palangka Raya.
16. ___ second thought, the dark green one is nicer.
17. Buy some biscuits ___ your way home.
18. What will you be doing ___ New Year’s Eve?
19. That new bench ___ your garden is very nice.
20. I got up ___ 11am today!
Table 4.26
The table analysis items fill the blank on class XB No Multiple
Answer
Error Frequency
Percentage Correct Answer
Information 1. On, In, At 6 students
The students are still influenced mother tongue
2. On, In, At 10 students
mother tongue
3. On, In, At 9 students
mother tongue
4. On, In, At 7 students
The students are still influenced mother tongue
5. On, In, At 8 students
mother tongue
6. On, In, At 7 students
mother tongue
7. On, In, At 8 students
The students are still influenced mother tongue
8. On, In, At 6 students
9. On, In, At 11 students
mother tongue
10. On, In, At 7 students
mother tongue
11. On, In, At 6 students
mother tongue
12. On, In, At 7 students
mother tongue
13. On, In, At 9 students
The students are still influenced mother tongue
14. On, In, At 9 students
mother tongue
15. On, In, At 9 students
mother tongue
16. On, In, At 6 students
The students are still influenced mother tongue
17. On, In, At 10 students
mother tongue
18. On, In, At 10 students
mother tongue
19. On, In, At 8 students
The students are still influenced mother tongue
20. On, In, At 10 students
Based on the two tables are the choices (On, in, and at) not influence for
pattern of the students, because of mother tongue is still dominant
Table 4.27
The table analysis items translate to English on class XB No Translate
Answer
Error Frequency
Percentage Correct Answer
Information 1. On
mother tongue
2. On
The students are still influenced mother tongue
3. On
mother tongue
4. On
mother tongue
5. On
mother tongue
6. On
mother tongue
7. On
mother tongue
8. On
9. On In At
14 students
% 46 100 26
12
x -In 54% The students are still influenced
mother tongue
10. On In
At
12 students
% 54 100 26
14
x -On 46% The students are still influenced
mother tongue
B. Discussion
Based on the analysis result of the research, show that the problem of using
preposition (in, on, and at) faced study by 10thgrade student of SMAN 1 Timpah at
the second semester has the validity.
That the students are still influencedby mother tongue is the language of
mother tongue is still very dominant in proses answering question of English
language. It’s mean the students still think in mother language when accessing to
answer the Question in using English language. This is because the influence of
mother tongue, the word of mother tongue mean is Prefix “DI” in Indonesian
language, and for English language “Di and Pada” is (on, in, at). This is in line with
theory stated in chapter II page 7.
Students still make common mistakes of preposition (In,on, and at) because
students still influence of mother tongue, and the purpose is forimplication the
research will give contributions to the concept of making true sentences especially in
using the preposition (in, on, at), and the application for the students, regarding that
this research did give useful input for SMAN 1 Timpah in order to make the errors
For the example (English version):
1. The book is on the table
2. The cat is in the box
3. Don’t try this at home
For the example (Indonesian version):
1. Bukuitudiatasmeja
2. Kucingitudidalamkotak