Journal of Life Sciences
Volume 8, Number 7, July 2014 (Serial Number 75)
David Publishing Company www.davidpublishing.com
Publication Information
Journal of Life Sciences is published monthly in hard copy (ISSN 1934-7391) and online (ISSN 1934-7405) by David Publishing Company located at 240 Nagle Avenue #15C, New York, NY 10034, USA.
Aims and Scope
Journal of Life Sciences, a monthly professional academic journal, covers all sorts of researches on molecular biology, microbiology, botany, zoology, genetics, bioengineering, ecology, cytology, biochemistry, and biophysics, as well as other issues related to life sciences.
Editorial Board Members
Dr. Stefan Hershberger (USA), Dr. Suiyun Chen (China), Prof. Dr. Fadel Djamel (Algeria), Dr. Francisco Torrens (Spain), Dr. Filipa João (Portugal), Dr. Masahiro Yoshida (Japan), Dr. Reyhan Erdogan (Turkey), Dr. Grzegorz Żurek (Poland), Dr. Ali Izadpanah (Canada), Dr. Barbara Wiewióra (Poland), Dr. Amanda de Moraes Narcizo (Brasil), Dr. Marinus Frederik Willem te Pas (The Netherlands), Dr. Anthony Luke Byrne (Australia), Dr. Xingjun Li (China), Dr. Stefania Staibano (Italy), Prof. Dr. Ismail Salih Kakey (Iraq), Hamed Khalilvandi-Behroozyar (Iran).
Manuscripts and correspondence are invited for publication. You can submit your papers via Web Submission, or E-mail to [email protected] or [email protected]. Submission guidelines and Web Submission system are available online at http://www.davidpublishing.com.
Editorial Office
240 Nagle Avenue #15C, New York, NY 10034, USA
Tel: 1-323-9847526, 1-302-5977046; Fax: 1-323-9847374, 1-323-9080457 E-mail:[email protected], [email protected]
Copyright©2014 by David Publishing Company and individual contributors. All rights reserved. David Publishing Company holds the exclusive copyright of all the contents of this journal. In accordance with the international convention, no part of this journal may be reproduced or transmitted by any media or publishing organs (including various websites) without the written permission of the copyright holder. Otherwise, any conduct would be considered as the violation of the copyright. The contents of this journal are available for any citation. However, all the citations should be clearly indicated with the title of this journal, serial number and the name of the author.
Abstracted / Indexed in
Database of EBSCO, Massachusetts, USA Chemical Abstracts Service (CAS), USA
Database of Cambridge Science Abstracts (CSA), USA Database of Hein Online, New York, USA
Ulrich’s Periodicals Directory, USA Universe Digital Library S/B, Proquest
Chinese Database of CEPS, American Federal Computer Library center (OCLC), USA China National Knowledge Infrastructure, CNKI, China
Chinese Scientific Journals Database, VIP Corporation, Chongqing, China Index Copernicus, Index Copernicus International S.A., Poland
Google Scholar (scholar.google.com)
Subscription Information
Price (per year): Print $420, Online $300, Print and Online $560.
David Publishing Company
240 Nagle Avenue #15C, New York, NY 10034, USA
Tel: 1-323-9847526, 1-302-5977046; Fax: 1-323-9847374, 1-323-9080457 E-mail: [email protected]
David Publishing Company www.davidpublishing.com
DAV ID P UBL ISH IN G
J LS
Journal of Life Sciences
Volume 8, Number 7, July 2014 (Serial Number 75)
Contents
Physiology and Biochemistry
563 Removal of Pesticides and Polychlorinated Biphenyls from Municipal Wastewater by Reed Beds in A Constructed Wetland
Teresa Ozimek and Wojciech Dąbrowski
570 The Diversity of the Environmental Impact in Kurzeme
Imants Liepa and Oskars Zaļkalns
582 On-farm Evaluation of Effect of Organic and Mineral Fertilizers on Biomass and Yield of Millet/Cowpea Intercrop in the Sahel, West Africa
Hide Omae, A. K. Saidou and Satoshi Tobita
Botany and Zoology
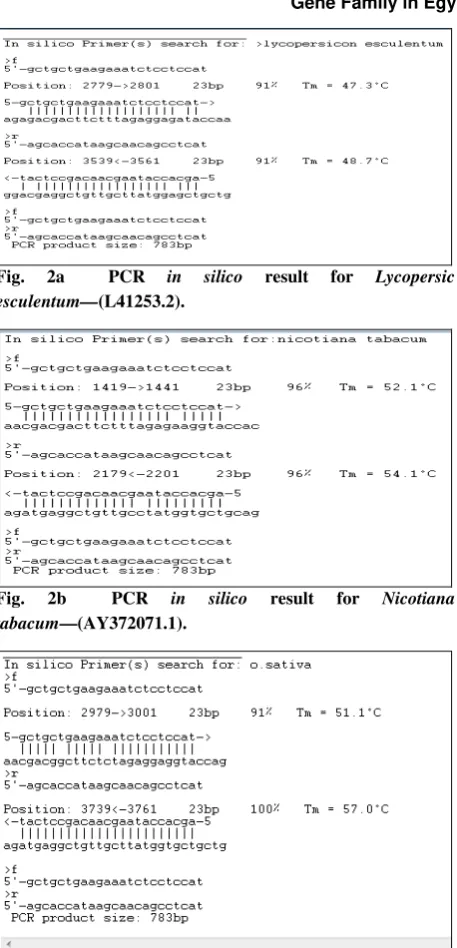
593 Detection and Protein Modelling for Consensus Region of hsp70 Gene Family in Egyptian Arundo donax
Mohamed A. Ezz, Mona I. Salah and Abdullah I. Ammoura
603 The Emergence of Hybrid Seeds and Polyembryony in Some Citrus Cultigens
Nino Davit Kipiani
605 Effects of Fermented Whey in Treating Bacillary Dysentery and on the Gastrointestinal Flora of Apparently Healthy Albino Rats
Tinuola Tokunbo Adebolu and Sunday A. Awe
Interdisciplinary Researches
610 Osteoporosis as A Source of Tissue Mineralization Research on Osteoporosis Therapy and Dissolution of Arterial Mineralization
Maciej Pawlikowski
626 Economical Analysis of Milk Production in the Farms of Siedlce Region
July 2014, Vol. 8, No. 7, pp. 563-569
Journal of Life Sciences, ISSN 1934-7391, USA
Removal of Pesticides and Polychlorinated Biphenyls
from Municipal Wastewater by Reed Beds in A
Constructed Wetland
Teresa Ozimek1 and Wojciech Dąbrowski2
1. Department of Hydrobiology, Faculty of Biology, University of Warsaw, Biological and Chemical Research Centre, Żwirki i
Wigury, 02-089 Warszawa, Poland
2. Faculty of Civil and Environmental Engineering, Białystok University of Technology 45A Wiejska St., 15-351 Białystok, Poland
Received: April 18, 2014 / Accepted: July 14, 2014 / Published: July 31, 2014.
Abstract: Constructed wetlands containing reed beds are believed to facilitate the removal from water of various toxic substances, such as polychlorinated biphenyls (PCBs), pesticides and herbicides, as these substances partition strongly to organic particulate matter. In order to evaluate this premise, the study investigated the organic matter, pesticides and PCBs content in wastewater and in soil within the reed beds, in their entry, middle, and exit-part areas in a full-scale operating subsurface-flow (SSW) constructed wetland (CW) in Poland. It is found that chlorinated pesticides such as 2,4’dichlorodiphenyltrichloroethane (2,4’DDT), 4,4’dichlorodiphenyldichloroethylene (4,4’DDE), hexachlorobenzene (HCB), as well as PCBs in the wastewater. In the entry-part area of reed beds, nearly all of the pesticides and PCBs content in the wastewater had been removed by soil. The level of contamination by these compounds declined with increasing distance from the point of discharge of the wastewaters into the reed beds, as well as downwards through the soil profile from the surface into the deeper layers. Vertical distributions of pesticides and PCBs content were proportional to the organic carbon content in the soil. It is therefore concluded that reed beds act as a trap for pesticides and PCBs, and thus can provide a very effective mechanism for their removal from wastewater.
Key words: Wastewater, constructed wetland, reed bed, pesticides, polychlorinated biphenyls.
1. Introduction
Polychlorinated biphenyls (PCBs) share with the organochlorine pesticide dichlorodiphenyltrichloroethane (DDT) the distinction of being among the first historically recognized persistent organic pollutants. Having many of the same chemical and physical properties has led them to be among the most persistent and widespread contaminants in the environment [1, 2]. Organochlorine pesticides were commonly used in the past, and although many have been removed from the market, they are still present in the environment (e.g. DDT and chlordane). Many of
Corresponding author: Tereasa Ozimek, Ph.D., associate professor, research fields: wastewater, constructed wetland, limnology. E-mail: [email protected].
these toxic organic compounds are present in municipal wastewater. They enter the wastewater stream via aerial deposition and runoff into urban drains, household domestic wastewater, and industrial effluents. Because of their lipophilic nature, they preferentially partition onto the sludge solids during wastewater treatment in conventional treatment plants [3]. As Kadlec and Wallace [4] have reported, constructed wetlands (CWs) have a high capacity for removing various toxic substances, such as PCBs, pesticides, herbicides. Only a few studies have been published on the use of subsurface-flow (SSF) CWs to remove PCBs and pesticides from wastewater [5]. SSF CWs are one of the most common types of extensive wastewater systems used throughout the world. SSF CWs consist of beds that are usually dug
D
into the ground, lined, filled with a granular medium, and planted with emergent macrophytes, most often
Phragmites australis [6]. However, the current literature offers only limited data relevant to the behavior of pesticides [7] and PCBs [8] in full-scale operating constructed wetlands.The aim of the study was to examine the role that reed beds play in the removal of persistent organic pollutants PCBs and pesticides from municipal sewage.
2. Study Area and Methods
The research was carried out at the SSF CW at Nowa Słupia, situated in central Poland, which receives a steady supply of municipal sewage, as well as precipitation waters and meltwaters on a more irregular basis. The latter waters are intercepted across Nowa Słupia via the system of stormwater drains, and the supply is obviously variable.
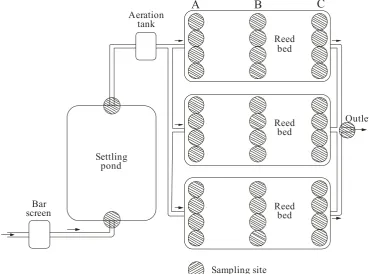
The investigations were carried out in a reed bed treatment plant that had been in operation for 15 years. Water samples were collected at the inflow and
outflow from the settling pond, at the inflow into and outflow from the reed beds. Samples of soil were taken using a metal pipe within the reed beds in three transects, A in their entry-part, B in middle and C in exit-part areas of the beds (Fig. 1). Each sample thus took the shape of a cylinder some 8 cm across and with a maximum height of 16 cm (at greater depths sand and gravel were present, Fig. 2).
Each soil sample was divided up in such a way as to represent the layers 0-4, 4-8, 8-12 and 12-16 cm below the surface. The organic matter content in the dry mass of sediment was determined from 15 replicates in each layer. Dry samples were incinerated in a muffle furnace for 5.5 h at 550 oC [9].
The content was extracted from all samples using the solvent dichloromethane, which was boiled and cycled for several hours using Soxhlet apparatus. Residual concentrations of organochloride pesticides in samples of water and soil were determined using standard methods adopted by the US Environmental Protection Agency (USEPA), using a gas chromatograph
Sampling site Reed
bed
Reed bed
Reed bed
A
B
C
Aeration tank
Outlet
Settling pond
Bar screen
Removal of Pesticides and Polychlorinated Biphenyls from Municipal Wastewater by Reed Beds in A Constructed Wetland
565
Fig. 2 Core of soil from reed bed.
(HP6890, Series GC System Hewlett Packard) equipped with an electron capture detector and a capillary column [10].
The extraction of PCBs made use of hexane, with a UNICAM series 610 gas chromatograph and electron capture detector (ECD), as integrated with a Pro-Gc computer programme also allowing calculations to be made. The chromatograph had a BPX 5 (non-polar-phase) capillary column length of 30 m, a carrier phase thickness of 0.25 µm, diameter of 0.22 mm and external diameter of 0.33 mm. Quantitative analysis was performed using the certified RPCM-200 model and calculations of the total content of PCBs in the samples was done through a comparison with the results for a standard solution [11].
3. Results
The content and distribution of organic matter in dry weight of soil did not differ between the transects, but did differ between the depth in each transect. Organic matter content decreased with soil depth (Fig. 3).
Organochlorine pesticides and PCBs were both present in wastewater. In the settling pond, their concentrations in wastewater were higher at the
outflow than the inflow (Table 1).
In the reed beds, the highest concentration of 4,4’DDE was noted in the surface (0-4 cm) layer of transect A, i.e. the entry area, and in the final section of the reed bed, close to the outflow only trace quantities of 4,4’DDE (of < 5 µg/kg dry mass of substrate) were recorded in soil. Furthermore, in both transects A and B, the concentrations of 4,4’DDE were lower at increasing depths inside the substrate, with the greatest decline found between the two uppermost layers. A particularly high degree of variation was found in the values for the upper level in belt A, as reflected by large error bars (Fig. 4).
A similar (horizontal and vertical) spatial differentiation was noted for 2,4’DDT (Fig. 5). HCB, in turn, was noted in trace quantities only in the entry and middle sections of the reed beds, and in a distribution that was fairly uniform on the vertical axis (Fig. 6).
0 20 40 60 80
De
p
th
(c
m
)
0
4
8
12
16 A
100 0 20 40 60 80 0 20 40 60 80
B C
100 100%
Fig. 3 Horizontal and vertical distribution of organic matter in % of soil dry weight (mean ± SD, n = 15) of reed beds in SSF CW at Nowa Słupia, Poland (A: entry part, B: middle part, C: exit part of reed beds, Fig. 1).
Table 1 Concentration of pesticides (HCB, 4,4’DDE, 2,4’DDT) and total PCBs (mean + SD, n = 10) in inflow and outflow water from settling pond of SSF CW at Nowa Słupia (Poland).
Settling pond µg/kg
HCB 4,4’DDE 2,4’DDT PCBs
Inflow 3 ± 3 5 ± 2 13 ± 1 5 ± 1
Outflow 4 ± 3 8 ± 2 30 ± 2 7 ± 1
Fig. 4 Horizontal and vertical distribution 4,4’DDE in substrate of reed beds of SSF CW at Nowa Słupia, Poland (mean ± SD, (A: entry part, B: middle part, C: exit part of reed beds, Fig. 1).
Removal of Pesticides and Polychlorinated Biphenyls from Municipal Wastewater by Reed Beds in A Constructed Wetland
567
Fig. 6 Horizontal and vertical distribution HCB in sediment of reed beds of SSF CW at Nowa Słupia, Poland (mean ± SD, n = 15, A: entry part, B: middle part, C: exit part of reed beds, Fig. 1).
Fig. 7 Horizontal and vertical distribution PCBs in sediment of reed beds of SSF CW at Nowa Słupia, Poland (mean ± SD, n = 15, A: entry part, B: middle part, C: exit part of reed beds, Fig. 1).
Pesticides and PCBs were not detected in the discharge from the reed beds
4. Discussion
At the SSF CW we studied, “old” pesticides such as 2,4’DDT, 4,4’DDE, HCB and PCBs were present in the municipal wastewaters in relatively low concentrations (less than 10 µg/L), and they were removed and accumulated in the soil of the reed beds. We found PCBs to be present in the substrate at 0.2-70 µg/kg, DDT at 1-36 µg/kg. These concentrations were lower than those noted in sewage sludge in conventional wastewater treatment plants [3] but higher than those found in sediments of river and wetlands in the US [4] and in Poland [12].
The Nowa Słupia reed beds were initially
established on nothing more than a mineral substratum formed of sand and gravel. Obviously, over 15 years of operation, these reed beds had been enriched with organic matter from the incoming wastewater, as well as by decaying plant matter. Influent particulate organic matter is mainly retained by purely physical processes such as filtration in the reed bed substrate. The Nowa Słupia reed beds were found to retain 85% of the organic matter suspended in the effluents discharged into it [13]. Throughout the 15 years of the facility’s existence, the reeds were never cut and all biomass remained in the reed beds, thus undergoing gradual decomposition. After a 10-year period, the layer of detritus overlain over the mineral substratum was found to be 4.0 cm thick on average [14].
were noted in the upper (0-4 and 4-8 cm) layers of the substrate in the reed beds, which is also where the highest contents of organic matter were found (accounting here for 86-94% of the substrate)..
The levels of 2,4’DDT, 4,4’DDE and PCBs were lower at greater distances from the point of effluent discharge into the reed beds. It was in belt A that the highest concentrations of these compounds were recorded, with levels only one-fifth as high in belt B, and nothing more than trace quantities in belt C. The reed-bed wastewater treatment plant at Nowa Słupia is thus capable of retaining the toxic compounds under study in its substrate. More organic materials, such as litter, showed a stronger affinity with pesticides and PCBs.
Contaminants are removed from wastewater in SSF CWs by physical, chemical, and biological processes, and there is no single pathway that describes the complete range of processes involved in the removal of a given contaminant [15]. As reported by [16], pesticides and PCBs partition strongly to particulate matter. Reed beds therefore act as a trap for particulates, which carry most of the load of pesticides and PCBs, and as such they can provide a very effective mechanism for their removal.
5. Conclusions
(1) The soil present in the CW treatment plant at Nowa Słupia was found to contain pesticides such as 2,4’DDT, 4,4’DDE, HCB, as well as PCBs.
(2) The highest concentrations of both the pesticides and PCBs were reported from the surface layer within the reedbed, in which the content of organic matter was also the highest.
(3) The levels of both pesticides and PCBs were shown to vary horizontally, with virtually the whole load of the toxic compounds being retained close to the point of discharge of wastewaters into the reedbed. This implies that the capacity of such a reedbed to accumulate pollutants can be considered to persist for upwards of 15 years.
Acknowledgment
This work was supported by grant no. 2P04G08428 from the Ministry of Science and Higher Education in Poland to Teresa Ozimek.
References
[1] Robertson, L. W., and Hansen, L. G. 2001. PCBs Recent Advances in Environmental Toxicology and Health
Effects. Kentucky: The University Press of Kentucky.
[2] Nurzhanova, A., Zhambakin, K., Rakhimbayev, I., Sedlovsky, A., and Kalugin, S. 2011. “Obsolete Pesticides and Phytoremediation of Polluted Soil in Kazahstan.” Journal of Life Sciences 5: 524-535. [3] Stevens, J. L., Northcott, G. L., Stern, G. A., Tomy, G. T.,
and Jones, K. C. 2003. “PAHs, PCBs, PCNs, Organochlorine Pesticides, Synthetic Musks and Polychlorinated N-Alkanes in U.K. Sewage Sludge: Survey Results and Implications.” Environmental Science
Technology 37: 462-467.
[4] Kadlec, R. H., and Wallace, S. D. 2009. Treatment
Wetlands (2nd Ed.). Boca Raton: Taylor & Francis
Group.
[5] McKinlay, R. G., and Kasperek, K. 1999. “Observations on Decontamination of Herbicide-Polluted Water by Marsh Plant Systems.” Water Research 33: 505-511. [6] Vymazal, J., and Kropfrlova, L. 2008. Wastewater
Treatment in Constructed Wetlands with Horizontal
Sub-Surface Flow. New York: Springer-Verlag GmbH.
[7] Stearman, G. K., George, D. B., Carlson, G. K., and Lansford, S. 2003. “Pesticide Removal from Container Nursery Runoff in Constructed Wetland Cells.” Journal
of Environmental Quality 32: 1548-1559.
[8] Wojciechowska, E. 2013. “Removal of Persistent Organic Pollutants from Landfill Leachates Treated in Three Constructed Wetland Systems.” Water Science &
Technology 68: 1164-1172.
[9] Hermanowicz, W., Dożańska, W., Dojlido, J., and Kosiorowski, B. 1976. Fizyczne I Chemiczne Analizy
Wody I Ścieków. Warszawa: Arkady.
[10] FDA. 1994. Pesticide Analytical Manual (r3d Ed.). Washington, D. C.: Food and Drug Administration. [11] EPA. 1999. Method 1668: Revision A: Chlorinated
Biphenyl Congeners in Water, Soil, Sediment, and Tissue
by HRGC/HRMS. Washington, D. C.: Protection Agency,
Office of Water.
[12] Bojakowska, I., Gliwicz, T., and Sokołowska, G. 2000.
Wyniki Monitoringu Geochemicznego Osadów Wodnych
W Polsce W Latach 1998 I 1999, Warszawa:
Removal of Pesticides and Polychlorinated Biphenyls from Municipal Wastewater by Reed Beds in A Constructed Wetland
569
[13] Ozimek, T., and Bąder, M. 2010. Efektywność Oczyszczania
Ścieków W Oczyszczalni Trzcinowej Po 15 Latach Jej Funkcjonowania Bez Zabiegów Modernizacyjnych.”
PodstawyBiotechnologii Środowiskowej 3: 97-104.
[14] Ozimek, P., and Maszczyk, P. 2006. “Effect of
Phragmites Australis on Soil Processes in Horizontal
Ssubsurface Flow Constructed wetlands.” Proc. International Conference on Wetland Systems for Water Pollution Control, Lisbon.
[15] Haarstad, K., Bavor, H. J., and Mæhlum, T. 2012. “Organic and Metallic Pollutants in Water Treatment and Natural Wetlands: A Review.” Water Science &
Technology 65: 76-99.
[16] Garcia, J., Diederik, P., Rousseau, L., Morato, J., Lesage, E., Matamoros, V., and Bayona, J. M. 2010. “Contaminant Removal Processes in Subsurface-Flow Constructed Wetlands: A Review.” Critical Reviews in
Journal of Life Sciences, ISSN 1934-7391, USA
The Diversity of the Environmental Impact in Kurzeme
Imants Liepa1, Oskars Zaļkalns2
1. Forest Faculty, Latvia University of Agriculture, Latvia
2. Forest Faculty, Latvia University of Agriculture, Latvia
Received: April 18, 2014 / Accepted: July 14, 2014 / Published: July 31, 2014.
Abstract: The analysis of environmental impact effects on forest ecosystems has a theoretical and practical nature. Many methods have been developed to determine characteristics and intensity of this impact. Methodologically, they can be divided into three groups: environmental parameter, bioindicative and combined methods. To evaluate the environmental impact a combined method was used in this study, it was based on trees as the bioindicators and their response reactions, and environmental parameter analysis. In this study the bioindicator was Norway spruce (Picea abies (L.) Karst.), whose response reaction was used to explain total impact volumes of environmental factors in different places in the region of Kurzeme and try to interpret the causes of these differences. As the bioindicators criterion was used response reaction of Norway spruce during a period of 20 years, which was expressed with cumulative and annual additional volume increment, and was depending on the location of the stand and its morphometric characteristics. The empirical material was collected in Kurzeme region in 28 sample plots that are located on two transects and in one reference stand. For the evaluation the widths of the last 40 year growth rings were measured. To express the environmental impact in Kurzeme region a multiple regression model was developed, which explains the environmental impact in the volume of 68.2%, the rest part can be explained by the local conditions of each stand. It must be noted that methodology used in this study is very sensitive, thus, each of the nuances in the dynamics of volume’s annual reduced additional increments has biological and ecological cause.
Key words: Norway spruce, additional volume increment, bioindication, environmental impact.
1. Introduction
For determination of the nature and intensity of the environmental impact numerous methods are developed. Methodologically, they fall into three groups: the environmental parameters methods, bioindication methods and combined methods. The methods of each group have their own inherent character of usage and a range of possibilities. Therefore, a choice of a method in any particular case depends on the conditions of the assignment to be dealt with.
The environmental parameter methods determine the values of the environmental factors (Vj) and
compare them with the critical or normative value (Vcrit). The ratio of these data determines the level of
the environmental pollution: if Vj > Vcrit, it is
Corresponding author: Oskars Zaļkalns, research field: forest. E-mail: [email protected].
considered that the impact of the respective environmental factor is unacceptably high, and vice versa—in case Vj ≤ Vcrit, the environmental quality
due to this factor is not significantly degraded. Strict standards are adopted in the European Union, such as the maximum permissible concentration of various environmental pollutants in the air [1]1. In turn, each EU member state specifies a common framework by taking in consideration its particular situation, e.g., the Latvian air quality standards are specified by the national law2. The methodological solution is very simple and understandable for everybody. Apparently, for this reason, the first group of methods is widely used (their results are used in the national environmental quality control and as an expert
1
http://eurlex.europa.eu/smartapi/cgi/sga_doc?smartapi!celexpl us!prod!CELEXnumdoc&lg=EN&numdoc=31999L0
2
https://www.vestnesis.lv/?menu=doc&id=6075
D
The Diversity of the Environmental Impact in Kurzeme 571
valuation even in court proceedings). However, these methods have a number of significant drawbacks. Firstly, as the most significant must be mentioned determination of Vcrit. In most cases Vcrit is adopted by
a national parliament or the government as regulated standards, of course also trying to comply with the ecological research findings. It should be noted, however, that these findings do not always unmistakably reflect reality. Besides that it should be noted that there is always a possibility of the subjective choice of the adopter of the standard, namely, by increasing the level of Vcrit, it is possible
to manipulate the environmental quality rating by “making” a threatening environment into a sound one. Secondly, the interaction of many environmental factors is very important. As a result, a certain level of one and the same level, in the same conditions may exert different effects on others. It cannot be ignored in the rating of wider regions in the territorial meaning. Thirdly, one of the most specific characteristics of the environmental factors is their dynamics: over the time changes affect a complex of factors and also the impact level of the individual factors. So, once determined, Vcrit values cannot be lasting. The use of
the methods of the environmental parameters is limited by the accuracy of the other component—Vj,
which, despite the use of a standardized procedure cannot fully rule out the stochastic nature of the environmental factors [2].
The bioindication methods are based on the recession reaction analysis of living organisms (bioindicators). Depending on the indication and the indicator organism, there are very many and different methods of determination of the environmental impact. They all have a common advantage—the ability to reflect the nature and intensity of the environmental changes in the complex, in the context of specific growth and development requirements of specific groups of organisms. So, the indicator organism can be any species or even a single specimen. The suitability of a species to the bioindication is
determined by the knowledge degree of the ecological characteristics of this species and what level of the biosystem is exposed to the rating of the impact of the environmental factors. The scope of opportunities is very wide—from the cell to the ecosystem level.
In the event of the forest ecosystems, a more meaningful indicator is the individual trees, their clusters or tree stands. The trees have a number of significant advantages. Firstly, they are perennial plants and, therefore, they are able to reveal chronology of the impact of the environmental changes during their entire lifetime. This particularly applies to the forest ecosystems of the temperate zone and that have periodic vegetation, which is manifested by rare exceptions, with the formation of one annual-ring every year. Depending on the proportion of the impact of the beneficial for the growth or the disturbing ecological factors, wider or narrower annual-rings are formed, thus maintaining information about the qualification structure and the dynamics of the environment [3]. In this field, every tree can be considered as a monitoring sensor created by the nature itself that constantly, in the complex and in the context of the assignment under the study, records and preserves the dynamic series of the environmental quality. You just decode this information and judiciously use it (dendroindication).
and the health status change of the forest ecosystem. Many examples show alarms long before the occurrence of irreversible destruction of stands [10].
Thirdly, the forest ecosystems play an important role in the economy of each country. For example, in 2011, in Latvia, the proportion of the forest sector to GDP amounted to 6% (Forest sector in Latvia—2012), but in the sphere of exports—22% [4]. By improvement or deterioration of the forest growth conditions, there are changes in the intensity of the increase of the wood-pulp or the stand productivity, which, expressed in natural (m3/ha3) or monetary units, together with the quality of the environment evaluation permit the economic analysis of the provision of the national timber resources in the near and far future as well.
The combined methods combine the methodological opportunities of the environmental parameters and bioindication, while analyzing data on the state of the environmental parameters and the response of the bioindicators to their changes. There is no doubt that this is a more meaningful solution. Using the multi-parameter methods of the mathematical data processing [5, 6], the statistical analysis of the empirical data and the mathematical modeling of quality of the environment dynamics are available.
The aim of this publication is to present the results of the study on the diversity of the environmental impact at the regional level. The object of research is Kurzeme—a region of Latvia located in the western part of the country3. Kurzeme is a favorable place for such studies. In this relatively small area (13 607 km2 or 21% of the country’s territory), several influences overlap at the same time that intensify or neutralize one another. The most significant point-type source of air pollution is Liepāja (ferrous metallurgy) and Brocēni (cement industry) and the Mažeikiai Oil Refinery at the frontier zone of the neighboring
3
http://www.liepaja.lv/upload/Bizness/Attistiba/kurzemes_ plano shanas_doc1.pdf
country. All the objects are on the way of the prevailing western or southwestern winds. The wind is not only a carrier of industrial emissions, but it is also a cause of a wide range of windfalls and windbreaks. In the storm-affected forest areas, not only torn up by the root and broken trees appear, but the shaken out trees remain as well. The damaged trees contribute to the actualization of biotic factors. The most important ones include mass multiplication of insects European spruce bark beetle (Ips typographus L.) and the introduction of fungal diseases (Heterobasidion annosum (Fr.) Bref.). The effects previously mentioned are modified by abiotic factors. The articulated relief of Kurzeme creates a heterogeneous emission landing environment—the stands growing in the upland slopes facing the prevailing winds are in harsher conditions, while the leeward slopes make up some shelter. These differences are intensified by differences in soil and forest site types. The ecosystems of Kurzeme have survived many years’ exposure to electromagnetic radiation. The radiation source is the former Soviet Union’s military radar, which was located near Skrunda. A part of the territory of Kurzeme, lying west of the meridian of Skrunda (E21°56’)4, was subjected to intense radiation, but the eastern side—to extensive radiation. It has been suggested that this radiation negatively affects wildlife, even the tree’s annual increment [7, 8]. It should be emphasized that Kurzeme is an intensively managed territory. Without a doubt, that in the areas of a different economic regime (drained wetlands, groomed and unmanaged stands), the impact of the environmental factors is expressed differently.
The aim of the publication authors is to identify the size of the overall impact of the environmental factors in different areas of Kurzeme, as far as possible explaining the causes of differences. To this end, bioindication is used and an appropriate processing method is developed. The additional increase in the wood yield of middle-aged and mature stands of
4
The first of these to be developed without the implementation of the influence of the factor under the study, the second one is an additionally formed increment exactly due to this impact. Only the additional increment truly reveals the nature and size of the impact. The amount of the two components or the integral increment performs this function poorly as due to natural fluctuations partly compensates the effect of the impact. Additional types of growth can be distinguished—height, diameter, basal area, volume or wood yield, biomass, wood, bark, stem, root, branch, periodic, periodic on the average, annual, etc. Each of them differently characterizes the tree reference reaction in different shades. For the economic analysis of the impact, the volume (wood yield) periodical (cumulative) and annual (current) additional increment are the most appropriate. The additional increment value of the first and the second one can be positive, negative or equal to zero. The first one evidences of the beneficial effect of the impact under the study, the second one—about the impact of the slowing increment and the third—about the background effect.
The additional increment of the wood yield is determined by the method of Liepa, I. [9], the principal scheme is explained in Fig. 2.
We draw attention to the fact that the controls are used in a non-traditional way because the methods inherited from agricultural research in forest ecology studies are inadequate.
In the agronomic trials, phytocenotically homogeneous sown area are characterized by a carefully prepared soil and an even plant location in the area that provides the opportunity to locate the sampling plots close by. In contrast, with the forest ecosystems, it is opposite. For example, for the explanation of the air pollution effects, the pollution-free (control) stands are located in the distance of several tens of kilometers. We, therefore, recommend that controls should be used only as an adjustment tool for changes in the study background.
Fig. 2 The principal scheme of determining the additional increment.
'
t
: retrospection interval (t
'
≥ 10), years;t
: rating interval of the environmental impact (1 ≤ t ≤ 20), years; 1: reference; 2: bioindication stand; i: annual-ring width, mm; 3: adjustedannual-ring.
For this purpose, in the impact-free area of the influence under the study, a reference stand (stands) are selected, as far as possible with the same forest site type, site index class, age and density. In the reference stand, the greatest number of drilling cores are collected (m ≥ 50). From the reference trees are made the adequate control. The suitability of each reference tree for adequate control of the stand to be rated is checked statistically by the annual-ring-width measurements. The eligibility criteria—a similar growth pace of the reference tree and the bioindication trees of the stand to be rated in the retrospective interval. In the adequate control, there are included only the k reference trees, the Pearson correlation coefficient values of which are positive and significant. Since in every stand, the tree growth pace is clearly different, for k ≤ m further calculations, two series of numbers are used—the average value series of all the bioindication trees and the annual-ring width of the adequate control trees.
The implementation of the algorithm of the principal scheme (Fig. 2) is as follows:
lg 2 lg 2
Z
: The cumulative additional increment of theThe Diversity of the Environmental Impact in Kurzeme 575
wood yield, m3/ha;
,
,
,
: Depending on tree species empirical coefficients (for the Norway spruce:
= 2.3106·10-4,
= 0.78193,
= 0.34175,
= 1.18811);t
: Rating interval of the environmental impact (1 ≤ t ≤ 20), years;t
G
G
,
: Stand basal area and its predictive value atthe end of the interval t, m2/ha;
D
,
: The stand’s average diameter over the bark and its predictive value at the end of the interval t, cm;KP
Z
: The cumulative additional increment of the stand average diameter, cm;
u
: The bark thickness ratio (for the Norway spruce = 1.046);i: The mean values of the annual-ring width for all
the bioindication sampling trees of the stand under the rating in the interval t, mm;'
t
: Retrospection interval (t
'
≥ 10), years;'
i
: The predicted values of the annual-ring width of the stand to be rated in the interval t, mm;
k j ji
i
'
; (5)k
i : The mean values of the annual-ring width of the adequate control trees in the interval
t
;KP
forecasted value at the end of the interval t, m;
KP H
Z
: The cumulative additional increment in the height at the end of the interval t, m;a, , : Depending on tree species empirical
coefficients (for the Norway spruce a = -0.0256, b = 1.693, c = 5.794).
By the described algorithm, the cumulative additional increment of the wood yield is calculated together with the bark. The value of this index without the bark:
p, , : Depending on tree species empirical
coefficients (for the Norway spruce p = 5.25, q = 117.6, w = 5.0);
The cumulative additional increment for the bark of the wood yield:
The annual additional increment of the wood yield is calculated as the cumulative increment differences of the contiguous years.
In order to exclude the impact of differences of stand density (number of trees) of various stands, the values of the additional increment of the above wood yield are recalculated per 1 m2 of the basal area, for example:
diameter D = 22.3 cm, the basal area G = 32.20 m2/ha, the rating interval length t = 5 years, the retrospection interval
t
'
= 10 years', the number of the bioindication trees n = 27, the number of trees of the adequate control k = 14, the significance level of the correlation coefficient 0.632, the average value series of the annual-ring width of the bioindication trees: in the interval 't i = {1.50 1.62 1.58 1.49 1.60 1.52 1.70 1.77 1.75 1.80}, in the interval t i = {1.77 1.70 1.75 1.60 1.72}, the average value series of the annual-ring width of the adequate control: in the intervalt
'
ik = {1.70 1.72 1.70 1.60 1.80 1.80 1.85 1.90 1.97 1.90}, in the intervalt
i
k = {2.00 2.032.20 2.07 2.20}.
The forecasted values of the mean annual-ring width of the stand to be rated in the interval t are calculated using the coherence (5), the coefficients of which
= 0.938 and
= 0.95714 are calculated according to the smallest square method. Thus, during the last 5 years:22.4( 1.90)( 0.0256 22.3 1.693)
1.046(5.794 22.3 100)
0.78193 0.34175lg 22.4 1.18811 2
0.78193 0.34175lg 22.6 1.18811 2 12732.4 2.3106 10
Example conclusion: during the 5-year period of the chemical plant, the spruce stand productivity has declined by -9.478 m3/ha or -0.2944 m3/m2 of the stand basal area.
3. Results and Discussion
For the analysis of the results, the values of the wood yield’s cumulative reduced additional increment
ed K V
Z
Pr have been used, which present the environmental impact effect as the reference reaction of the spruce stands, accumulated in the time interval from 1989 to 2008. The reference reaction is expressed in m3 m-2 of the stand basal area, which partly reduces the density differences of the stands in the bioindication sampling plots.In the research planning, an idea was allowed of the essential impact of the polluted air of the industrial facilities located near Mažeikiai, Liepāja and Brocēni.
If this is the case, for the values
Z
VK edPr
, a trendal dependence should be presented from the plot location to the pollution source.
The Diversity of the Environmental Impact in Kurzeme 577
Fig. 3 The dependence of the environmental impact of the distance to the pollution source: D—the southern transect, Z—the northern transect.
In examining the differences of the environmental impact between the two transect bioindication sampling plots, it is concluded that they are not statistically significant, so in Kurzeme this impact is reflected relatively smooth and free from the effect of trendal factors. This means that the environmental impact data distribution within this selection should be interpreted by the specifics of the local ecological conditions. In the data analysis context, this means that both transect sampling plots may be joined in a single selection, achieving a greater number of observations and the validity of conclusions. It should be noted that an exception is the stand of the z6 sampling plot, causing suspicion about its belonging to another general selection. Examination by the t-criterion confirms this assumption, therefore the data in the further calculations are not included. Obviously, this sharp deviation can be explained by the origin of the stand and location in the landscape. The stand is a plantation of the Norway spruce in a well-fertilized agricultural land, and it is now surrounded by re-fertilized fields of crops, which could lead to so intensive increment. In addition, the stand age contributes to it—it is located at or near the peak zone of the Norway spruce increment [10]. In all the sampling plots, measuring and calculation of their
parameters are done, determining the mean height H of the stand, the average diameter D, the basal area G, height above the sea level Hv.j., the site class B and
age A. What is the role of these parameters in shaping the environmental impact? In order to answer this question, the correlation and multiple regression analysis are carried out. It is estimated that by the reduced additional increment of the stand, except for the age A of the stand, the above parameters form a linear dependence with low to moderate correlation closeness. With these parameters, the multiple linear regression model is formed (13), describing the environmental impact of Kurzeme at the regional level. The model (13) describes a statistically significant dependence (p = 3.9·10-5). The substitution of the linear equation with the non-linear Cobb-Douglas function has not given improvements, so priority is given to the simplest—the linear function.
Pr
The remaining 31.8% explain the environmental impact at the stand level. They are due to the inherent sampling plot-specific factors that are not included in the model (13). This component of the overall impact for each stand numerically expresses the empirical value deviation of the cumulative reduced increment
from model value
Z
VK edFor the explanation of this component, a nuanced knowledge of the local peculiarities is needed. A great variety is possible, but more often we have to deal with: pest infestation, disease infection, soil fertility, forest site type, the distance to the watercourse, the drainage system status, the stand origin, the management regime, air pollution, climate and other factors, different combinations of which create different environmental impact modifications.
The unexplained component of the model is dependent on the environmental changes inherent to each individual stand. Due to its nature and intensity, each stand is different and in the context of all of Kurzeme creates a background for the research. This division of the total environmental impact in components simplifies the possibility of the simple substance interpretation (Fig. 5).
The cumulative additional increment of the wood
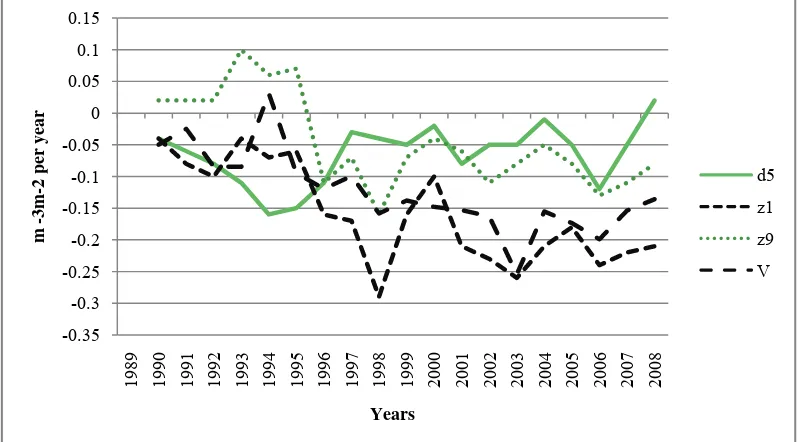
yield expresses the effect of the environmental impact, which is accumulated during the entire rating interval (Fig. 6). But more informative are data that reveal the pace of the accumulation of this impact, starting from the onset of the impact to the collection moment of the empirical data (Fig. 7), thus substantially contributing to the quality of the substance interpretation.
From Fig. 6, it can be concluded that during the period from 1989 to 2008, productivity losses of the spruce stands have occurred in Kurzeme. Apparently, the joint influence of a number of environmental factors has been unfavorable to the growth of spruces, practically in the entire interval t. However, compared to retrospection interval, in each sampling plot at the time it was varied and diverse. For example, the reference reaction of the sampling plot z9 stand has been positive up to 1995, but then a systematic decline started. In turn, in the sampling plots z1 and d5 there is observed only an additional increment decrease with a local aggravation or slow down. A similar recession trend is also shown by the combined trajectory V of all 28 sampling plots, which represents the average dynamics of the total environmental impact of Kurzeme. All the graphs of Fig. 6 have a common feature that, on the one hand, gradually accumulates the previous year’s impact values, well reflecting the environmental impact trendal changes,
Fig. 4 The compliance of the regression model (13).
Fig. 5 The im
Fig. 6 The sampling plot
mpact compon
trendal dynam ts, V—the aver
-3.5 -3 -2.5 -2 -1.5 -1 -0.5 0 0.5 1
1989
m-3 m-2
The Dive
nents of the env
mics of the cu rage data of th
1989 1990 1991 1992 1993
ersity of the
vironmental im
mulative redu he entire sampl
1993 1994 1995 1996 1997
Environment
mpact.
uced additiona ling plots.
1997 1998 1999 2000
Years
tal Impact in K
al increment: d
2001 2002 2003 2004
Kurzeme
d5, z1, z9—Th
2005 2006 2007 2008
he data of the
d5
z1
z9
V
579
e bioindication
5
1
9
9
but on the other hand—spreads out the impact of the annual values. But often they are these data that are important information for future research, such as using a combination of methods to identify the dependence of the specific environmental factors on the ever-changing climatic conditions. It is to be emphasized that the visual effect is much more complete, if the figure is intended to provide an idea of the differences between different objects. These requirements are consistent with the current additional annual increment of the wood yield, the values of which are obtained as the differences of the contiguous years of the cumulative additional increment of the wood yield. For what is being said can be confirmed by presenting Fig. 7 that represents all the same objects as in Fig. 6. Of course, in Fig. 7, a continual slowdown of the growth tempo can be seen, but not as expressive as in Fig. 6. But here, the impact of individual years is manifested more notably, the adverse and successful years inclusive. In this case, years 1998, 2003 and 2006 belong to the first ones, when pronounced additional increment local minimums in all stands to be presented have set in, especially in the stand z1. What local conditions have caused a
decline in such increment? For the year 2006 reduction, the cause is known—they are the year 2005 effects of the windfall when according to the data available from the State Forest Service [11], on the night of 9 January, 7.5 million m3 of forest were torn up by the roots in Latvia, followed by the progress and a massive damage of the European spruce bark beetle (Ips typographus L.). An undeniable impact on other plots is left by the activity of the European spruce bark beetle. In Kurzeme, in the last twenty years, repeated outbreaks of this pest have occurred (from 1967 to 1969, from 1994 to 1996 and from 2003 to 2004), following the wind damage at this time [12]. A negative impact can be left by the variety of
meteorological factors over time. In this relation, temperature, humidity and wind direction and intensity changes should be noted. A forest stand cannot be visually damaged due to the wind, but the traumatized root system may be reflected in the increments for several years and as the last one we should note the nature and intensity of forestry activities. Thinning, clear cutting in adjacent stands, the drainage system maintenance quality in each of the discussed sampling plots is different that more or less
Fig. 7 The additional reduced annual increment dynamics: d5, z1, z9—the data of the Bioindication sampling plots, V—the entire sampling plot averages.
-0.35 -0.3 -0.25 -0.2 -0.15 -0.1 -0.05 0 0.05 0.1 0.15
1989 1990 1991 1992 1993 1994 1995 1996 1997 1998 1999 2000 2001 2002 2003 2004 2005 2006 2007 2008
m -3m-2
per
y
ear
Years
d5
z1
z9
The Diversity of the Environmental Impact in Kurzeme 581
modify the combined effect of the environment. The improvement of growth of the spruces is shown during the period from 1993 to 1995. The said applies only to the stand z1 and the joint graph, during this period the stand d5 has quite the opposite reaction. It is likely that the decline in growth is the consequence of the Mažeikiai Oil Refinery. It should be noted that the methods used in the study are very sensitive, so for each nuance of the figure of the reduced additional annual increment of the wood yield there is a biological and ecological cause, the explanation of which lies in the well-balanced analysis of the environmental processes. On the other hand, knowing the basal area of the rated stand, there is no difficulty in the transition to the forest everyday customary units —m3/ha or monetary units, rating the losses or gains caused by the environmental impacts.
4. Summary
For the evaluation of the joint environmental impact, the dendroindication method is used. The spruce reference reaction in 20 years (from 1989 to 2008) due to environmental changes is expressed by the cumulative and current additional increment, which depends on the location of the stand and its morphometric characteristics. The Multiple Linear Regression model is developed, which describes the size of the environmental impact, as the arguments using indices inherent to all spruce stands of Kurzeme (stand age, average height, average diameter of the stand, the height above sea level and site index class). The unexplained information by the model expresses the specific impact value of each sampling plot. This category is represented by the effect of (local) factors specific only for the stand of each sampling plot (management regime, hydrological regime, soil characteristics, the location in the area, industrial pollution of the air, etc.). During the research planning, there was assumed that the essential impact of the polluted air comes from the industrial facilities located near Mažeikiai, Liepāja and Brocēni. The analysis of
the specific impact of the environment of each sampling plot allows a conclusion about a significant impact of the Mažeikiai Oil Refinery on the productivity decline of spruce stands of the vicinity in the period from 1989 to 2008.
References
[1] Council Directive 1999/30/EC of 22 April 1999. “Relating to Limit Values for Sulfur Dioxide, Nitrogen Dioxide and Oxides of Nitrogen, Particulate Matter and Lead in Ambient Air.” Official Journal of the European Communities L163: 41-60.
[2] Лиепа И, Я. 1980. Динамика древесных ресурсов.
Прогнозирование и экология (in Russian) (Stand
Volume Dynamics. Forecasting and Ecology). Рига:
Зинатне.
[3] Schweingruber, F. 1996. Tree Rings and Environment
Dendroecology. Berne: Paul Haupt Verlag.
[4] BALTI Group 2012. Latvia's Forests During 20 Years of
Independence. BALTI Group.
[5] NGO 2012. Forest Sector in Latvia. Zaļās mājas: NGO. [6] Sokal, R. R., and Rohlf, F. J. 1995. Biometry: The
Principles and Practice of Statistics in Biological
Research. 3rd edition. New York: W. H. Freeman and
Company.
[7] Balmori, A. 2009. “Electromagnetic Pollution from Phone Masts. Effects on Wildlife.” Pathophysiology (16): 191-199.
[8] Balodis, V., Brūmelis, G., Kalviškis, K., Nikodemus, O., Tjarve, D., and Znotiņa, V. 1996. “Does the Skrunda Radiolocation Station Diminish the Radial Growth of Pine Trees?” The Science of the Total Environment 180 (1): 57-64.
[9] Liepa, I. 1996. Pieauguma Mācība (in Latvian) (Forest
Increment Science). Jelgava: LLU.
[10] Антанайтис, В., and Загреев, В. 1981. Прирост леса
(in Russian) (Forest Increment). Москва: Лесная
промышленность.
[11] Bičevskis, M. 2005. “Egļu Astoņzobu Mizgrauzis, tā
Izraisītie Bojājumi un Ierobežošanas Metodes (in Latvian)
(Spruce Bark Beetle, the Resulting Damage and
Containment Methods).” Rīga: Latvijas valsts meži.
[12] Bičevskis M., 2006. Egļu Astoņzobu Mizgrauža
Savairošanās Ierobežošanas Sekmju Novērtējums AS
LVM Valdījumā Esošajos Mežos Pēc 2005. g. Janvāra
Vētras (in Latvian) (Spruce Bark Beetle (Ips typographus
L.) Limiting Progress Assessment in Stock Company LVM
Forests After the 2005th January Storms). Salaspils:
Journal of Life Sciences, ISSN 1934-7391, USA
On-farm Evaluation of Effect of Organic and Mineral
Fertilizers on Biomass and Yield of Millet/Cowpea
Intercrop in the Sahel, West Africa
Hide Omae1, A. K. Saidou2 and Satoshi Tobita3
1. Tropical Agriculture Research Front (TARF), Japan International Research Center for Agricultural Sciences (JIRCAS), 1091-1 Maezato-Kawarabaru, Ishigaki, Okinawa 907-0002, Japan
2. National Institute of Agronomic Research of Niger (INRAN), Niamey, PO Box 429, Niger
3. Crop, Livestock and Environment Division, Japan International Research Center for Agricultural Sciences (JIRCAS), Tsukuba, Ibaraki 305-8686, Japan
Received: April 18, 2014 / Accepted: July 14, 2014 / Published: July 31, 2014.
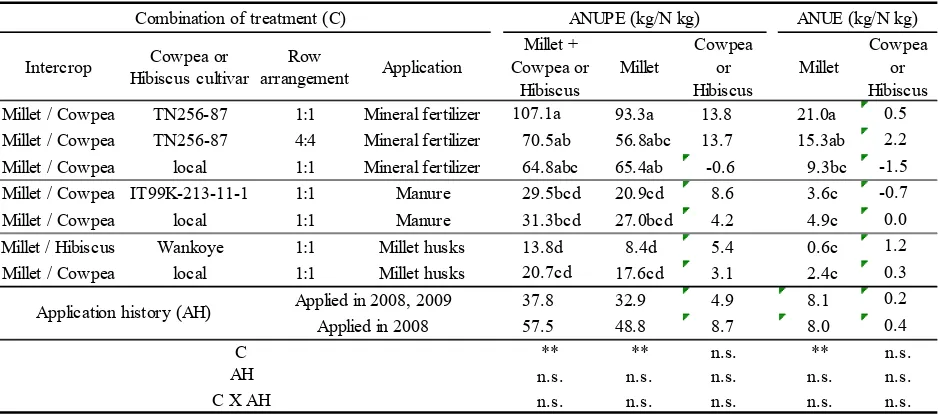
Abstract: To determine the best combinations of organic and mineral fertilizer applications under resource-limited conditions in the Sahel, West Africa, on-farm experiments for two years in the Fakara region of western Niger is conducted. Ten treatments were tested; six of them received one of three organic fertilizers (none, millet husks, or manure), with or without mineral fertilizer; two grew millet/(dual-purpose) cowpea intercrops with mineral fertilizer in 1:1 or 4:4 row arrangement; one grew a millet/ (spreading) cowpea intercrop with manure; and one grew a millet/hibiscus intercrop with millet husks. Manure increased total biomass by 127%-147% (P < 0.001) and millet yield by 130%-184% (P < 0.01). Mineral fertilizer increased total biomass by 27% (P < 0.01) and millet yield by 24% (P < 0.05) in 2008. The N balance was greatest and positive in the manure treatment (P < 0.001), followed by millet husks. Mineral fertilizer on the intercropped dual-purpose cowpea increased the agronomic N use efficiency of millet by 329%-483% (P < 0.01) compared with manure. The use of small quantities of mineral fertilizer on the intercropped dual-purpose cowpea, therefore, is a best combination for limited N-resources-farmers. Single manure, millet husks plus mineral fertilizer, or year-alternative-application are also recommendable depends on farmers accessibility to the resources.
Key Words: Millet, cowpea, intercrop, manure, mineral fertilizer, millet husks, sandy soil, nitrogen use efficiency.
1. Introduction
The soil in the Sahel, West Africa, is sandy, with a low nutrient-holding capacity and low levels of P, N [1], and organic C. Additional environmental constraints, notably high temperatures and low annual rainfall (300-800 mm), force farmers to practice low-input forms of agriculture such as shifting cultivation [2]. Recent decades have seen large population increases, the breakdown of traditional shifting cultivation systems, and a rapid decline of
Corresponding author: Hide Omae, Ph.D., Senior researcher, research fields: agronomy, plant physiology, soil fertility. E-mail: [email protected].
land productivity and soil fertility [3].
Pearl millet (Pennisetum glaucum), an important food crop in the rainfed Sahelian environment, produces a moderately reliable grain yield [4]. Millet is traditionally cropped with cowpea (Vigna
unguiculata). Both crops are sown at very low
densities (< 5000 hills/ha) with no fertilizer [5].
Although improved millet cultivars have been developed, farmers still grow local landraces, which provide grain for humans, fodder for livestock, and stalks for fencing, precluding their use as organic fertilizer. Small doses of mineral fertilizer increased production [6, 7], but farmers cannot afford to buy mineral fertilizer, and thus low-cost inputs must be
D
On-farm Evaluation of Effect of Organic and Mineral Fertilizers on Biomass and Yield of Millet/Cowpea Intercrop in the Sahel, West Africa
583
found. Suitable alternatives include intercropping and cereal-legume (or non-legume) rotation at increased planting density, and improved cultivars of cowpea [5, 8-14]. Different row arrangements in cereal-legume intercrops also have also been compared [15-17].
Among fertilizers, mineral fertilizer [18], manure [19, 20], and both [21] have been tested. Mineral fertilizer appears to be the best means of restoring the nutrient balance, increasing crop yields, and raising rural incomes [3]. The addition of manure would allow assessment of the dynamics of C and organic N and P in the evaluation of sustainable local agroecosystems [22].
The objectives of this study were (1) to study the effect of low-cost organic and mineral fertilizers on
the biomass and yield of millet/cowpea intercrops, and (2) to compare the best combination of organic and mineral fertilizers with low-cost technologies such as the use of an improved cowpea cultivar with an optimum row arrangement in millet/cowpea and millet/non-legume intercropping.
2. Materials and Methods
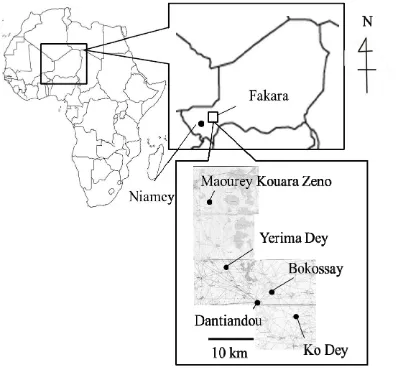
An on-farm experiments was conducted during the 2008 and 2009 cropping seasons in four villages (Bokossay: 13°25.13 N, 2°47.27 E; Yerimadey: 13°28.65 N, 2°42.25 E; Kodey: 13°23.50 N, 2°49.23 E; Mourey Koala Zeno: 13°35.02 N, 2°38.78 E) in the Fakara commune, Dantiandou district, Tillaberi prefecture, western Niger, about 50 km northeast of Niamey, the capital (Fig. 1).
The experimental plots were treated as mother fields of mother-baby trials [23]. There were 61 households in Maourey Kouara Zeno, 90 in Yerima Dey, 51 in Bokossay, and 105 in Ko Dey (2009, pers. comm.). The Zarma are the principal ethnic group of this region. They are agriculturalists engaged mainly in rainfed production of millet (Pennisetum glaucum (L.) R. Br.) and cowpea (Vigna unguiculata (L.) Walp.). The prevailing soil type in the region is Psammentic Paleutalfs, with a high sand fraction and typical characteristics of an infertile soil [24, 25]. The rainfall starts from June until September, with a total rainfall of about 550 mm, which peaks in August [26]. From 2001 to 2007, the annual average rainfall at Kodey was 435 mm. In 2008, the annual rainfall was 442.2 mm within 38 days of rain; in 2009, it was 515.6 mm within 45 days of rain. The mean annual temperature ranged from 22.8 °C to 31.2 °C in 2008, from 23 °C to 36 °C in 2009.
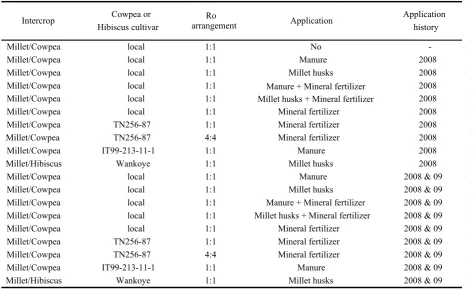
In 2008, in each mother field in each village, ten plots (20 m × 20 m) were established. Six of them received one of six combined fertilizer treatments: three forms of organic fertilizer (none, millet husks, or manure), with or without mineral fertilizer, and grew a millet/cowpea intercrop, using a local cowpea landrace.
Two of them grew millet/cowpea intercrops in 1:1 or 4:4 row arrangements, using a dual-purpose, medium-maturity cowpea line (85 days), TN256-87 [2, 27], with mineral fertilizer. One grew a spreading cowpea line, IT99-213-11-1 [2], with manure. And one grew a millet/hibiscus (Hibiscus sabdariffa, ‘Wankoye’) intercrop, with millet husks. In 2009, the ten plots were each divided into two (9.5 m × 20 m); half of each was fertilized as in 2008, and the other half was not fertilized. Millet received 9 t/ha of cow dung manure, 6 t/ha of millet husks which were derived from refining process of millet head. For application of mineral fertilizer, 3 g of compound mineral fertilizer (N: P2O5: K2O = 15:15:15), and 2 g
of urea per hill were applied at sowing and at first
weeding, respectively with micro-dosing technique [6, 7]. Each experiment used a local millet cultivar, “Haïni tchirey” (120 days to harvest). The experiments were conducted in a strip-plot design with four replications (one per village). Table 1 shows details.
The millet was sown at 1.0 m × 1.0 m, and thinned to three plants per hill after 2 weeks. It was planted in June and harvested in October each year. Cowpea was sown at 1.0 m × 1.0 m. It was planted in July and harvested in October each year. At physiological maturity, millet plants in each plot were harvested and partitioned into ears and stalks. After drying, the ears were threshed and the total biomass was determined. Cowpea plants were also harvested at physiological maturity, partitioned into fodders and pods. After drying, the pods were threshed. All aboveground crop residues were removed from the plots at end of each cropping season.
Soil samples were taken from the top 15 cm, air-dried, crushed, and sieved (2-mm mesh) for chemical analysis. Following wet digestion with salicylic acid-thiosulfate, the total N content was measured at 660 nm with a Technicon Auto-Analyzer II (Pulse Instrumentation Ltd., Saskatoon, SK, Canada) [28]. After extraction with Bray No. 1 solution, available P was measured by the molybdenum blue method [29]. Organic C content was determined by the Walkley-Black method [30].
The air-dry plant samples were ground 3 months after the harvest; 200 mg of each sample was digested with salicylic acid-thiosulfate, and the total N content was measured at 660 nm with the Technicon Auto-Analyzer II. N uptake was determined by multiplying the N concentration by the plant biomass, and the N balance was calculated as atmospheric N minus N uptake. The ratio of atmospheric N in cowpea was taken from Yakubu et al. [31].
On-farm Evaluation of Effect of Organic and Mineral Fertilizers on Biomass and Yield of Millet/Cowpea Intercrop in the Sahel, West Africa
585
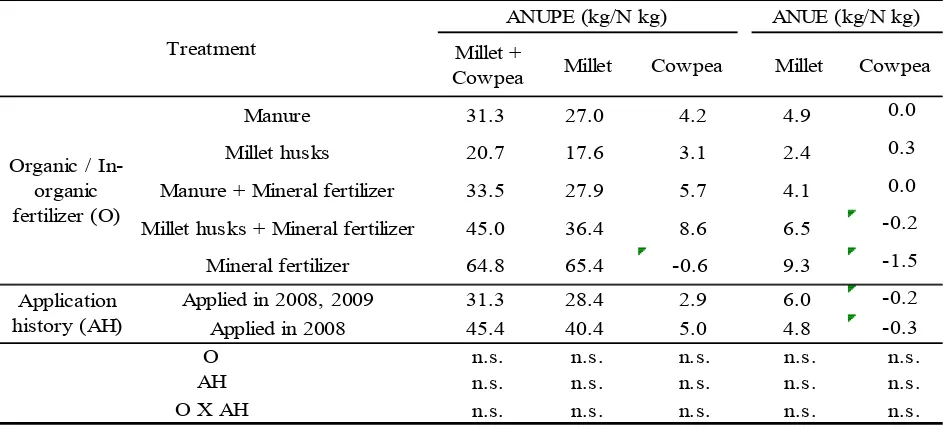
ANUPE = (UBN− UB0)/FN
ANUE = (YN− Y0)/FN
where UBN is aboveground biomass of N-fertilized
plot (kg/ha), UB0 is aboveground biomass of
control plot (kg/ha), FN is amount of fertilizer
N (kg/ha applied), YN is grain yield of N-fertilized
plot (kg/ha), and Y0 is grain yield of control plot
(kg/ha).
The results were tested by analysis of variance (ANOVA) followed by student’s t-test in JMP version 9.0.0 software (SAS Institute, Cary, NC, USA).
3. Results and Discussion
3.1 Effect of Organic and Mineral Fertilizer
With organic fertilizer, the total (millet + cowpea), millet, and cowpea biomass and the millet grain yield decreased in the order of manure > millet husks > control in both 2008 and 2009 (Table 2). Relative to the control, manure increased total biomass by 127%-147% (P < 0.001), millet biomass by
135%-152% (P < 0.001), cowpea biomass by 91%-111% (P < 0.01), and millet grain yield by 130%-184% (P < 0.01). Mineral fertilizer increased total biomass by 27% (P < 0.01), millet biomass by 34% (P < 0.01), cowpea biomass by 14% (P < 0.05), and millet grain yield by 24% (P < 0.05) in 2008. Repeat application of fertilizers in 2009 increased total biomass by 28% (P < 0.05) and millet biomass by 31% (P < 0.05) compared to the application only in 2008. Interactions among fertilizers and application history were not significant except for that between organic and inorganic fertilizers on millet grain yield in 2008 (P < 0.05). Relative to the control, the ratio of millet biomass to total biomass was higher in manure application in 2009 (P < 0.05) and in mineral fertilizer application in both years (P < 0.05). The differences in biomass among fertilizer treatments were due to nutrient availability [33].
As a result of greater N input and uptake, the N balance was greatest and positive in the manure treatment (P < 0.001), followed by millet husks (Table
Table 1 Combination of treatment in experimental plots, Fakara, western Niger.
Intercrop Cowpea or
Hibiscus cultivar
Ro
arrangement Application
Application history
Millet/Cowpea local 1:1 No
-Millet/Cowpea local 1:1 Manure 2008
Millet/Cowpea local 1:1 Millet husks 2008
Millet/Cowpea local 1:1 Manure + Mineral fertilizer 2008
Millet/Cowpea local 1:1 Millet husks + Mineral fertilizer 2008
Millet/Cowpea local 1:1 Mineral fertilizer 2008
Millet/Cowpea TN256-87 1:1 Mineral fertilizer 2008
Millet/Cowpea TN256-87 4:4 Mineral fertilizer 2008
Millet/Cowpea IT99-213-11-1 1:1 Manure 2008
Millet/Hibiscus Wankoye 1:1 Millet husks 2008
Millet/Cowpea local 1:1 Manure 2008 & 09
Millet/Cowpea local 1:1 Millet husks 2008 & 09
Millet/Cowpea local 1:1 Manure + Mineral fertilizer 2008 & 09
Millet/Cowpea local 1:1 Millet husks + Mineral fertilizer 2008 & 09
Millet/Cowpea local 1:1 Mineral fertilizer 2008 & 09
Millet/Cowpea TN256-87 1:1 Mineral fertilizer 2008 & 09
Millet/Cowpea TN256-87 4:4 Mineral fertilizer 2008 & 09
Millet/Cowpea IT99-213-11-1 1:1 Manure 2008 & 09
Table 2 Effect of organic and in-organic fertilizer and application history on biomass and grain of millet / cowpea intercrop at experimental fields, Fakara, Niger in 2008 and 2009.
2008 2009 2008 2009 2008 2009 2008 2009 2008 2009 2008 2009 Manure 3683a 4003a 2491a 3745a 1192a 258a 430a 600a 62 50 0.63 0.92a Millet husks 2348b 2428b 1449b 2223b 898b 205a 286a 340b 88 31 0.60 0.84b Non 1625c 1623c 1059b 1488c 566c 135b 187b 211b 72 28 0.65 0.87b MF 2971a 2813 2004a 2637 966a 177 350a 394 69 30 0.68a 0.89a Non 2348b 2705 1499b 2486 849b 219 283b 395 76 42 0.59b 0.87b Applied in 2008-09 - 3084a - 2892a - 196 - 445 - 32 - 0.90 *, **, *** indicate significantly different at 0.05, 0.01 and 0.001 level, respectively while n.s. indicates no significantly different.
Different alphabets indicate statistically significant at 0.05 level (by Student t test).
Millet biomass ratio
Millet + Cowpea Millet Cowpea Millet Cowpea
Organic matter
Table 3 Effect of organic and in-organic fertilizer and application history on N balance in millet / cowpea intercropping at experimental fields, Fakara, Niger in 2008 and 2009.
2008 2009 2008 2009 2008 2009 2008 2009 2008 2009 2008 2009 Manure 115.9 57.9 20.7a 2.0 18.1 24.3a 30.1a 2.9 88.4a 32.8a 0.4b 6.3 Millet husks 47.3 23.6 19.1a 1.3 10.9 15.0b 27.7a 1.8 27.7b 8.1b 0.6b 6.2 Non 6.9 3.4 12.1b 1.3 8.8 10.1c 17.6b 1.9 -7.4c -7.2c 1.6a 6.3 MF 64.9 32.5 20.3a 1.3 15.2 17.9 29.4a 1.9 40.6a 14.0a 0.7b 6.6 Non 55.0 27.5 14.9b 1.8 11.0 15.9 21.7b 2.6 37.3b 10.8b 1.0a 6.0 Applied in 2008-09 59.5 59.5 17.4 1.4 12.9 19.2a 25.2 2.0 38.8 39.7a 0.8 1.6b
Applied in 2008 59.5 0.0 17.4 1.7 12.9 14.5b 25.2 2.5 38.8 -15.2b 0.8 10.9a - - ** n.s. n.s. *** ** n.s. *** *** *** n.s. *, **, *** indicate significantly different at 0.05, 0.01 and 0.001 level, respectively while n.s. indicates no significantly different.
Different alphabets indicate statistically significant at 0.05 level (by Student t test). O X MF X AH
3). There was a significant difference between organic application and no application in N uptake/input in 2008. Repeat application in 2009 increased N input and uptake by millet by 32% (P < 0.05), and resulted in a bigger positive N balance and a smaller N uptake/input ratio. Use of mineral fertilizer increased N input and uptake by cowpea, which contributed to increase N balance by 9% (P < 0.05) and lower N uptake/input ratio by 30% (P < 0.01) in 2008.
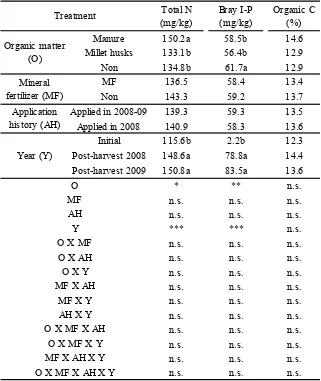
Manure increased total soil N by 11% (P < 0.05, Table 4). No application increased soil P content by
9% compared to millet husks (P < 0.01). Total soil N and P contents increased between years (P < 0.001).
On-farm Evaluation of Effect of Organic and Mineral Fertilizers on Biomass and Yield of Millet/Cowpea Intercrop in the Sahel, West Africa
587
Table 4 Effect of organic and in-organic fertilizer and application history on total soil N, Bray I-P and organic C in millet / cowpea intercrop at experimental fields, Fakara, Niger in 2008 and 2009.
Total N
Millet husks 133.1b 56.4b 12.9
Non 134.8b 61.7a 12.9
MF 136.5 58.4 13.4
Non 143.3 59.2 13.7
Applied in 2008-09 139.3 59.3 13.5 Applied in 2008 140.9 58.3 13.6
Initial 115.6b 2.2b 12.3
Post-harvest 2008 148.6a 78.8a 14.4 Post-harvest 2009 150.8a 83.5a 13.6
* ** n.s.
*, **, *** indicate significantly different at 0.05, 0.01 and 0.001 level, respectively while n.s. indicates no significantly different.
Different alphabets indicate statistically significant at 0.05 level (by Student t test).
As in other pedoclimatic zones, the assessment of N and P in agricultural systems on tropical sandy soils is a useful tool for defining sustainable intensification plans necessary to respond to population increases and global change issues [37, 38].
Mineral fertilizer increased agronomic nitrogen uptake efficiency (hereafter, ANUPE) of total (millet and cowpea) biomass by 107%-213% (n.s.), that of millet biomass by 142%-273% (n.s.), and agronomic