Soil Characteristics of Mud From the Indonesian Mud Volcano “LUSI”
Stephanie Ross
Introduction
Unique among mud volcanoes is “LUSI”, which erupted May 29th 2006 in Sidoarjo, Java, Indonesia, close to heavily populated regions of the island (Davies et al. 2007). Still exuding
mud, it is the largest and longest lasting of reported mud eruptions (Mazzini et al. 2007). Mud
volcanoes usually subside in a few days or weeks (Mazzini et al. 2007), but LUSI has been
erupting for almost 2 years. Before leveling to its current 130,000-150,000 m3/day (Jakarta AFP 2008), the flow rate peaked at 180,000 m3/day (Mazzini et al. 2007), an amount equal to 72 Olympic sized swimming pools. Moreover, the volume of this mud has an unusually high
percentage of water (~70%), which makes it “an outlier at the dilute watery end of the [mud]
volcanoes’ viscosity spectrum” (Cyranoski et al. 2007). An expected percentage would be
approximately 20-40% water (Hovland et al. 1997) given its depth of eruption estimated to be
between ~1615-1828m (Mazzini et al. 2007). Furthermore, there is heavy subterranean pressure
buildup; therefore, the core eruption column has not clogged allowing for continued mud
expulsion (Cyranoski et al. 2007). The magnitude and length of the eruption has been so great
that mud and water have inundated an area of approximately 600 hectares, an area equal to 2200
football fields (Jakarta AFP 2008), and has displaced over 30,000 people (Mazzini et al. 2007).
This is significant considering only 900 of the 1700 known mud volcanoes are terrestrial
(Jerosch et al. 2007) and none of comparable scale has been documented before (Davies et al.
2007).
Most mud volcanoes are studied during periods of dormancy after they have already been
established (Mazzini et al. 2007), whereas LUSI has been monitored since its origin as a
“pioneer mud volcano” (Davies and Stewart 2005). Interestingly, this has lead to a heated
political and scientific debate as to whether the eruption was catalyzed by drilling operations
(Cyranoski et al. 2007, Davies et al. 2007) or by a recent 6.3 magnitude earthquake (Mazzini et
al. 2007). Aside from its unclear origins, LUSI does not categorize well into the three typical
mudflow types (Lokbatan, Chikishlyar, and Schugin) as described by Dimitrov (2002, taken
from Kalinko, 1964), which are summarized as follows: Lokbatan type: explosive with flames
from ignited gasses and long periods of dormancy, well formed cones with high water content;
Chikishlyar type: weak continuous eruption that lacks explosiveness, many vents emitting gasses
and mud, pool-like, or only very slightly conic; Schugin type: represents the transitional type of
presumably with minimal mudflow. Comparing these characteristics to LUSI’s makes it clear
that LUSI does not fit in with any of these three classifications. Like the Lokbatan type, LUSI
has high water content, but LUSI has had no long periods of dormancy, nor is LUSI conic in
shape. Although LUSI is flat and not conic in shape, unlike the Chikishlyar type LUSI is not
represented by weak activity, nor does it have more than one distinguishable epicenter. LUSI
has least in common with the Schugin type, with neither weak activity, nor minimal mudflow.
Since LUSI does not categorize well into the three established mud volcano types, it is plausible
that its mud characteristics are also anomalous relative to other mud volcanoes.
Numerous other mud volcanoes have been studied at the Alaskan Mountains (Sorey et al.
2005), Azerbaijan (Gallagher 2003), the Gulf of Cadiz (Hensen et al. 2007), Mt.Etna
(Giammanco et al. 2007) etc. Usually such studies test or monitor gaseous effluxes (Giammanco
et al. 2007) and fluid mosaics (Hensen et al. 2007), which refers to the variety of fluids (oil,
brine, etc.) that may be present in the mud, and their possible origins from underground. Despite
being new, even LUSI has had its gas and water composition extensively analyzed by Mazzini
and colleagues (2007), but LUSI’s mud composition has not yet been investigated other than for
the purpose of determining the depth of its epicenter (Mazzini et al. 2007). Some trends do
emerge from studies of other mud volcanoes that could be seen in LUSI’s mud composition such
as a basic pH of the mud (Ginsburg et al. 1999, Kopf 2002). Despite a few potential points of
commonality with other mud volcano studies, there are few, if any, mud volcano studies with
data relevant to my study. The reason for this lack of comparability is because gaseous efflux
and fluid mosaic data are measured in units different than those measured in this study; this study
investigates characteristics of the mud itself. For example, carbon levels are not typically
presented with respect to nitrogen levels, but rather as a component of carbon dioxide levels
(Dimitrov 2002, Giammanco et al. 2007, Mazzini 2007). Hence, carbon is typically measured as
a component of a gas and is therefore incomparable to carbon levels present in mud itself. This
study explores factors that are more applicable to tropical soil studies because this data will
ultimately provide more useful information about the ecology and restoration of the area.
There are a number of environmental factors relating to the recovery of the region that could
be influenced by the composition of the mud. Alteration of the substrate, species recolonization,
and habitat restoration are a few issues that will eventually have to be considered in order to
recolonize the area, and the ability of plants to do so will be in turn affected by the mud itself.
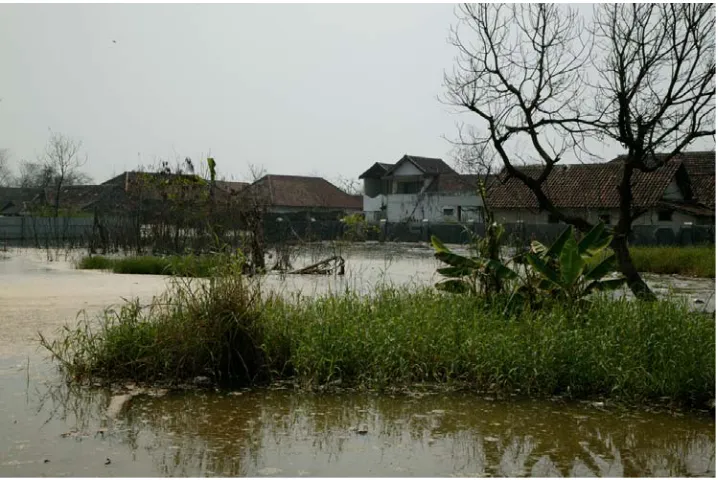
Since the land is still barren nearly 2 years later, (except for a few patches of grass and struggling
palm trees in the swampy areas, see Fig. 1) it appears that it is difficult for plants to colonize the
mud. To better understand why plants may have difficulty colonizing the mud, this study
investigates soil characteristics that may facilitate or hinder plant growth. Identifying factors that
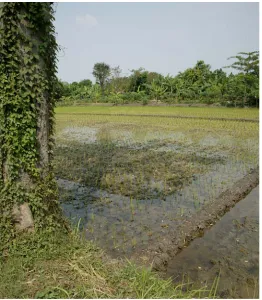
affect plant growth is particularly important because previous to the mudflow rice paddies
characterized some of the area (Davies et al. 2007, see Fig. 2) and the decline in local availability
of such a staple food has probably caused further negative impact on the economy. Factors that
may indicate whether rice farming can be successful on the new substrate will be very important
in determining the agricultural usefulness of the land. If rice is unlikely to be successful because
of the mud’s characteristics, it may be possible to identify other crops that are better suited for
the land, such as wheat or corn. Furthermore, since the mud has destroyed so many villages,
potential alternative uses of the mud (such as housing materials) would greatly benefit the
displaced. Although this study is not directly aimed at categorizing the mud for this intention, it
may indicate advantages or disadvantages of using the mud for such purposes. Most
importantly, however, are characteristics of the mud that will influence plant recolonization
because these characteristics will ultimately affect the recovery of the entire ecosystem.
Figure 2. A rice paddy only minimally affected by the mudflow. Similar rice paddies were common in the area that was covered by the mudflow. Photo by Jody Champlin.
This study specifically focuses on three characteristics of LUSI’s mud: the carbon to nitrogen
ratio (C:N), pH and cation exchange capacity (CEC). These specific factors were chosen
because each one can have a significant influence on plant growth and they are relatively easy to
test for given the sampling constraints (discussed in Methods). C:N was chosen because
nitrogen (N) is the most important element for plant growth (Marschner 1995), and C:N is a
useful indicator of N availability to plants (Kirschbaum et al. 2008) More specifically, if C:N is
found to be high, then N would be immobilized by soil microbes and therefore be less available
to plants. (This is because microbes are better competitors for available soil N.) Such a situation
would require either N fertilization or planting nitrogen-fixing species to solve the low problem.
Alternately, if C:N is found to be low, then this would indicate that there is not much
competition for N between microbes and plants, so more N would be available for plants.
LUSI’s mud comes from deep underground so it has not been exposed to biological N inputs and
so may have low N. The next factor, pH was chosen because the pH of LUSI’s mud will
for plants accustomed to the pre-mudflow conditions. The pH of most tropical soils tends to be
on the acidic side (3.9-6.3, from Motavalli et al. 1995) and LUSI’s mud is probably basic
because like other mud volcanoes, LUSI has a clayey composition that tends to correlate with
basic pH (Ginsburg et al. 1999). Finally, CEC is important because many cations are essential
nutrients for plant growth (Marschner 1995). The CEC of a soil can also be important in
maintaining stable pH levels (Landon 1984). Since plants extract cations for uptake by
exchanging them with hydrogen ions (H+), the level of H+ in the LUSI’s mud is probably low since the mud came from belowground. Therefore, LUSI’s CEC is probably going to be high
relative to tropical soil data.
To test C:N, pH and CEC characteristics of LUSI I had samples shipped to me, and I tested
the mud in the Silver Laboratory located on The University of California, Berkeley campus.
Each test was conducted under the instruction and guidance of a laboratory technician or
graduate student, and the results were compared to tropical soils to place them within a context
(described in more detail in Methods). The overall objective of this study is to develop a general
fertility index of LUSI’s mud by testing for C:N, pH and CEC. The particular questions that this
study addresses are: What are the C:N, pH and CEC of LUSI’s mud? How do they compare to
tropical soil data? What are the implications for species recolonization and future land use? For
reasons indicated above, I hypothesized that LUSI’s C:N would be low, pH would be high
(basic), and CEC would be high.
Methods
In order to test LUSI’s mud, samples were taken from various locations within the LUSI mud
volcano site in Sidoarjo, Java. Due to political problems pertaining to the eruption and
Indonesia’s current position on the U.S.’s Travel Warning list, I was unable to take my own
samples. Three individuals collected sets of samples for me, which were sent to the Silver lab at
The University of California, Berkeley. All tests were conducted in the Silver and Firestone
laboratories. The first set of samples was provided from Adriano Mazzini’s field exploration of
LUSI. Jody Champlin, my aunt, provided the second set of samples, which were taken under
strict instructions. Prajna Murdaya, a family friend provided the third sample set. There are six
samples from Mazzini, seven samples from Champlin and the one large sample from Murdaya.
to the Silver lab. Champlin’s samples were taken using clean spoons, and each sample was
placed into clean double zip-loc bags, sent to me and then taken directly to the Silver lab.
Murdaya’s sample was taken using a clean empty bottle and mailed directly to the Silver lab. All
samples were kept refrigerated when not in transit. Mazzini’s samples were collected from more
central locations close by the epicenter, whereas Champlin’s and Murdaya’s samples were
collected from sites around the more accessible perimeter regions. Samples taken by Champlin
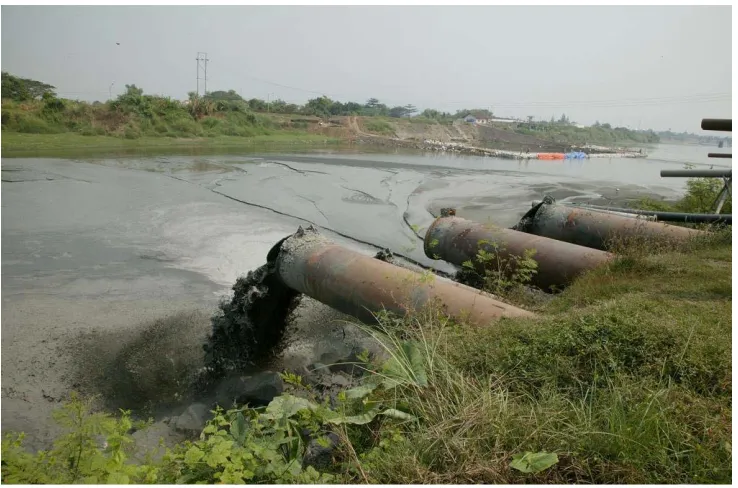
represent sites from all around the perimeter of the mudflow, including sites at the Porong River
where the mud is being diverted via storm drains (see Fig. 3). Murdaya’s sample was taken from
the northeast edge of the flow. One of the samples from Mazzini (C6) probably does not
represent LUSI mud. C6 was taken to determine if it represented an outcrop of LUSI mud and
so far, all tests indicate that it is not LUSI mud (Mazzini 2008, pers. comm.).
Figure 3. A network of storm drains divert mud from the eruption site into the nearby Porong River to prevent overflow and breakage of the dykes, which keep the mud from further expansion. Photo by Jody Champlin.
To better understand the implications of my results, I conducted a focused literature review
of tropical soil studies and drew comparisons from the most representative papers. I decided to
compare LUSI’s data to tropical soil data because Java is originally a tropical region, and even
though some areas were converted to cropland (mostly rice paddies), the fundamental, unaltered
soil type is generally tropical. Attempting to account for unquantifed variations within the
this study. Also, since tropical soils are typically very nutrient poor (Silver 1994, Vitousek and
Sanford 1986), comparing LUSI’s mud to the most depleted soils will help indicate the relative
fertility of LUSI’s mud.
In order to determine C:N ratios, carbon and nitrogen levels were tested using a NC 2100
Carbon and Nitrogen analyzer (CE Instruments, Lakewood, NJ, U.S.A.). Samples were first
dried and then ground to a fine material using 2mm sieves and a porcelain mortar and pestle. In
between samples these were cleaned using de-ionized water, hydrochloric acid and acetone.
Subsets of these were wrapped in tin foil and then placed in the analyzer for successive
incineration at 1000°C and 600° respectively. To confirm accuracy, blanks were conducted
every eight samples and the C:N standard error (S.E.) of LUSI samples (.966%) was well within
the allowed S.E. of 5%. Soil pH was measured twice for each sample to ensure accuracy. pH
was measured with an Ultra Basic pH/mV Meter (Denver Instruments, Denver, Colorado,
U.S.A.) in a solution of 1:1 ratio of sample mud to de-ionized water. CEC testing was divided
into two days because it took about ten hours to complete CEC testing for eight of the samples;
samples were tested under the guidance graduate student Katherine Smetak. Total CEC, was
tested to determine the amount of total nutrient cations present in the mud. Samples were dried
and ground using the same methods described for the C:N samples and five grams of each
sample were tested. The CEC was tested using an unbuffered salt extraction method (Sparks
1996); NH4Cl saturating solution was used to displace exchangeable Na, K, Ca, Mg, and Al.
Since LUSI’s mud comes from a single epicenter the mud should be fairly homogenous
throughout the site, so the limited number of samples should not limit accuracy. A slightly
greater variation among the perimeter samples is to be expected because of possible additions of
other soils and contaminants due to foot and road traffic along the perimeter. Despite these
potential inputs the samples should still be a good representation of the mudflow’s characteristics
because LUSI is still erupting and fresh mud is constantly spreading throughout the site.
Results
LUSI’s samples were found to have fairly similar C:N ratios, varying no more than 4%. This
comparison excludes the data point C6 because its C:N ratio (20.59) was almost one and a half
times higher than the perimeter samples and almost twice as high as the central samples. Despite
low end of Trumbore’s (1993) tropical soil C:N ratio range = 10.3-27. The low C:N for LUSI’s
samples are explained by the low % nitrogen values (0.1076% N ± 0.0052, n = 13) they
exhibited. C6 has the highest C:N value because its % carbon (2.903%) is over one and a half
times greater than any other sample. The rest of the samples had low % C (1.293% C ± 0.0448,
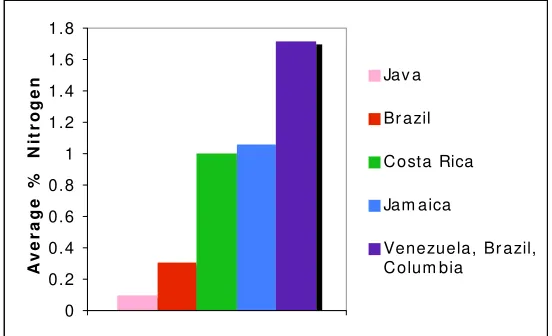
n = 13), even when compared to tropical soil %C (2.129% C ± .475, n = 7). Tropical soils have
comparatively higher % N averages than LUSI’s mud by up to 1.6% N (see Fig. 4). All LUSI
samples were found to have basic pH, mean = 8.22 ± 0.062, n = 13. The C:N outlier C6 fell
within the middle of this range with a pH of 8.21, although it was not included in the calculation.
LUSI’s pH values are more basic than tropical soil pH’s, which range on the acidic side (see
Table 2b and Fig. 5). LUSI’s CEC data had a somewhat more varied range, from mean = 19.72
cmol+/kg ± 1.28, n = 12. Due to a procedural error, sample P6 had an erroneous value for CEC (96.91 cmol+/kg) and has therefore been omitted from calculations along with the outlier C6. LUSI’s mean CEC is almost several times higher than the representative tropical soil CEC (6.55
cmol+/kg ± 1.12, n = 9) (Motavalli et al. 1995). Below are tables of LUSI and tropical soil data.
Figure 4 Nitrogen averages from tropical soil studies from various countries and LUSI (Java). Brazil data from Trumbore 1993, Costa Rica data from Heaney and Proctor 1989, Jamaica data from Tanner 1977 (Cited in Vitousek 1984), and Venezuela, Brazil and Colombia data from Vitousek and Sanford 1986.
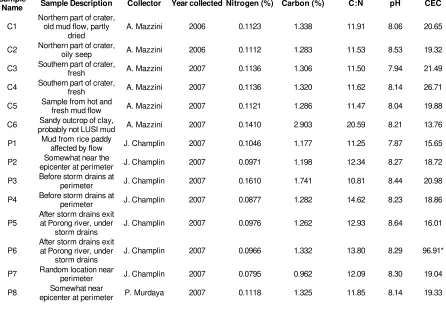
Table 1. Carbon and Nitrogen percentages, C:N ratio, pH and CEC for different LUSI samples. P1= Perimeter-Murdaya-1, C1= Central-1, C2= Central-2 and so on. *A procedural error occurred during CEC testing for P6 that resulted in a wildly erroneous value, so it is not included in calculations.
Table 2a Carbon and Nitrogen percentages, C:N ratio, pH and CEC for Tropical soil data. Carbon and Nitrogen data taken from Trumbore, 1993.
Soils 1 Depth (cm) Nitrogen (%) Carbon (%) C:N
Name Sample Description Collector Year collected Nitrogen (%) Carbon (%) C:N pH CEC
Table 2b pH and CEC taken from Motavalli et al. 1995. Soil depth applies for pH and CEC. CEC is measured in centi-moles per kilogram. pH method- 2.5:1 soil-water v/v ratio. CEC exchange procedure with NH4NO3 and KCl.
Soils 2 Soil Depth (cm) pH (cmolCEC +/kg)
Yurimaguas (Peru) 0-8 6.3 10.88
Manaus (Brazil) 0-8 3.9 3.20
Colonia (Brazil) 0-8 4.2 2.68
Valenca (Brazil) 0-8 4.4 3.58
Ouro Preto (Brazil) 0-12 4.9 2.60
Una (Brazil) 0-12 5.7 3.06
Birrisito (Costa Rica) 0-12 4.3 2.23
Tierra Blanca (Costa Rica) 0-10 4.8 6.35
Popayan (Colombia) 0-8 5.7 7.67
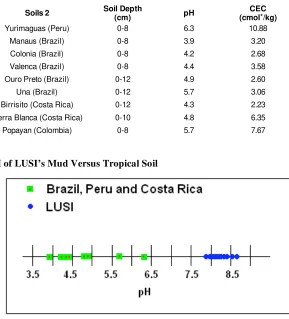
pH of LUSI’s Mud Versus Tropical Soil
Figure 5. pH values for LUSI mud samples compared to tropical soil pH’s taken from various tropical forests in Brazil, Peru, and Costa Rica from Motavalli et al. 1995.
Discussion
LUSI’s C:N ratios were quite low even when compared to tropical soil C:N ratios, which
confirmed my hypothesis about C:N. As discussed in the introduction, low C:N ratios indicate
that N should be more available to plants because microbes are not competing for it. However,
there is a flaw in applying this comparison to my data that I did not foresee; the actual %N of
LUSI’s mud is extremely low, even when compared with depleted tropical soils. Therefore a
low C:N ratio is not a good indication of N availability in LUSI’s mud because there is so little N
to begin with. LUSI’s %C is also low compared to tropical soil %C, but was only less than half
the tropical soil %C (1.293% / 2.129% = 0.607). This is contrasted to LUSI’s %N, which was
times smaller than the largest tropical soil %N (0.1076% / 1.71% = .0629). What these results
indicate is that LUSI’s mud is generally poor in both carbon and nitrogen. While the low
nitrogen is more of a problem, fertilization of both elements may be necessary for effective plant
recolonization.
LUSI’s pH is not only basic relative to tropical soil pH from Motavalli et al. (1995), but is
actually on the basic side of the pH spectrum, which confirms my hypothesis about pH. The
potential problems that could arise from the mud’s basic pH are not as immediately evident as
the low nitrogen issue. However, intuitively, a pH that is significantly different than the original
substrate’s pH is going to be a problem. If the region’s native plants have adapted for an acidic
pH (which seems likely considering Java’s climate and the typical acidity of tropical soil pH,
Motavalli et al. 1995, Ewel et al. 1991) then the plants would have a difficult time recolonizing
the mud. The same issue would be true for crops. To restore some of the area to rice paddies or
cropland would probably require alteration of the substrate’s pH. If nothing is done to modify
the basic pH of the mud, then only plant species that tolerate basic pHs will be able to grow
successfully (Chapin 1980).
The total CEC of LUSI’s mud turned out to be fairly high compared to tropical soil CEC,
which confirmed my third hypothesis. A high CEC indicates that there is a reasonable amount of
nutrient cations present in the mud, which may make plant recolonization less problematic,
unlike LUSI’s C:N and pH results. LUSI’s CEC was three times greater than tropical soil CEC
(6.55 cmol+kg-1 / 19.72 cmol+kg-1 = .3321) (Motavalli et al. 1995). The only problem with the CEC data is that the test did not exclude the cation aluminum, which is not a plant nutrient, and
can even be toxic to plants. Aluminum was not specifically excluded for because the
descriptions of the mud and its sources by Mazzini et al. (2007) and Mazzini pers. comm. (2008)
indicate that aluminum should not be a significant factor in the total CEC. Therefore, the high
CEC for LUSI’s mud will probably facilitate more successful plant recolonization.
A fourth characteristic that may also prove to be a problem for LUSI’s habitat restoration is
the extreme hardness of the desiccated mud. This was an unanticipated observation that I made
after I began grinding my samples through the 2mm sieves. The few plants that have been able
to grow in the mud are only seen in the areas that are still lake-like (see Fig. 1) and this of might
be because the dried mud is too dense for roots to grow in. LUSI’s mud is primarily composed
together very tightly. While this factor may pose an issue for plant colonization, it may point to
another alternative use for the mud. Since so many people had their homes submerged in the
mud, investigating potential methods to alter the mud into a building material could provide an
extremely valuable use for the mud. Building materials in this area are so scarce that workers
have been salvaging lumber by disassembling the partially submerged homes in the mudflow
(Cyranoski 2007). Such an alternative use of the mud could provide a new source of building
materials as well as income for the homeless if they were allowed access to the mud.
Unfortunately, widespread use of the land and mud for housing materials will have to wait until
the eruption stops. Despite the enormous volume erupting daily, which is causing the surface to
subside by as much as 50cm a day (Mediacenter 2008), no study has estimated an end to the
eruption (Mazzini et al. 2007, Davies et al. 2006, Cyranoski 2007). Ultimately, widespread
restoration of the site will be next to impossible because the mud has completely destroyed the
entire ecosystem.
Conclusions
LUSI’s mud has highly unusual characteristics, with a low C:N ratio, basic pH and high
CEC. Specifically, the low % N and basic pH will likely impede effective plant growth in the
mud. Even compared to depleted tropical soils, the mud’s characteristics seem to render it rather
inhospitable, despite having a high CEC. Considering how hard the desiccated regions of the
mudflow are, the mud could be an used as an effective housing material. Investigating potential
methods to use the mud as a housing material could provide a significant source of capital for the
displaced individuals. This is especially important because there is so little federal money
available for mudflow victims because the Indonesian government has spent hundreds of
millions of dollars dealing with the issue (Harsaputra and Nugroho 2007) and has no more
money left for the victims. Even the food supply the government has been supplying to the
victims was stopped as of May 1, 2008 (Radar Sidoarjo 2008). With this setback, the families
displaced by the mudflow will have to fend for themselves until the eruption ceases. Only once
the eruption stops will the victims of the mudflow be able to rebuild their lives.
Acknowledgements
The countless hours of help and instruction that all the professors and GSI’s have put in are
mentor Whendee Silver, along with Michael Manga who provided me with the project idea. My
sample providers: Prajna Murdaya, Adriano Mazzini and my aunt Jody Champlin who went out
References
Accaino, F., A. Bratus, S. Conti, D. Fontana, and U. Tinivella. 2007. Fluid seepage in mud volcanoes of the northern Apennines: An integrated geophysical and geological study. Journal of Applied Geophysics, 63: 90-101.
Aliyev, A. 2004. Is it possible to forecast the mud volcano eruption? Bulletin of Mud Volcanology, (1). Laboratory of Mud Volcanism, GIA. http://bulletin.gia.az/
Bouldin, D.R. 1986. The chemistry and biology of flooded soils in relation to the nitrogen economy in rice fields. Nutrient Cycling in Agroecosystems, 9: 1-2.
Chapin, F.S. 1980. The mineral nutrition of wild plants. Annual Review of Ecological systems, 11: 233-260.
Cyranoski, D. 2007. Muddy Waters. Nature, 445: 812-815.
Davies, R.J., and S.A. Steward. 2005. Emplacement of giant mud volcanoes in the South Caspian Basin: 3D seismic reflection imaging of their root zones. Journal of the Geological Society [London], 162: 1-4.
Davies, R.J., R.E. Swarbrick, R.J. Evans, and M. Huuse. 2007. Birth of a mud volcano: East Java, 29 May 2006. GSA Today, 17: 4-9.
Dimitrov, L.I. 2002. Mud Volcanoes- the most important pathway for degassing deeply buried sediments. Earth-Science Reviews, 59 (1-4) 49-76.
Ewel, J.J., M.J. Mazzarino, and C.W. Berish. 1991. Tropical Soil Fertility Changes Under Monocultures and Successional Communities of Different Structure. Ecological Applications, 1 (3) 289-302.
Gallagher, R. 2003. Mud Volcanoes Mysterious Phenomena Fascinate Scientists and Tourists. Azerbaijan International, 11 (2) 44-49.
Geissen V. and G.M. Guzman. 2006. Fertility of tropical soils under different land use systems- a case study of soils in Tabasco, Mexico. Applied Soil Ecology, 31: 169-178.
Giammanco S., F. Parello, B. Gambardella, R. Schifano, S. Pizzullo, and G. Galante. 2007. Focused and diffuse effluxes of CO2 from mud volcanoes and mofettes south of Mt. Etna
(Italy), Gas geochemistry and Earth degassing. Journal of Volcanology and Geothermal Research, 165 (1-2) 46-63.
Harsaputra, I. And I.D. Nugroho. 2007, June 28. Mud victims left high and dry. The Jakarta Post. The Jakarta Post. 25 (63) 1-2.
Harsaputra, I. and R. M. Sijabat. 2006, September 5. [Kabar Indonesia] Mudflow victims vent their anger. The Jakarta Post (1).
Hensen C, M. Nuzzo, E. Hornibrook, L.M. Pinheiro, B. Bock, V.H. Magalhães, W. Brückmann. 2007. Sources of mud volcano fluids in the Gulf of Cadiz—indications for hydrothermal imprint. Geochimica et Cosmochimica Acta, 71: 1232-1248.
Hovland M., A. Hill, and D. Stokes. 1997. The Structure and Geomorphology of the Dashgil mud volcano, Azerbaijan. Geomorphology, 21: 1-15.
Hobbie, S.E. and P.C. Brooks. 2007. Microbial Biomass Carbon and Nitrogen by the Chloroform Fumigation/Direct Extraction Method (CFDE), 5.
Hughes, J. B. and J.J. Hellmann. 2005. The application of rarefaction techniques to molecular inventories of microbial diversity. Methods in Enzymology, 397: 292-308.
Jakarta AFP. 2008, April 9. Indonesia finds flammable gas near mud volcano: official. Jakarta AFP. Jakarta, Indonesia.
http://www.terradaily.com/reports/Indonesia_finds_flammable_gas_near_mud_volcano_offi cial_999.html
Jeffries P, S. Gianinazzi, S. Perotto, K. Turnau, J.M. Barea. 2003. The Contribution of arbuscular mycorrhizal fungi in sustainable maintenance of plant health and soil fertility. Biology and Fertility of Soils, 37: 1-16.
Kalinko, M. 1964. Mud volcanoes, reasons of their origin, development and fading. VNIGRI 40: 30-54.
Kirschbaum M.U.F., L.B. Guo, R.M. Gifford. 2008. Observed and modeled soil carbon and nitrogen changes after planting a Pinus radiata stand onto former pasture. Soil Biology and Biochemistry, 40: 247-257.
Kopf A. J. 2002. Significance of Mud Volcanism. Review of Geophysics, 40 (2).
Lal, R. 1987. Tropical Ecology and Physical Edaphology. Agricultural systems, 25 (1) 82-83.
Landon J. R. 1984. A practical approach to land evaluation from the practicing soil surveyor's point of view. Booker tropical soil manual: a handbook for soil survey and agricultural land evaluation in the tropics and subtropics, New York.
Lloyd J. and J.A. Taylor. 1994. On the temperature dependence of soil respiration. Functional Ecology 8: 315-323.
Marschner H.1995. Mineral nutrition of higher plants, second edition. Academic press, London. 889 pp.
Martin J.B., M. Kastner, P. Henry, X. Le Pichon, S. Lallement. 1996. Chemical and isotopic evidence for sources of fluids in a mud volcano field seaward of the Barbados accretionary wedge. Journal of geophysical research, 101: 20325-20345.
Mazzini A., H. Svensen, G.G. Akhmanov, G. Aloisi, S. Planke, A. Malthe-Sørenssen, and B. Istadi. 2007. Triggoring and dynamic evolution of the LUSI mud volcano, Indonesia. Earth and Planetary Science Letters, 261: 375–388.
Mazzini A. 2008, Mar. 8. Professor and researcher, University of Oslo, Oslo, Norway. Personal Communication.
Mediacenter. 2008, April 30. Mudflow Sidoarjo. Porong-East Java, Indonesia. http://mudflow-sidoarjo.110mb.com/
Milkov, A.V. 2000. Worldwide Distribution of submarine mud volcanoes and associated gas hydrates. Marine Geology, 167: 29-42.
Motavalli, P.P., C.A. Palm, W.J. Parton, E.T. Elliot, and S.D. Frey. 1995. Soil pH and organic dynamics in tropical forest soils: evidence from laboratory and simulation studies. Soil Biology and Biochemistry, 27 (12) 1589-1599.
Radar Sidoarjo. 2008, April 12. Mudflow Sidoarjo. Porong, East-Java, Indonesia. .
http://mudflow-sidoarjo.110mb.com/
Reuters Foundation. 2007, March 20. Indonesia mud torrent halts briefly after 10 months. Jakarta, Indonesia.
http://www.reliefweb.int/rw/RWB.NSF/db900SID/JBRN-6ZGJER?OpenDocument&rc=3&emid=AC-2006-000170-IDN
Silver, W.L. 1994. Is nutrient availability related to plant nutrient use in humid tropical forests? Oecologia, 98: 336-343.
Sorey M.L., C. Werner, R.G. McGimsey, and W.C. Evans. 2005. Hydrothermal Activity and Carbon-Dioxide Discharge at Shrub and Upper Klawasi Mud Volcanoes, Wrangell
Mountains, Alaska. U.S. Geological Survey Water-Resources Investigations Report 00-4207.
Tanner, E.V. J. 1977. Four montane rainforests of Jamaica: A quantitative characterization of the floristics, the soils, and the foliar mineral levels, and a discussion of the interrelations. Journal of Ecology, 65: 883-918.
Treves, B. 1985. Mud volcanoes and shale diapirs. Their implications in accretionary processes. A review, Acta Naturalia de l’Ateneo Parmense, 21: 31-37.
Trumbore, S.E. 1993. Comparison of Carbon Dynamics in Tropical and Temperate Soils Using Radiocarbon Measurements. Global Biochemical Cycles. 7 (2) 275-290
Van Nooren, R. 2006, August 29. Mud Volcano Floods Java. Nature News, BioEd Online.
http://www.bioedonline.org/news/news.cfm?art=2755
Vitousek, P.M. 1984. Litterfall, nutrient cycling, and nutrient limitation in tropical forests. Ecology, 65: 285-295.